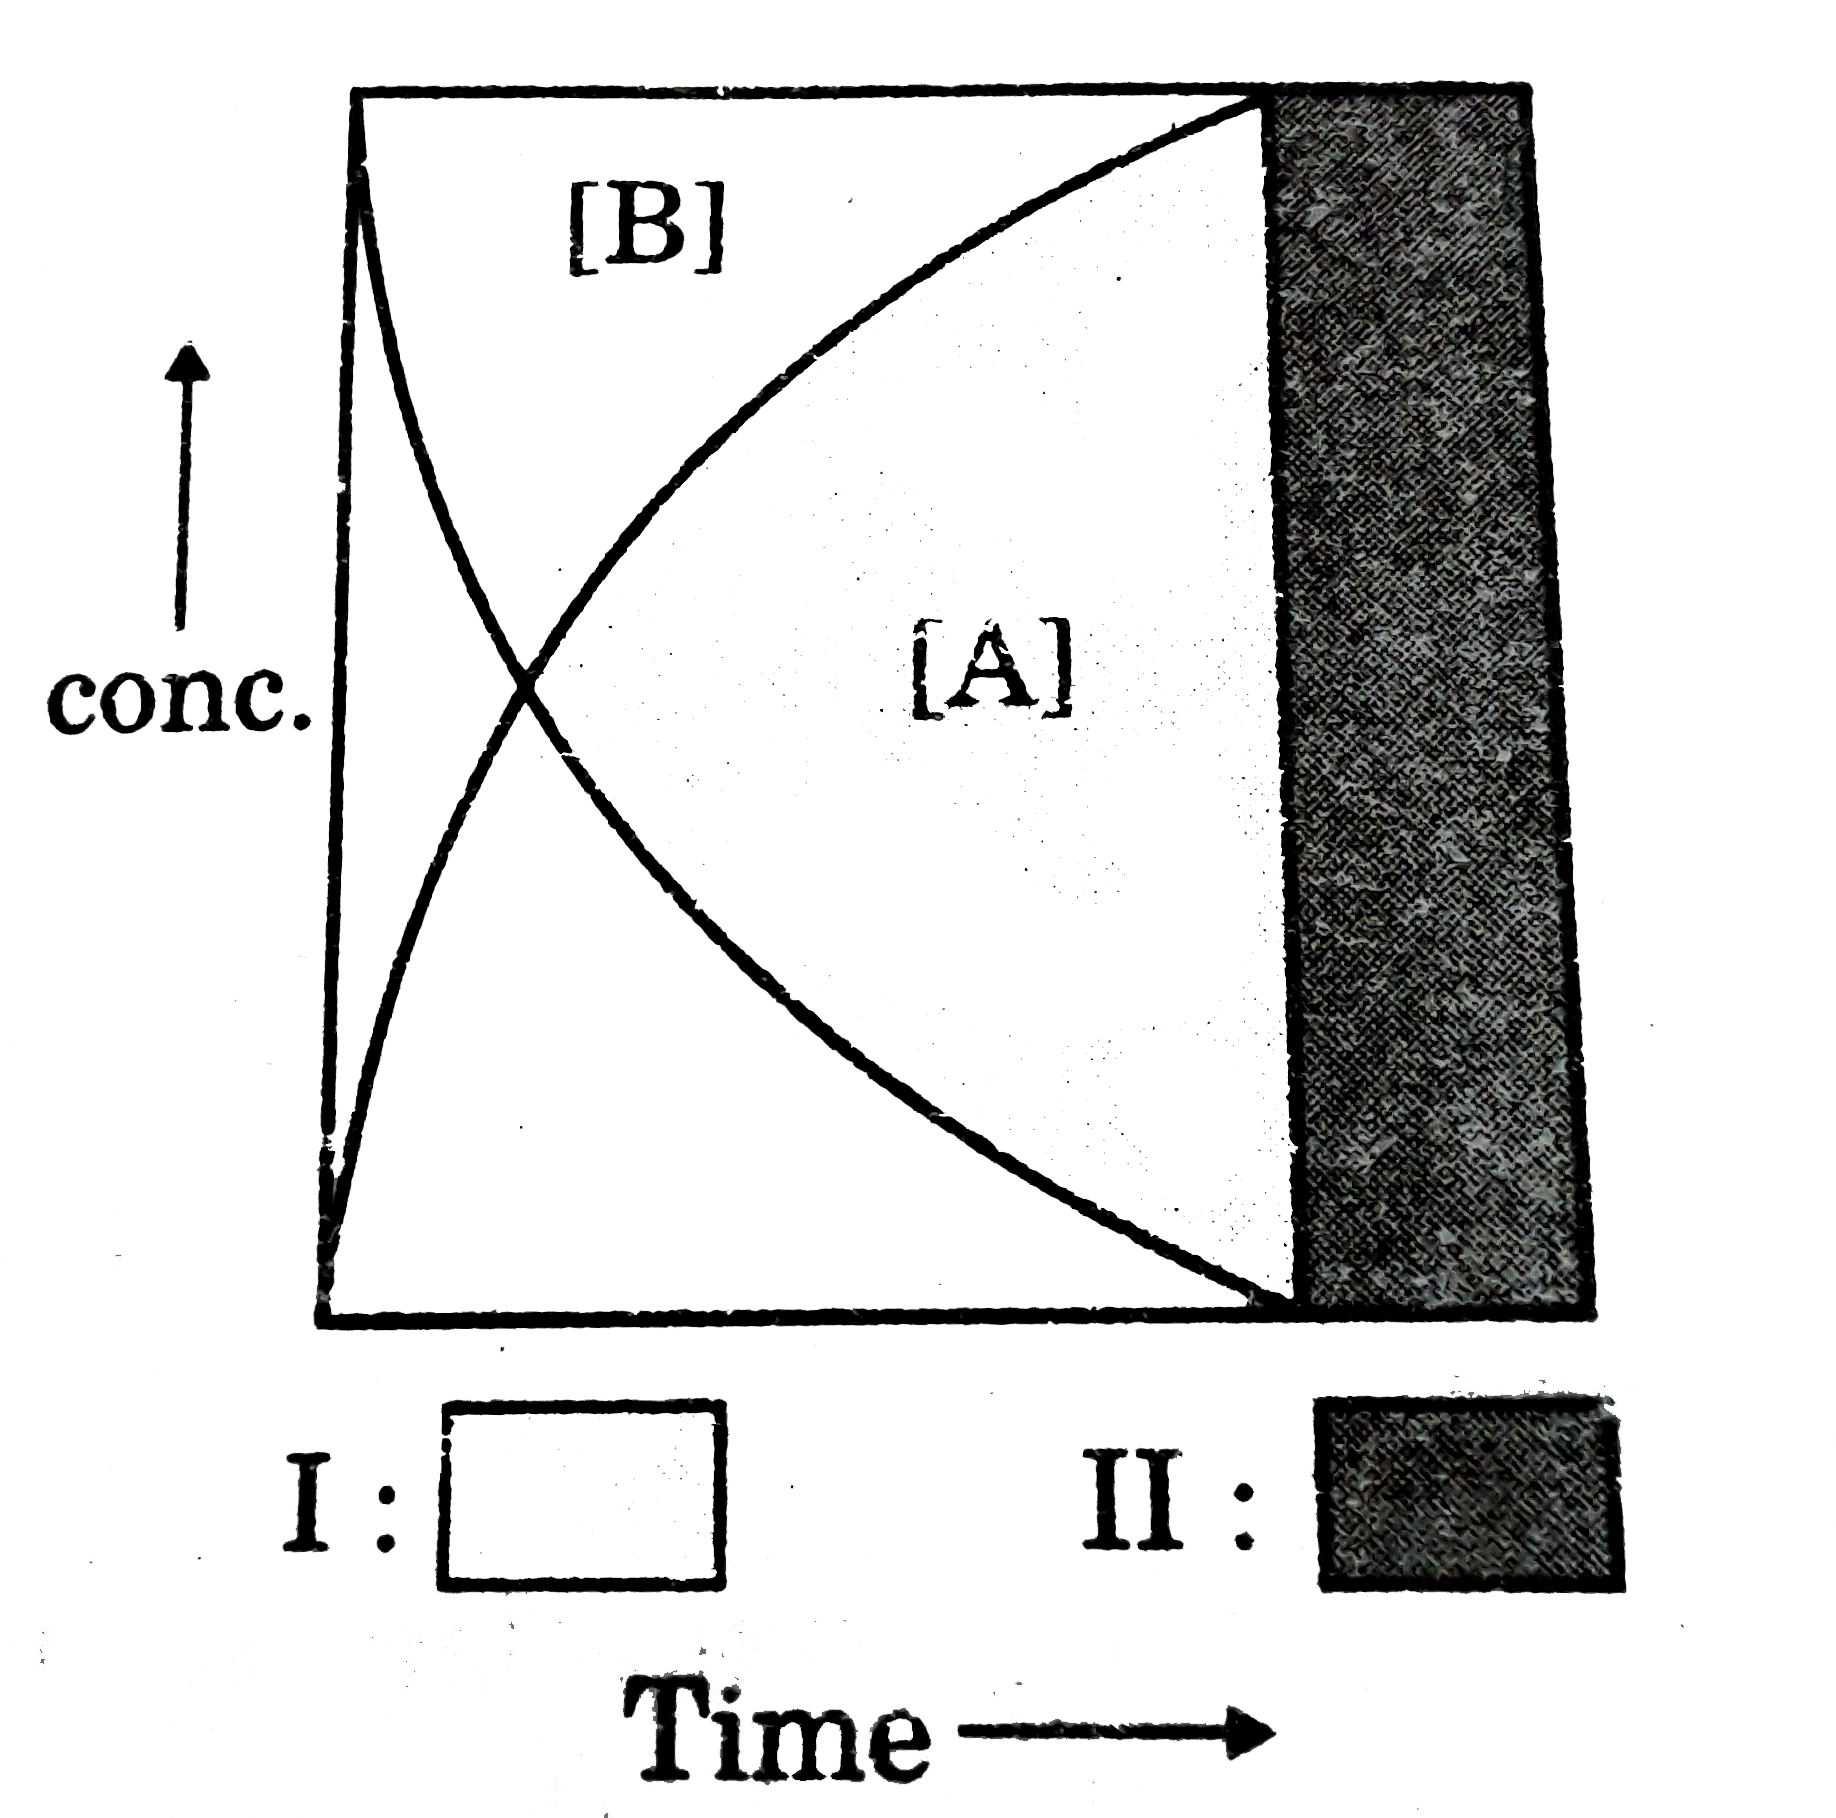
In the following graphical representation for the reaction A→B there are two types of regions :
A
I and II both represents kinetic region at different interval
B
I and II both represents equilibrium regions at different time interval
C
I represents kinetic while II represents equilibrium region
D
I represents equilibrium while II represents kinetic regions
Video Solution
Text Solution
The correct Answer is:C
|
Answer
Step by step video, text & image solution for In the following graphical representation for the reaction A rarr B there are two types of regions : by Chemistry experts to help you in doubts & scoring excellent marks in Class 12 exams.
Updated on:21/07/2023Topper's Solved these Questions
- GRAPHICAL INTERPRETATIONBook:GRB PUBLICATIONChapter:GRAPHICAL INTERPRETATIONExercise:I.Electrochemistry
Explore 1 Video
- GRAPHICAL INTERPRETATIONBook:GRB PUBLICATIONChapter:GRAPHICAL INTERPRETATIONExercise:Electrochemistry
Explore 9 Videos
- GRAPHICAL INTERPRETATIONBook:GRB PUBLICATIONChapter:GRAPHICAL INTERPRETATIONExercise:H. Chemical Kinetics
Explore 1 Video
- F-BLOCK ELEMENTSBook:GRB PUBLICATIONChapter:F-BLOCK ELEMENTSExercise:Subjective type
Explore 7 Videos
- HYDROCARBON (ALIPHATIC)Book:GRB PUBLICATIONChapter:HYDROCARBON (ALIPHATIC)Exercise:Previous years jee questions
Explore 28 Videos
Similar Questions
Knowledge Check
Select the correct graphical representation :
A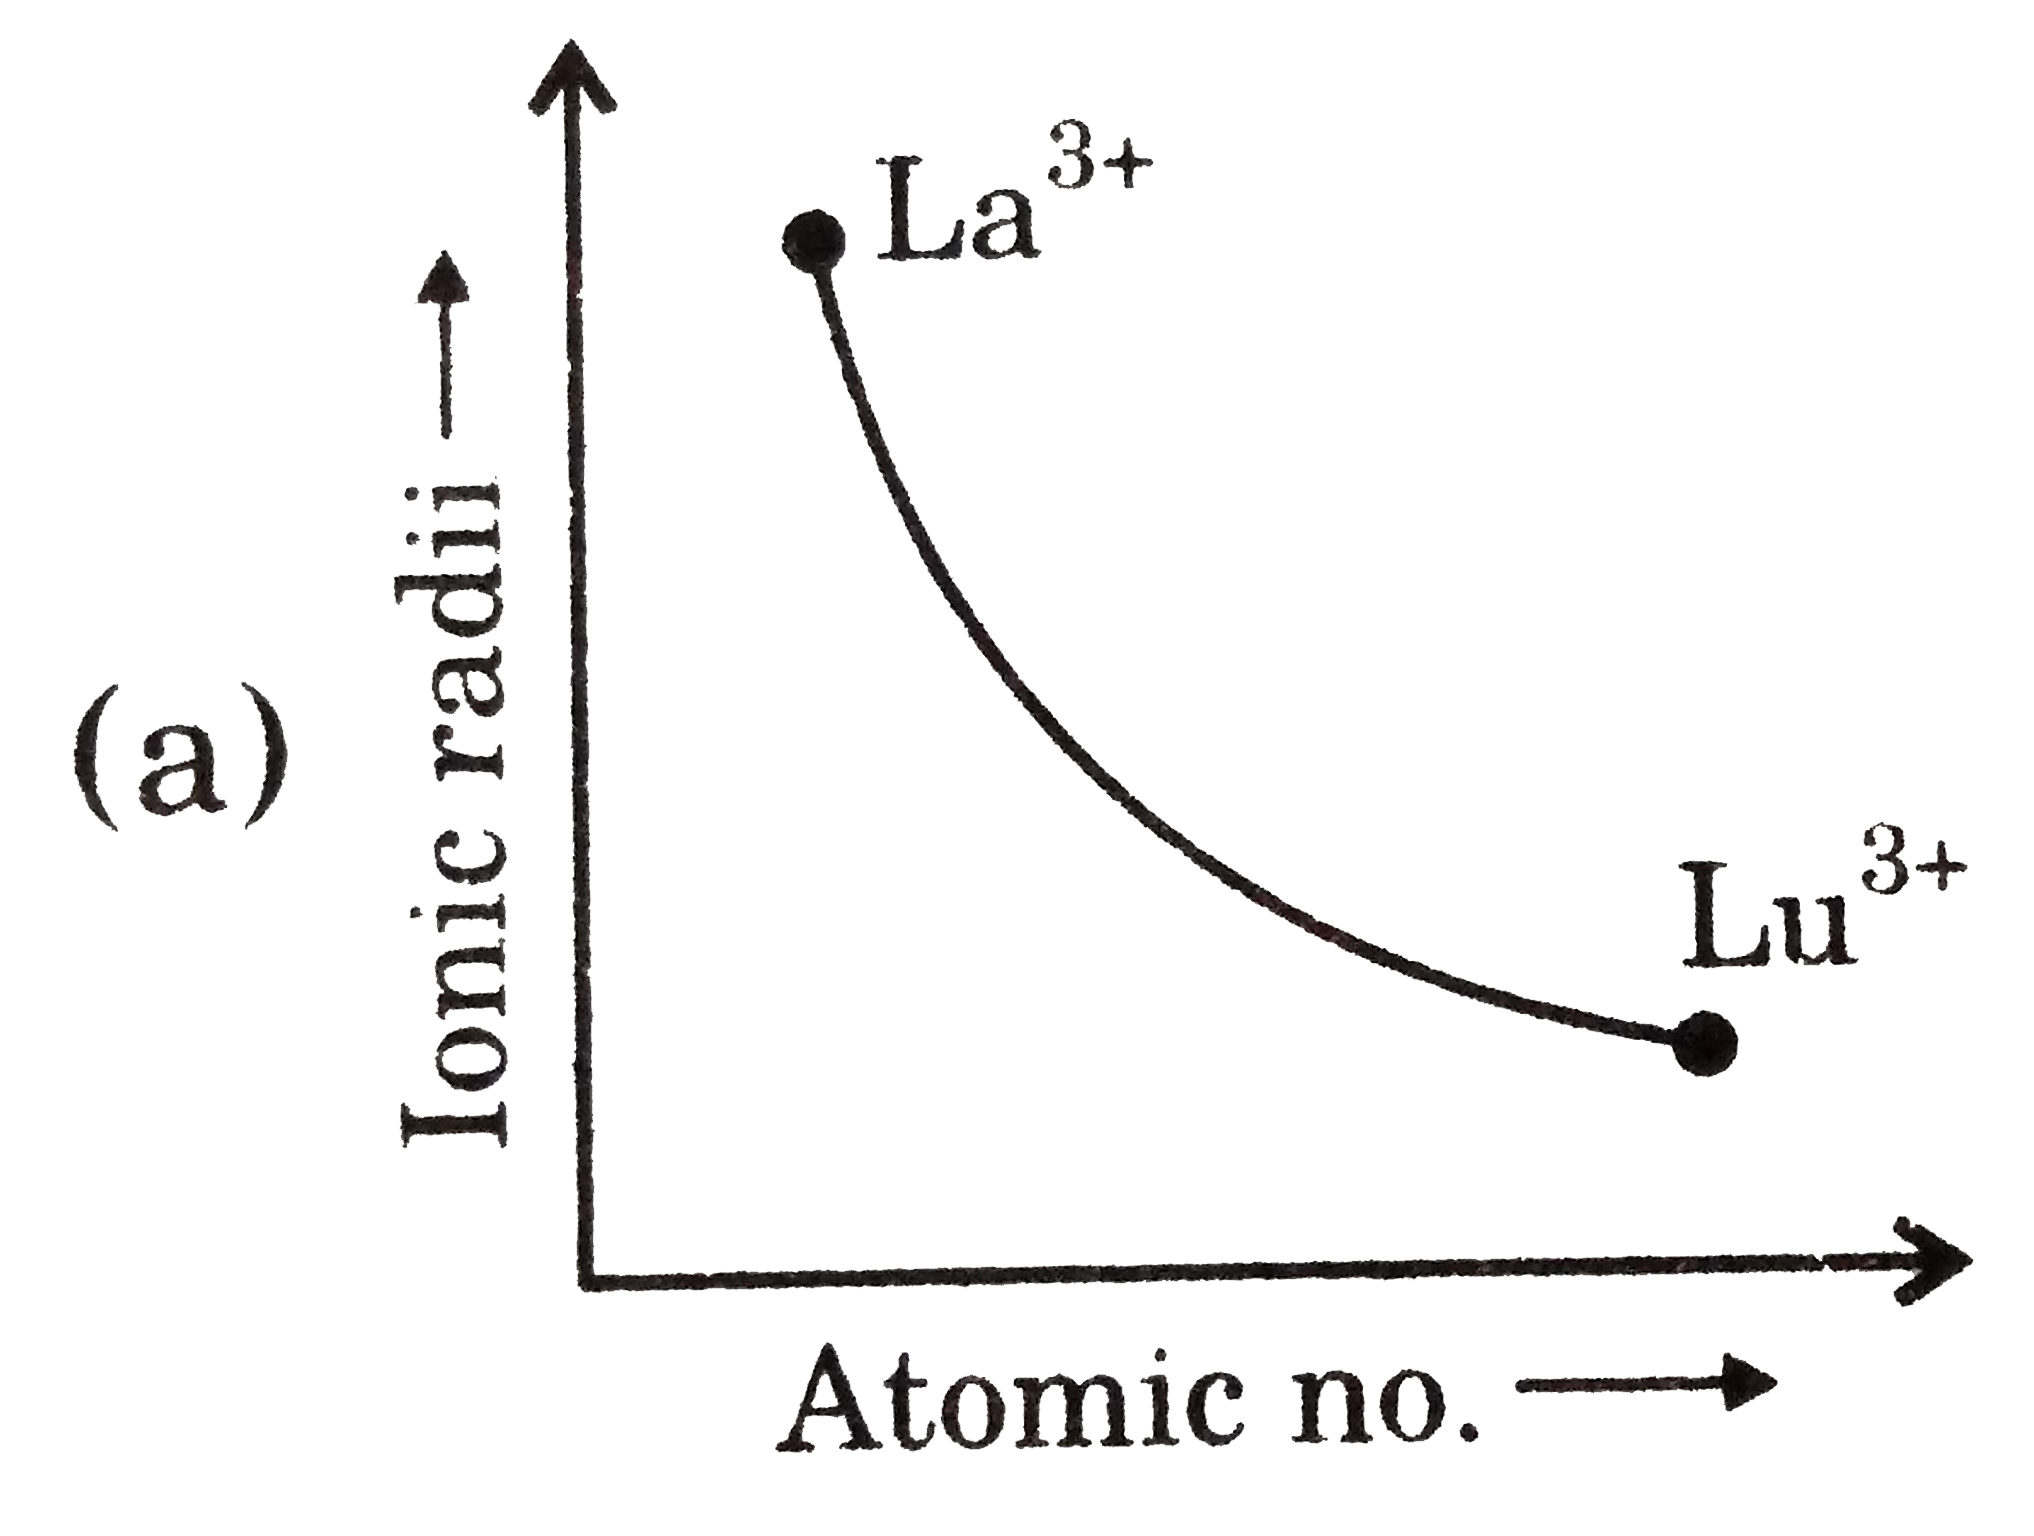 B
B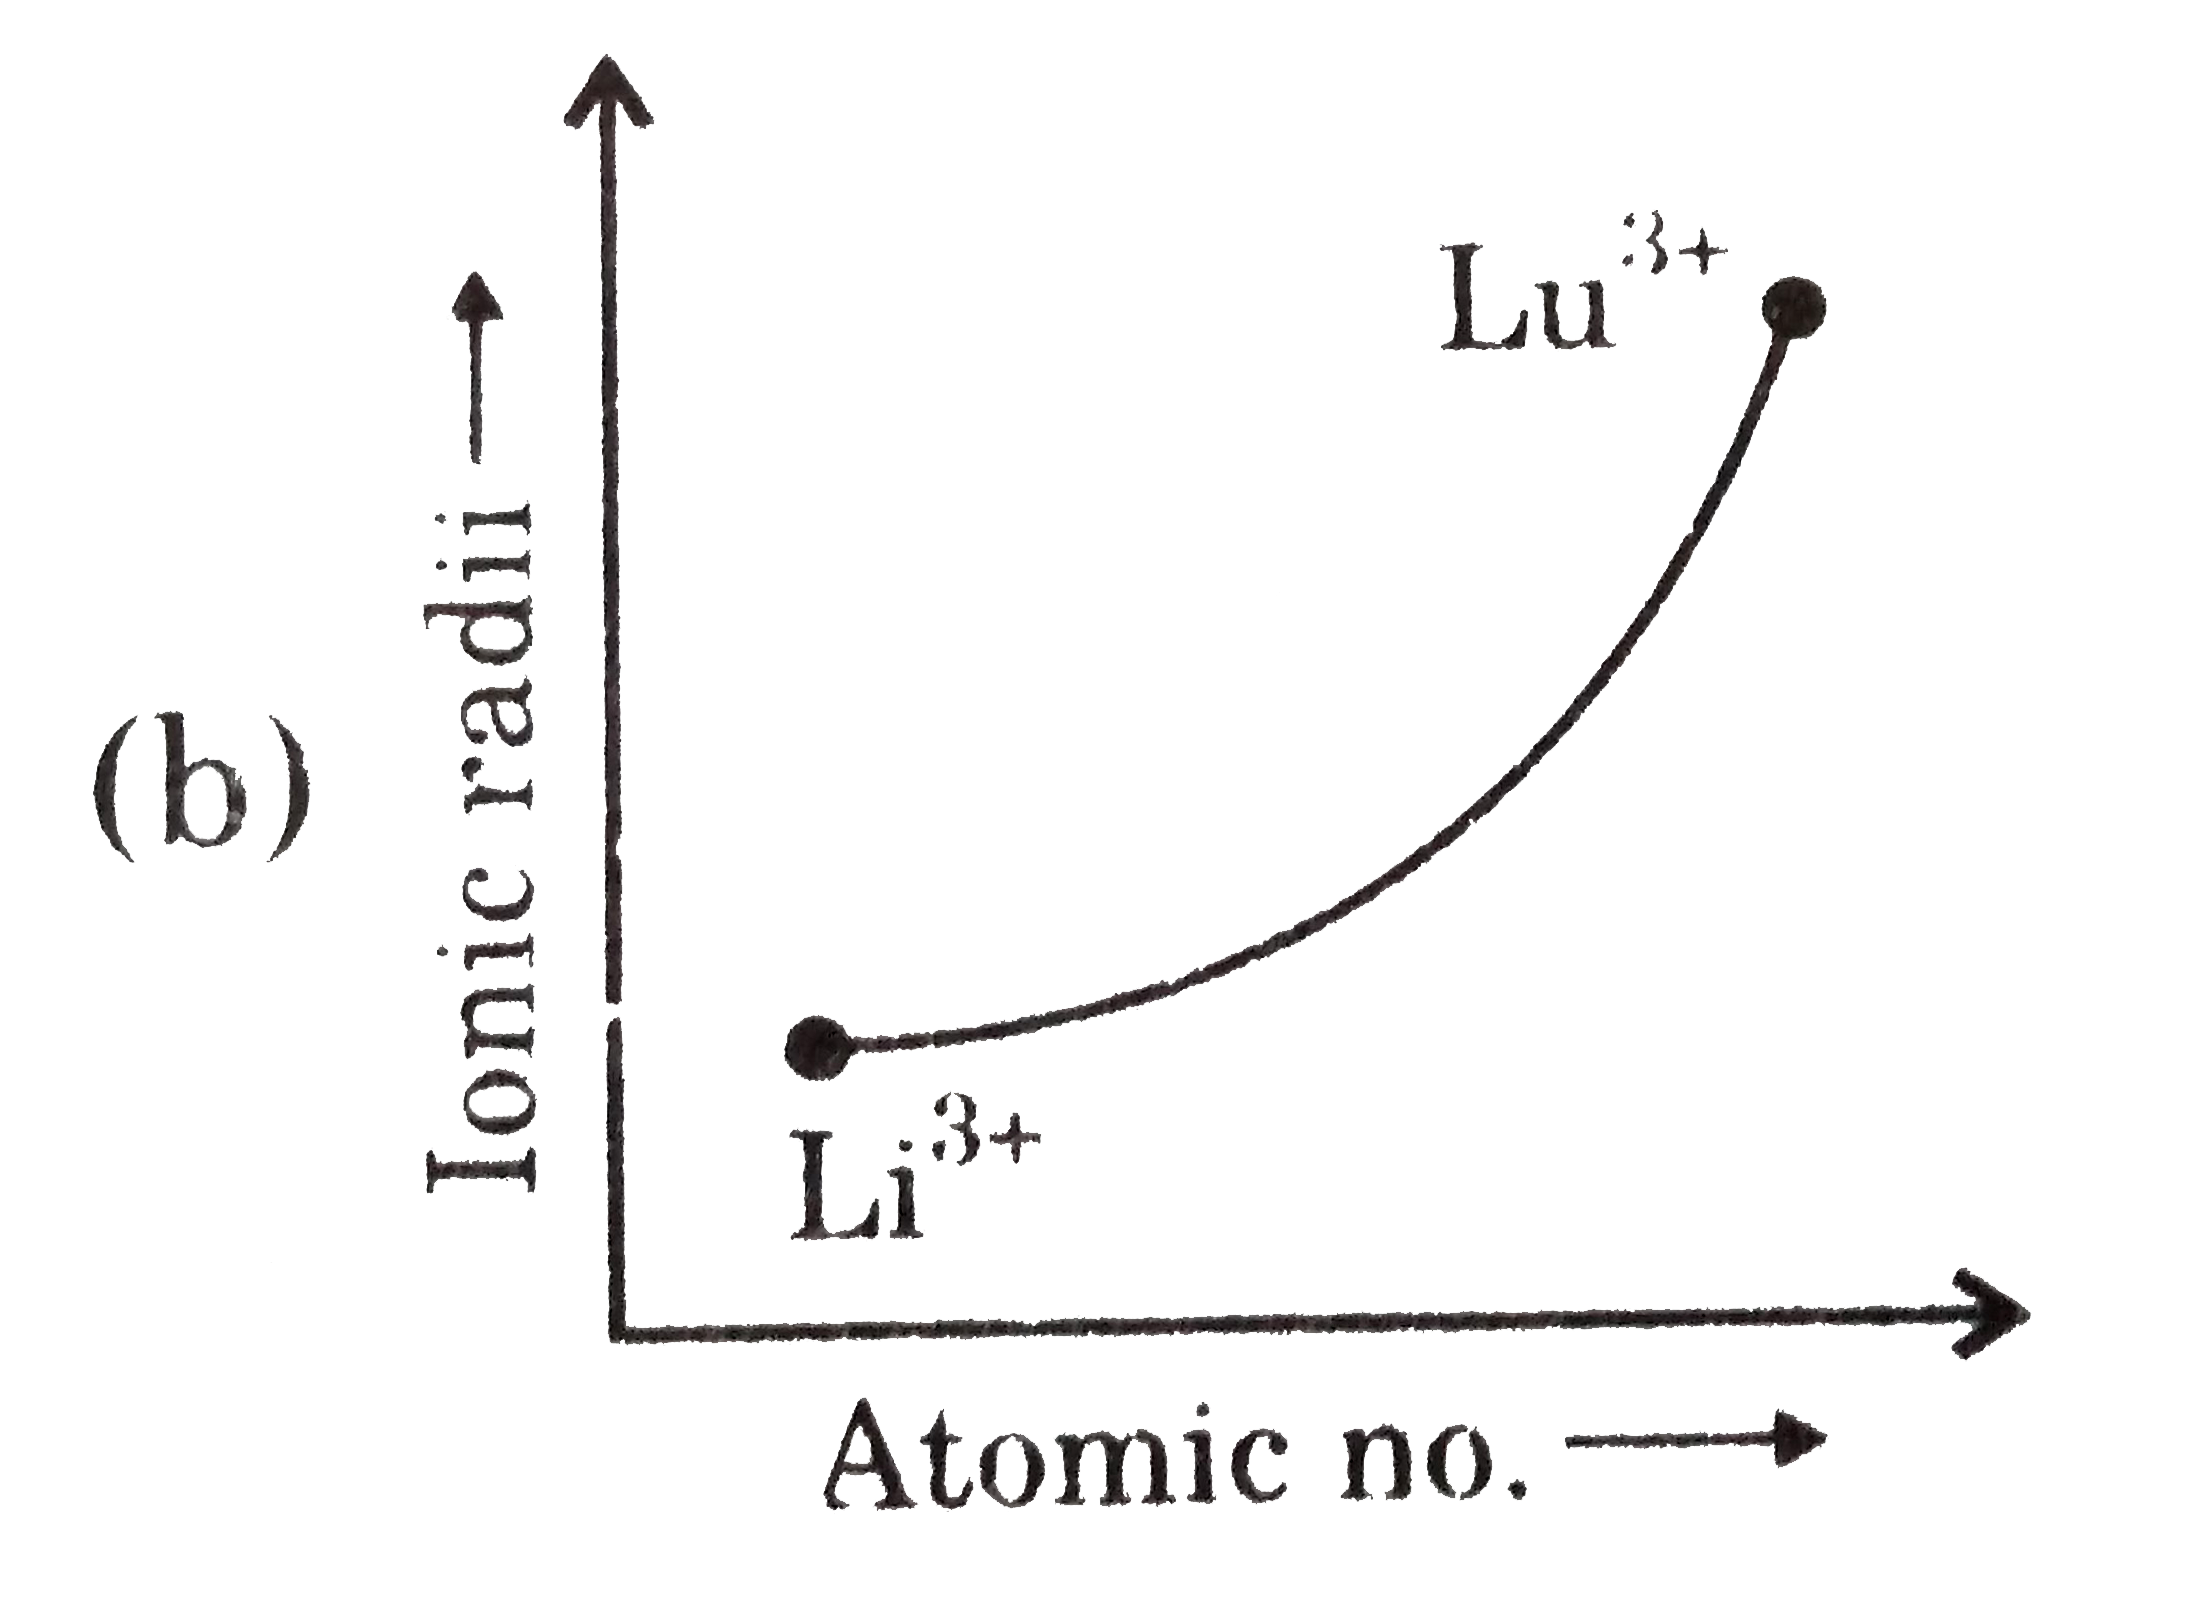 C
C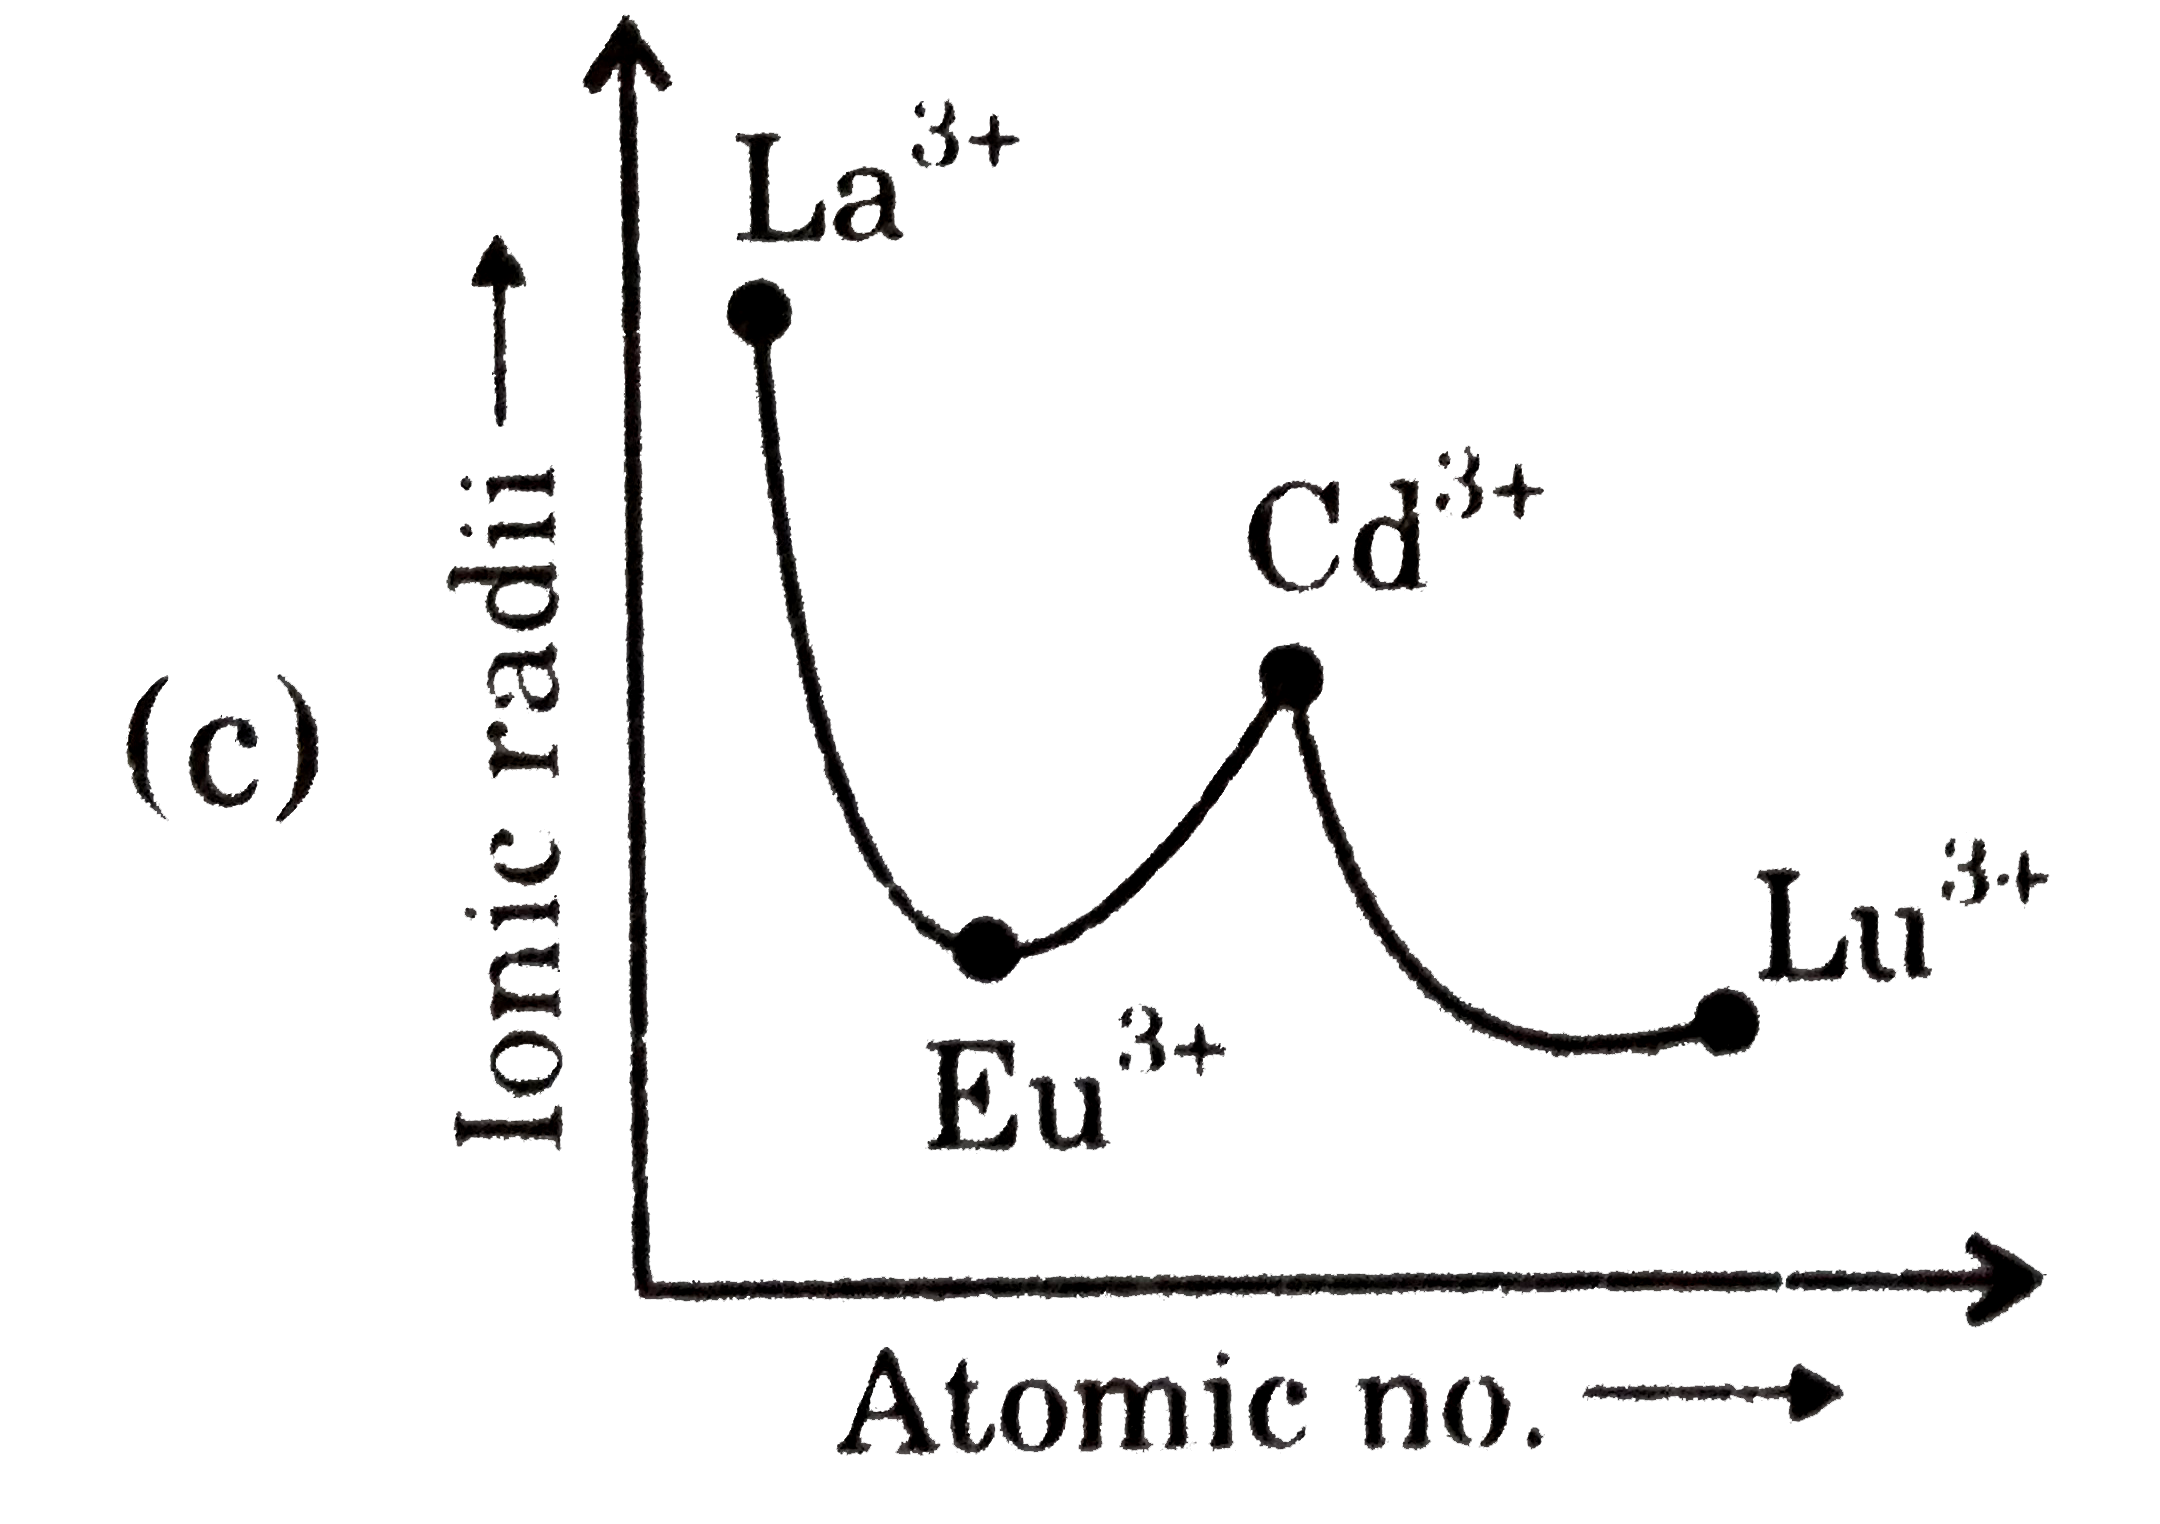 D
D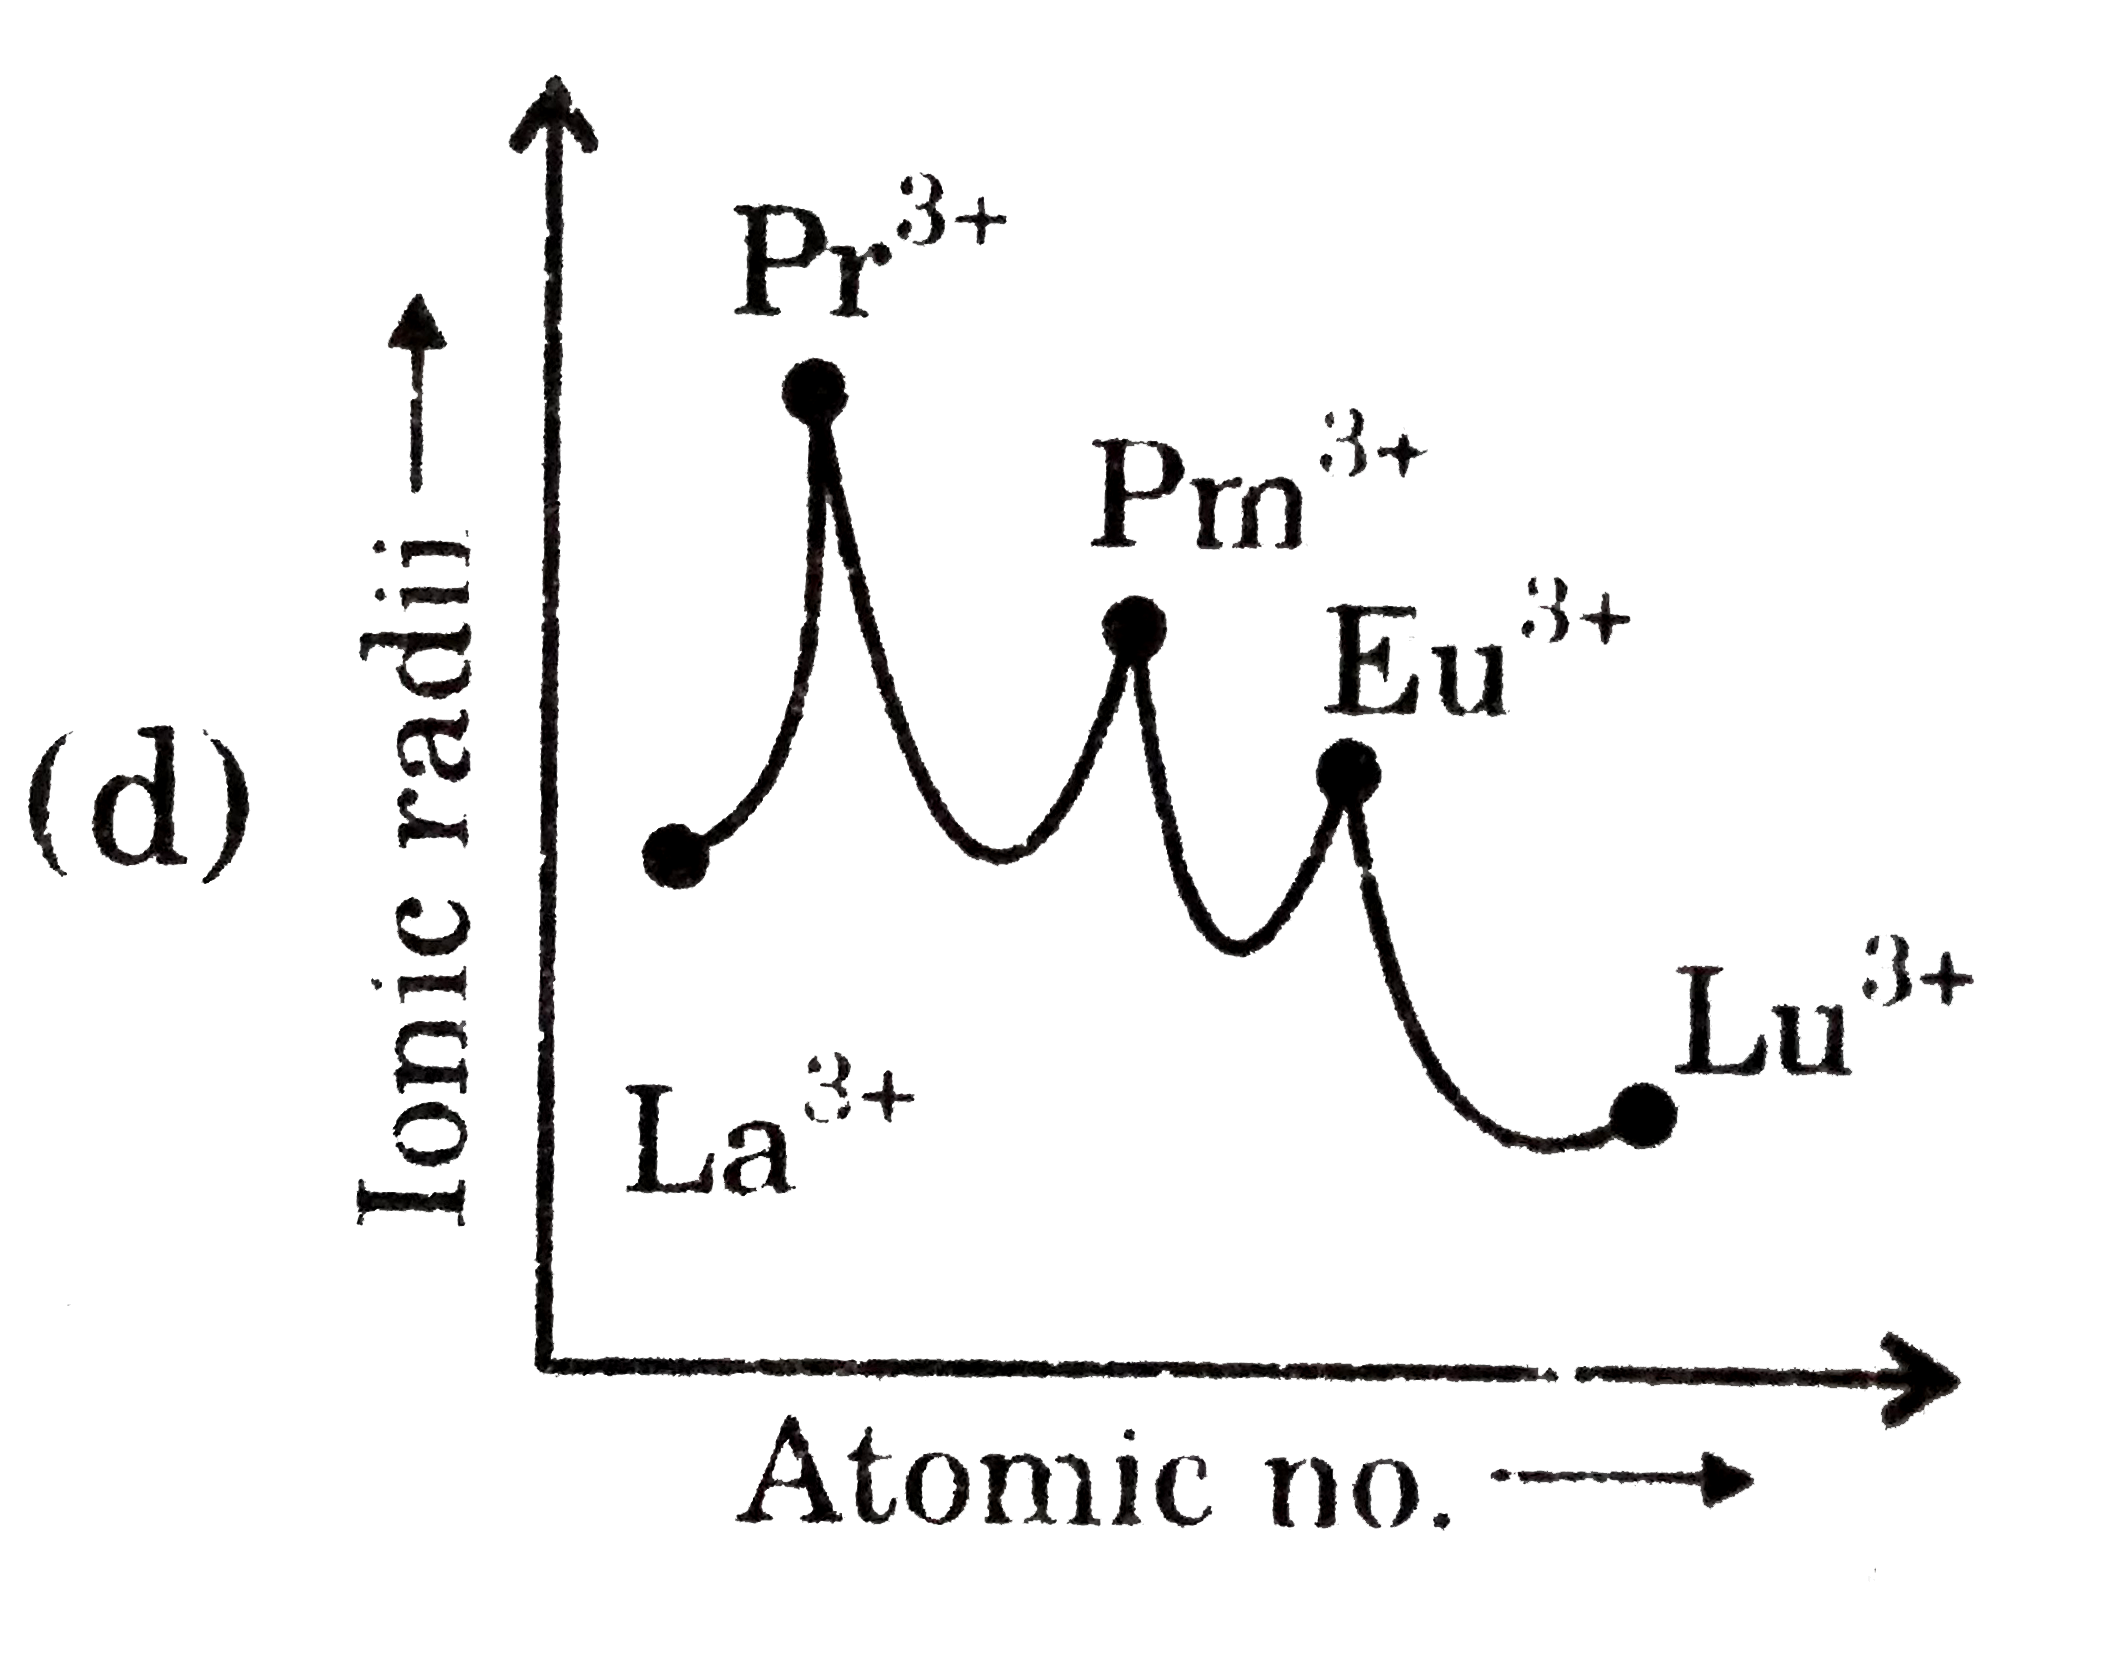
Which among the following is the graphical representation of a reaction is the ΔH for the forward reaction is twice the activation energy of the I step and activation energy of the II step is half of the I step
A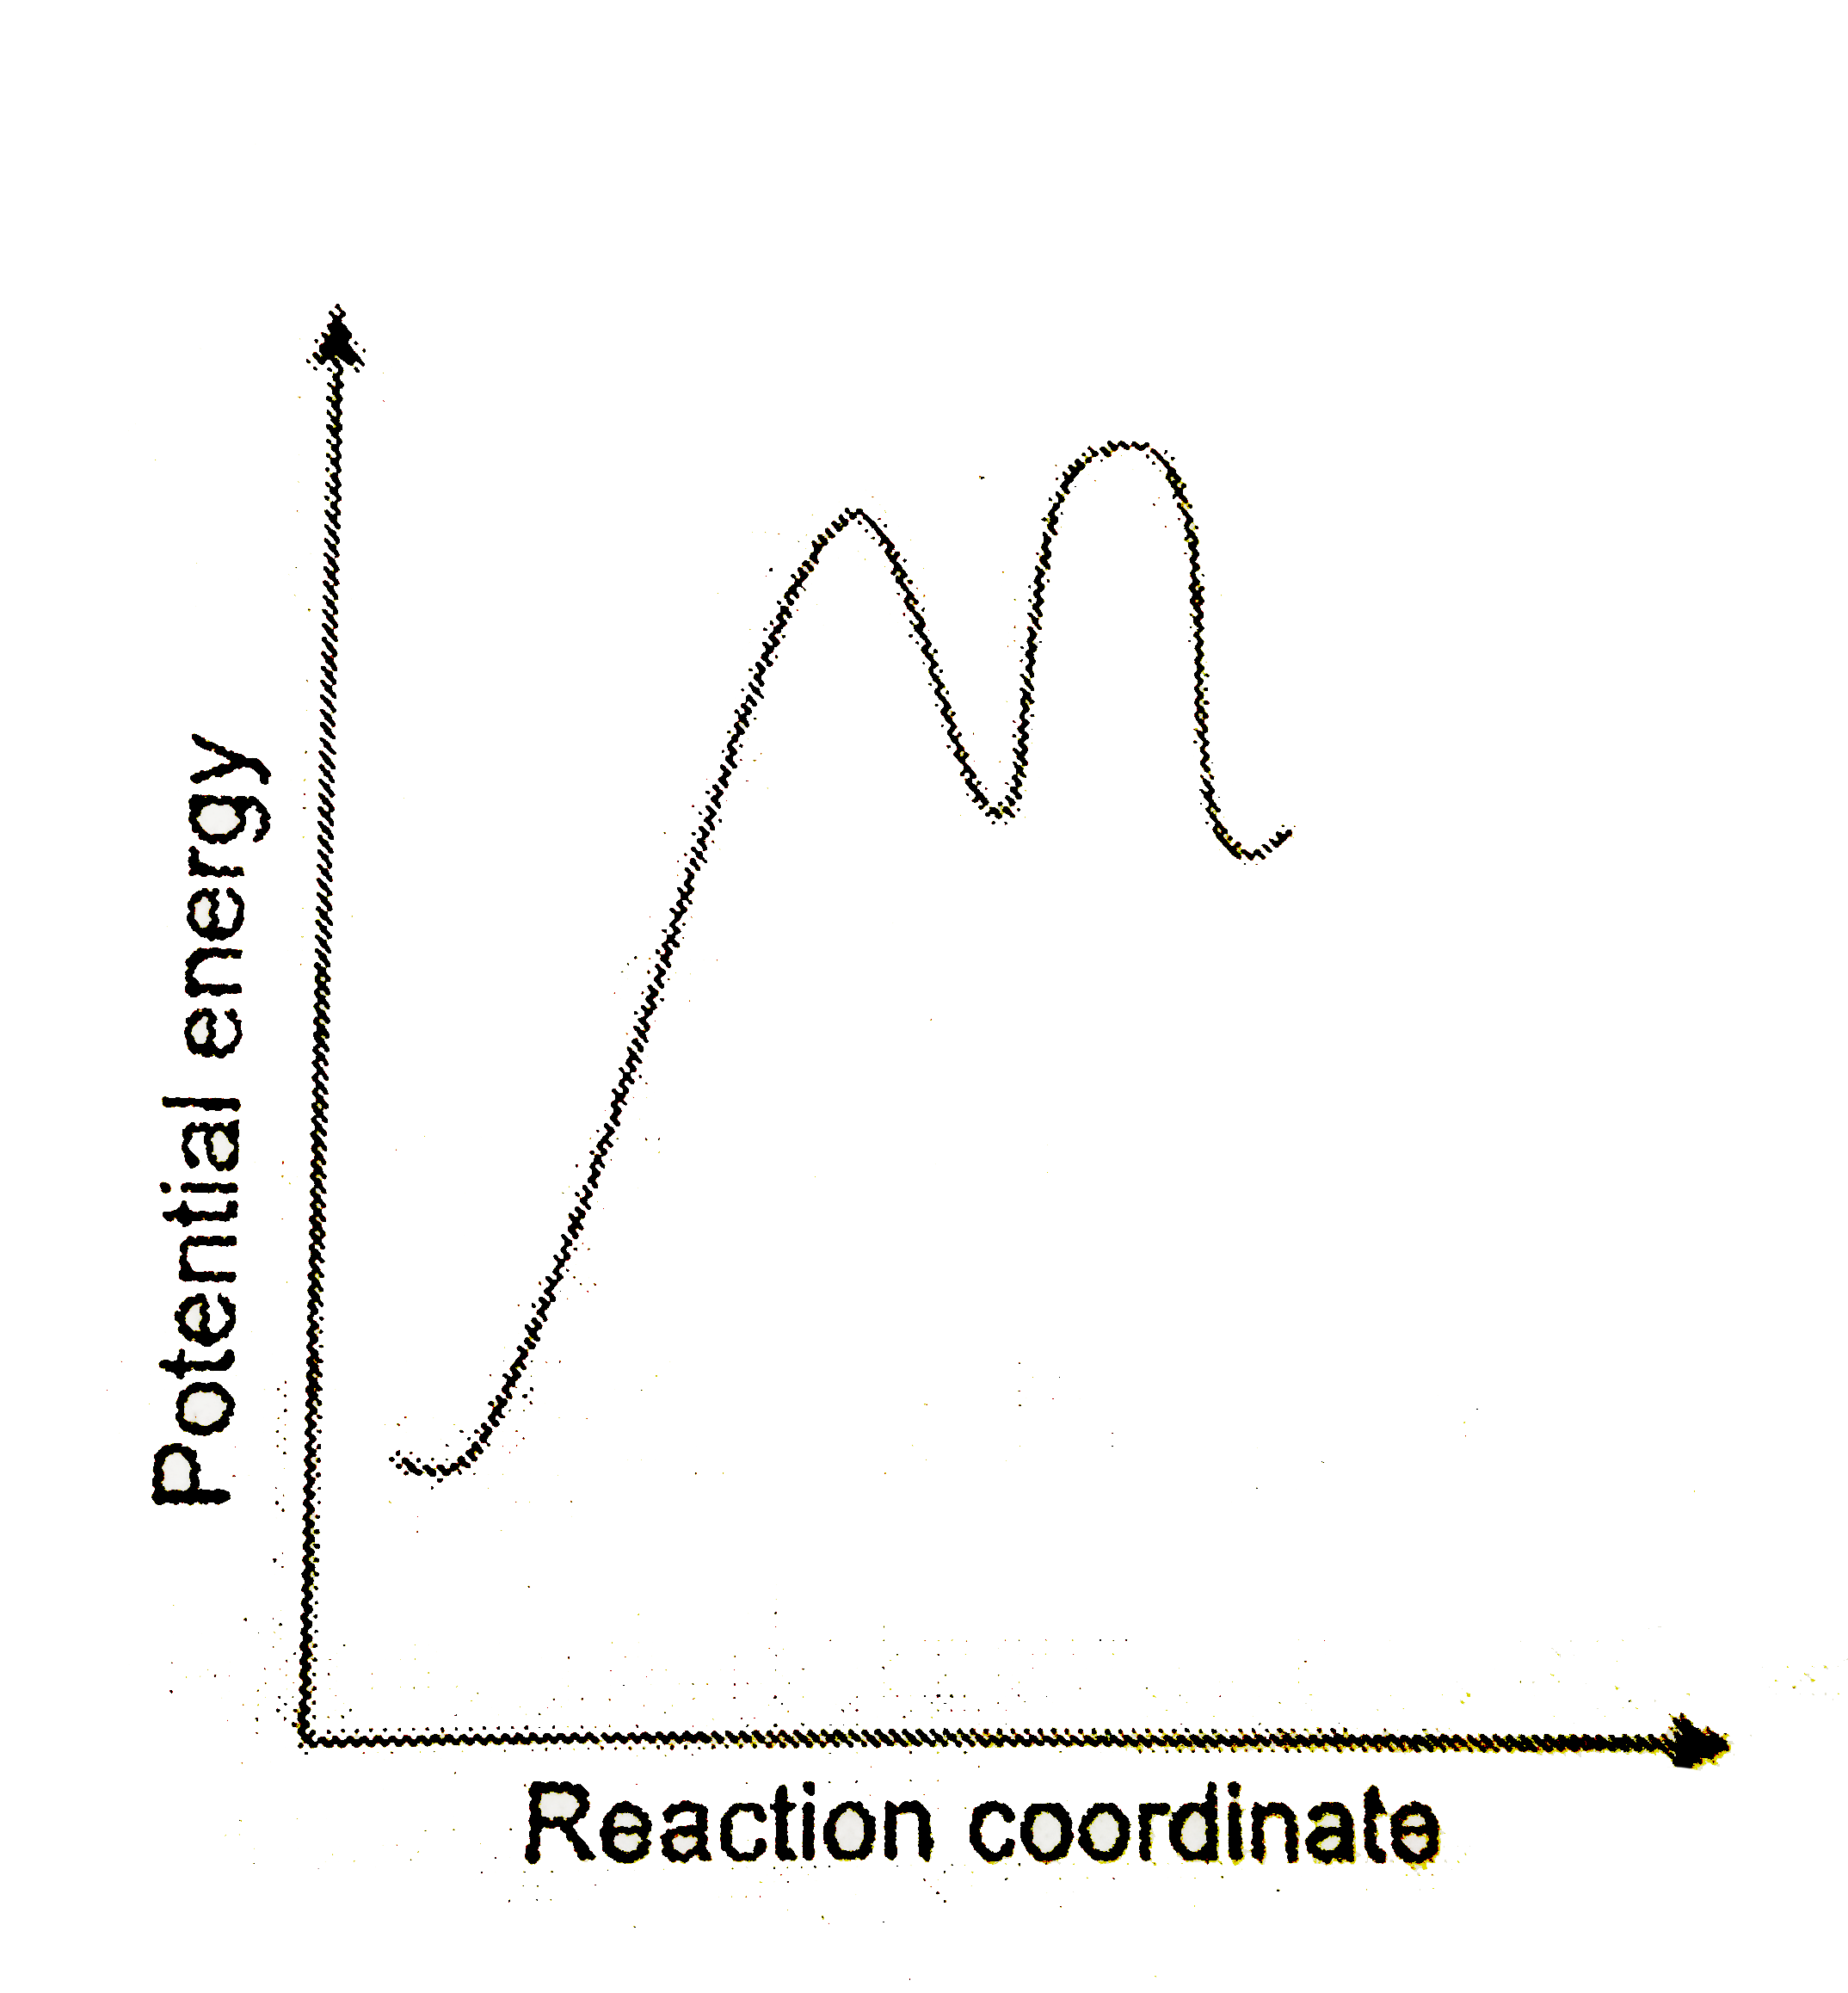 B
B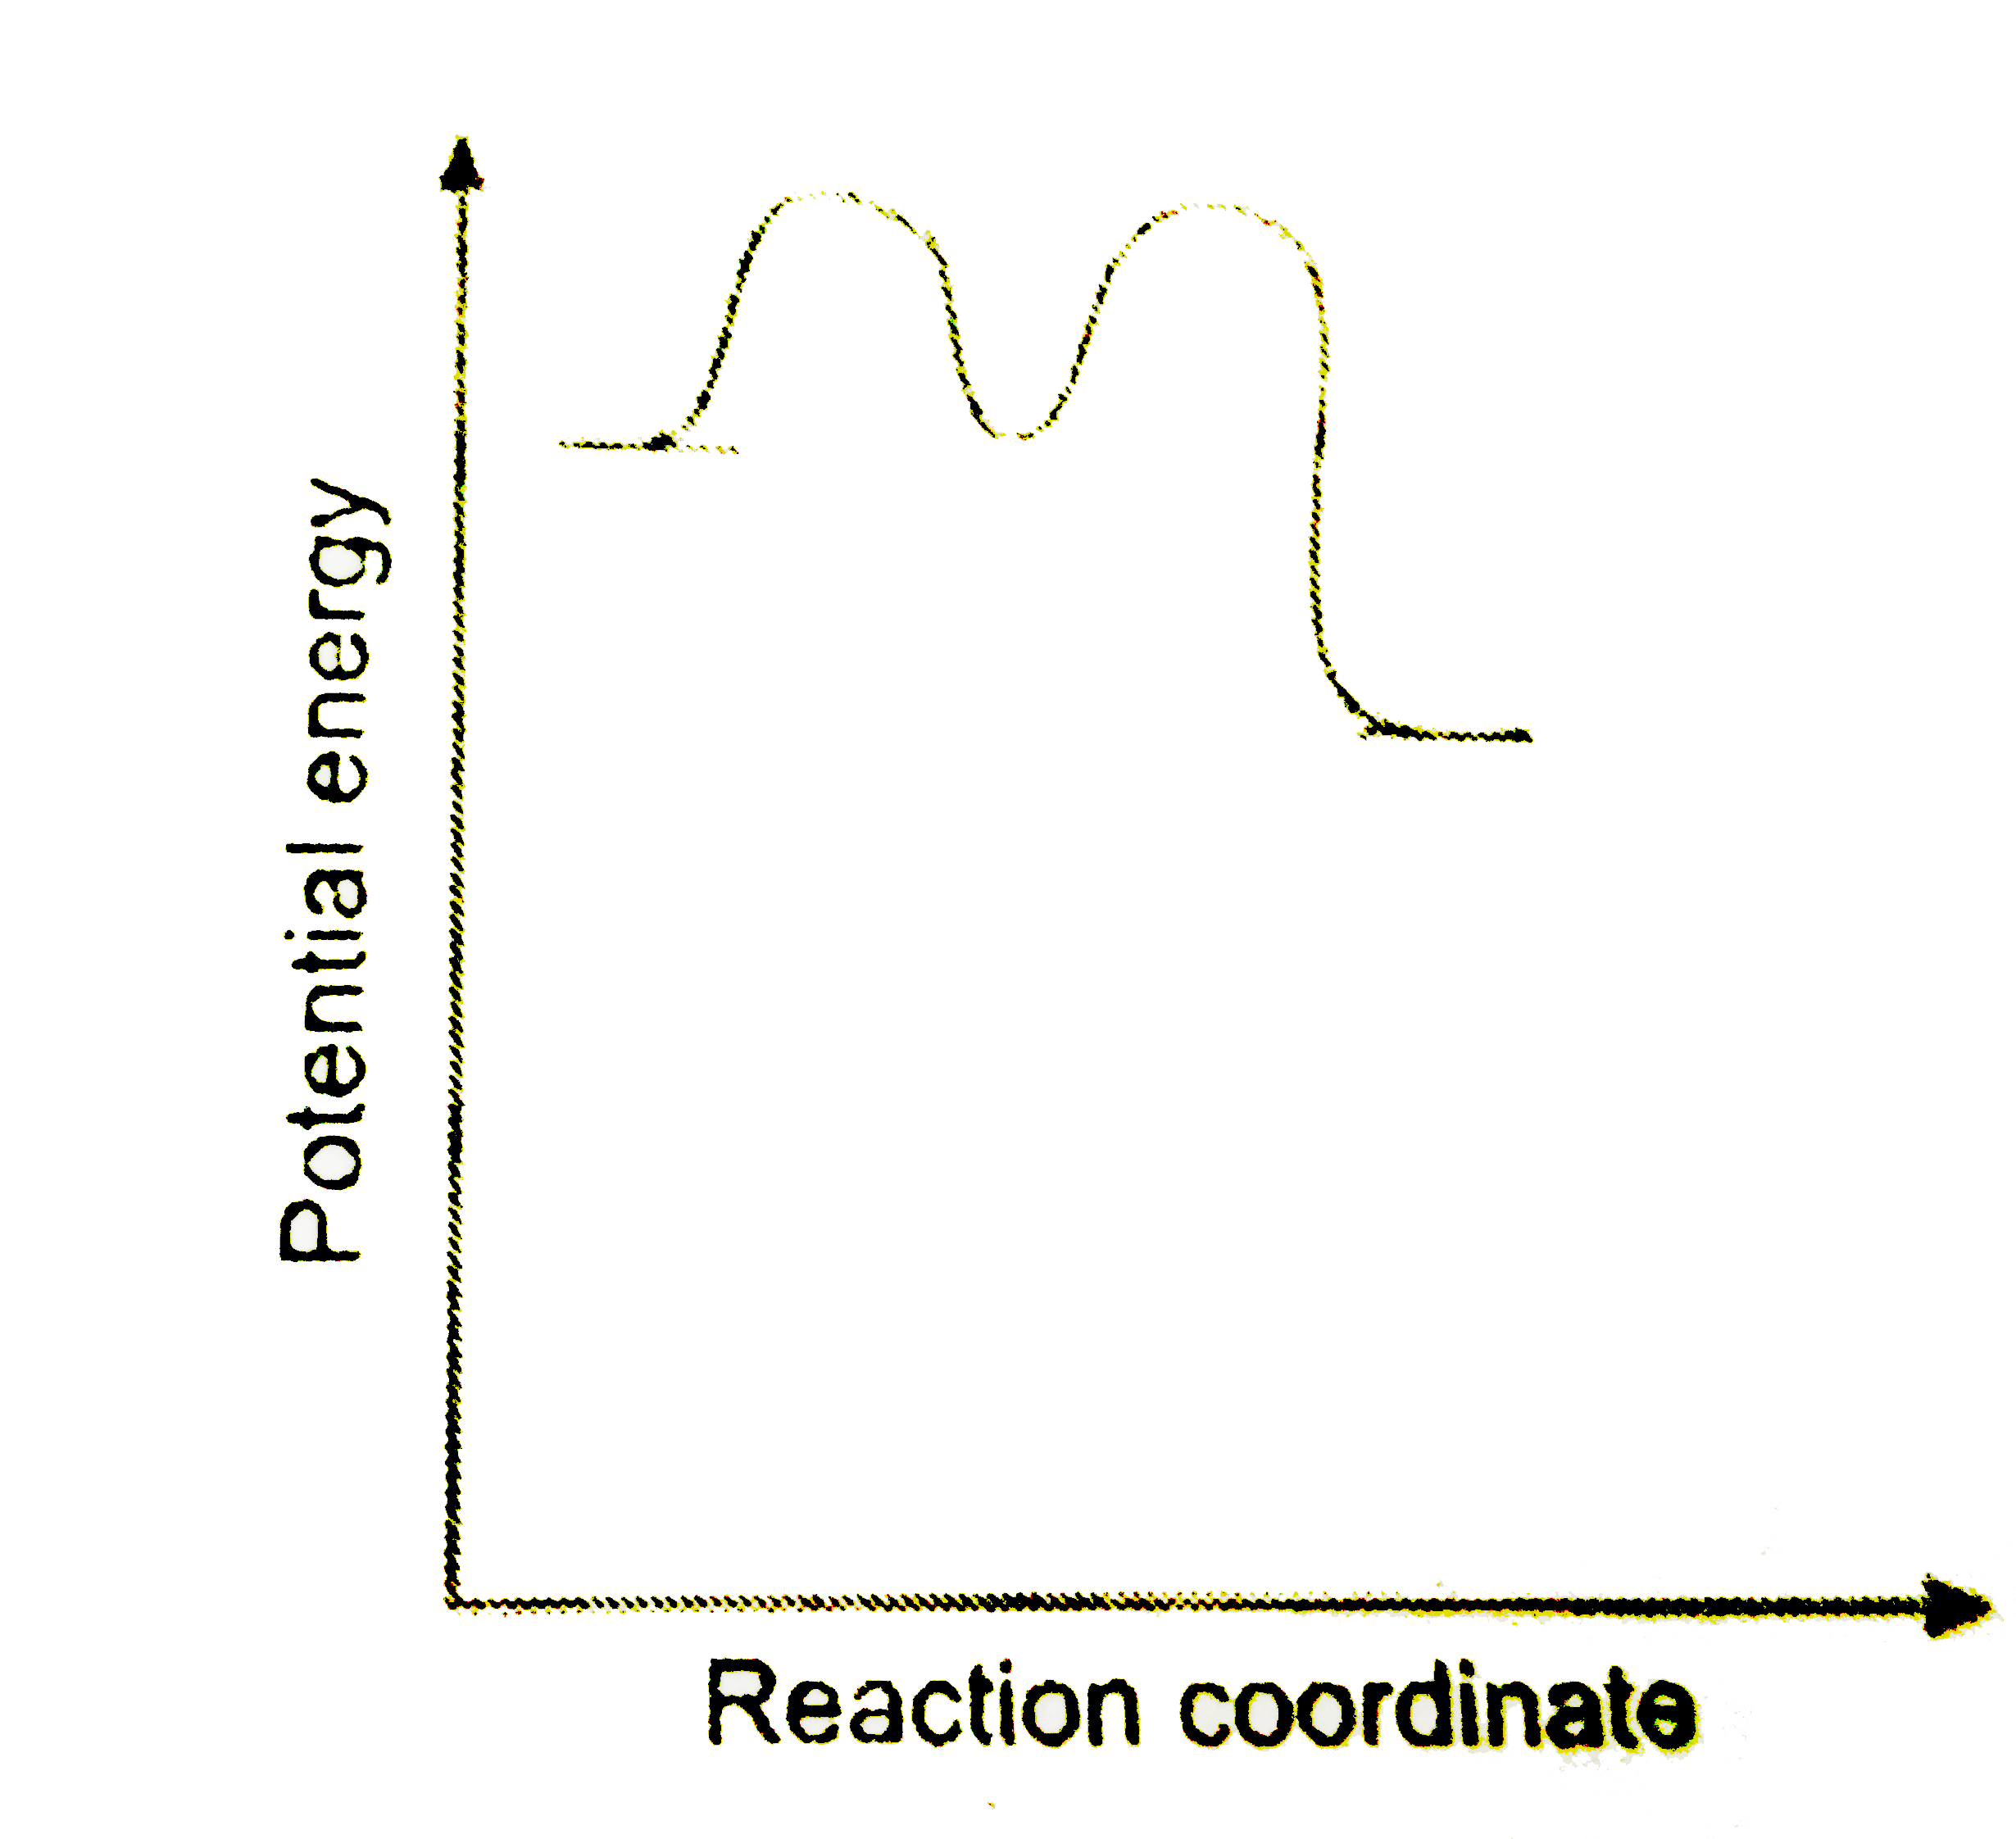 C
C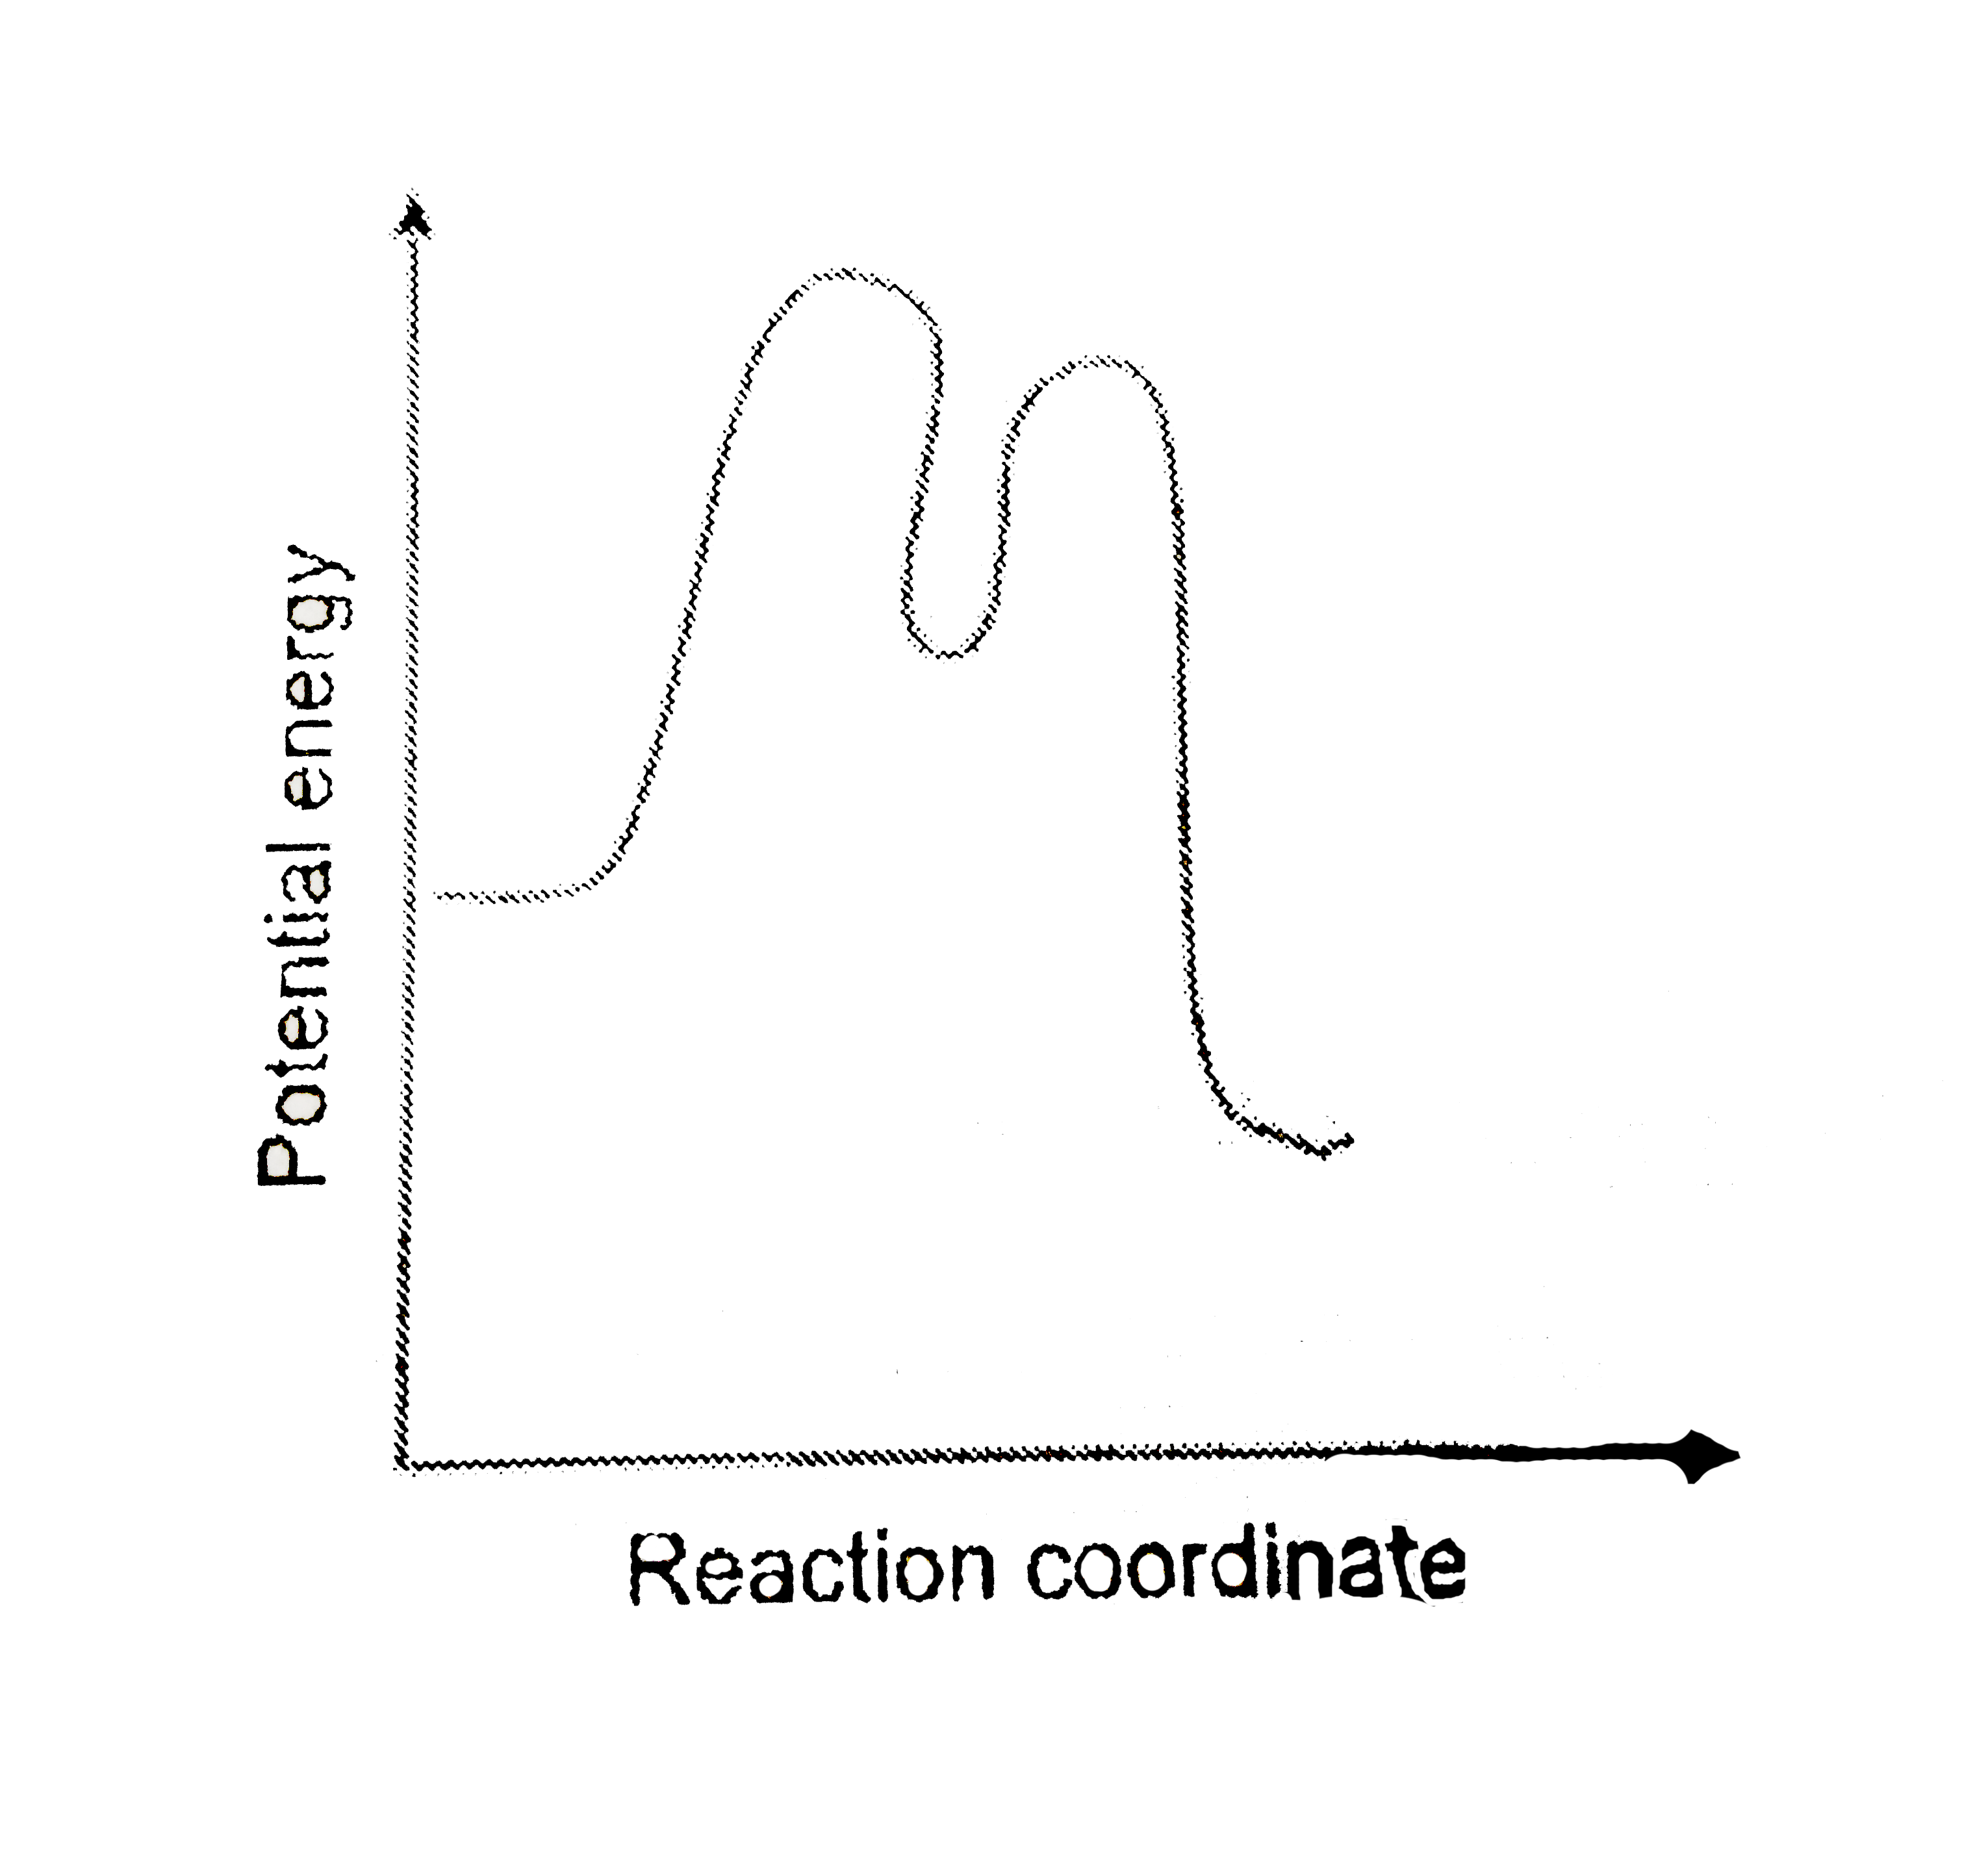 D
D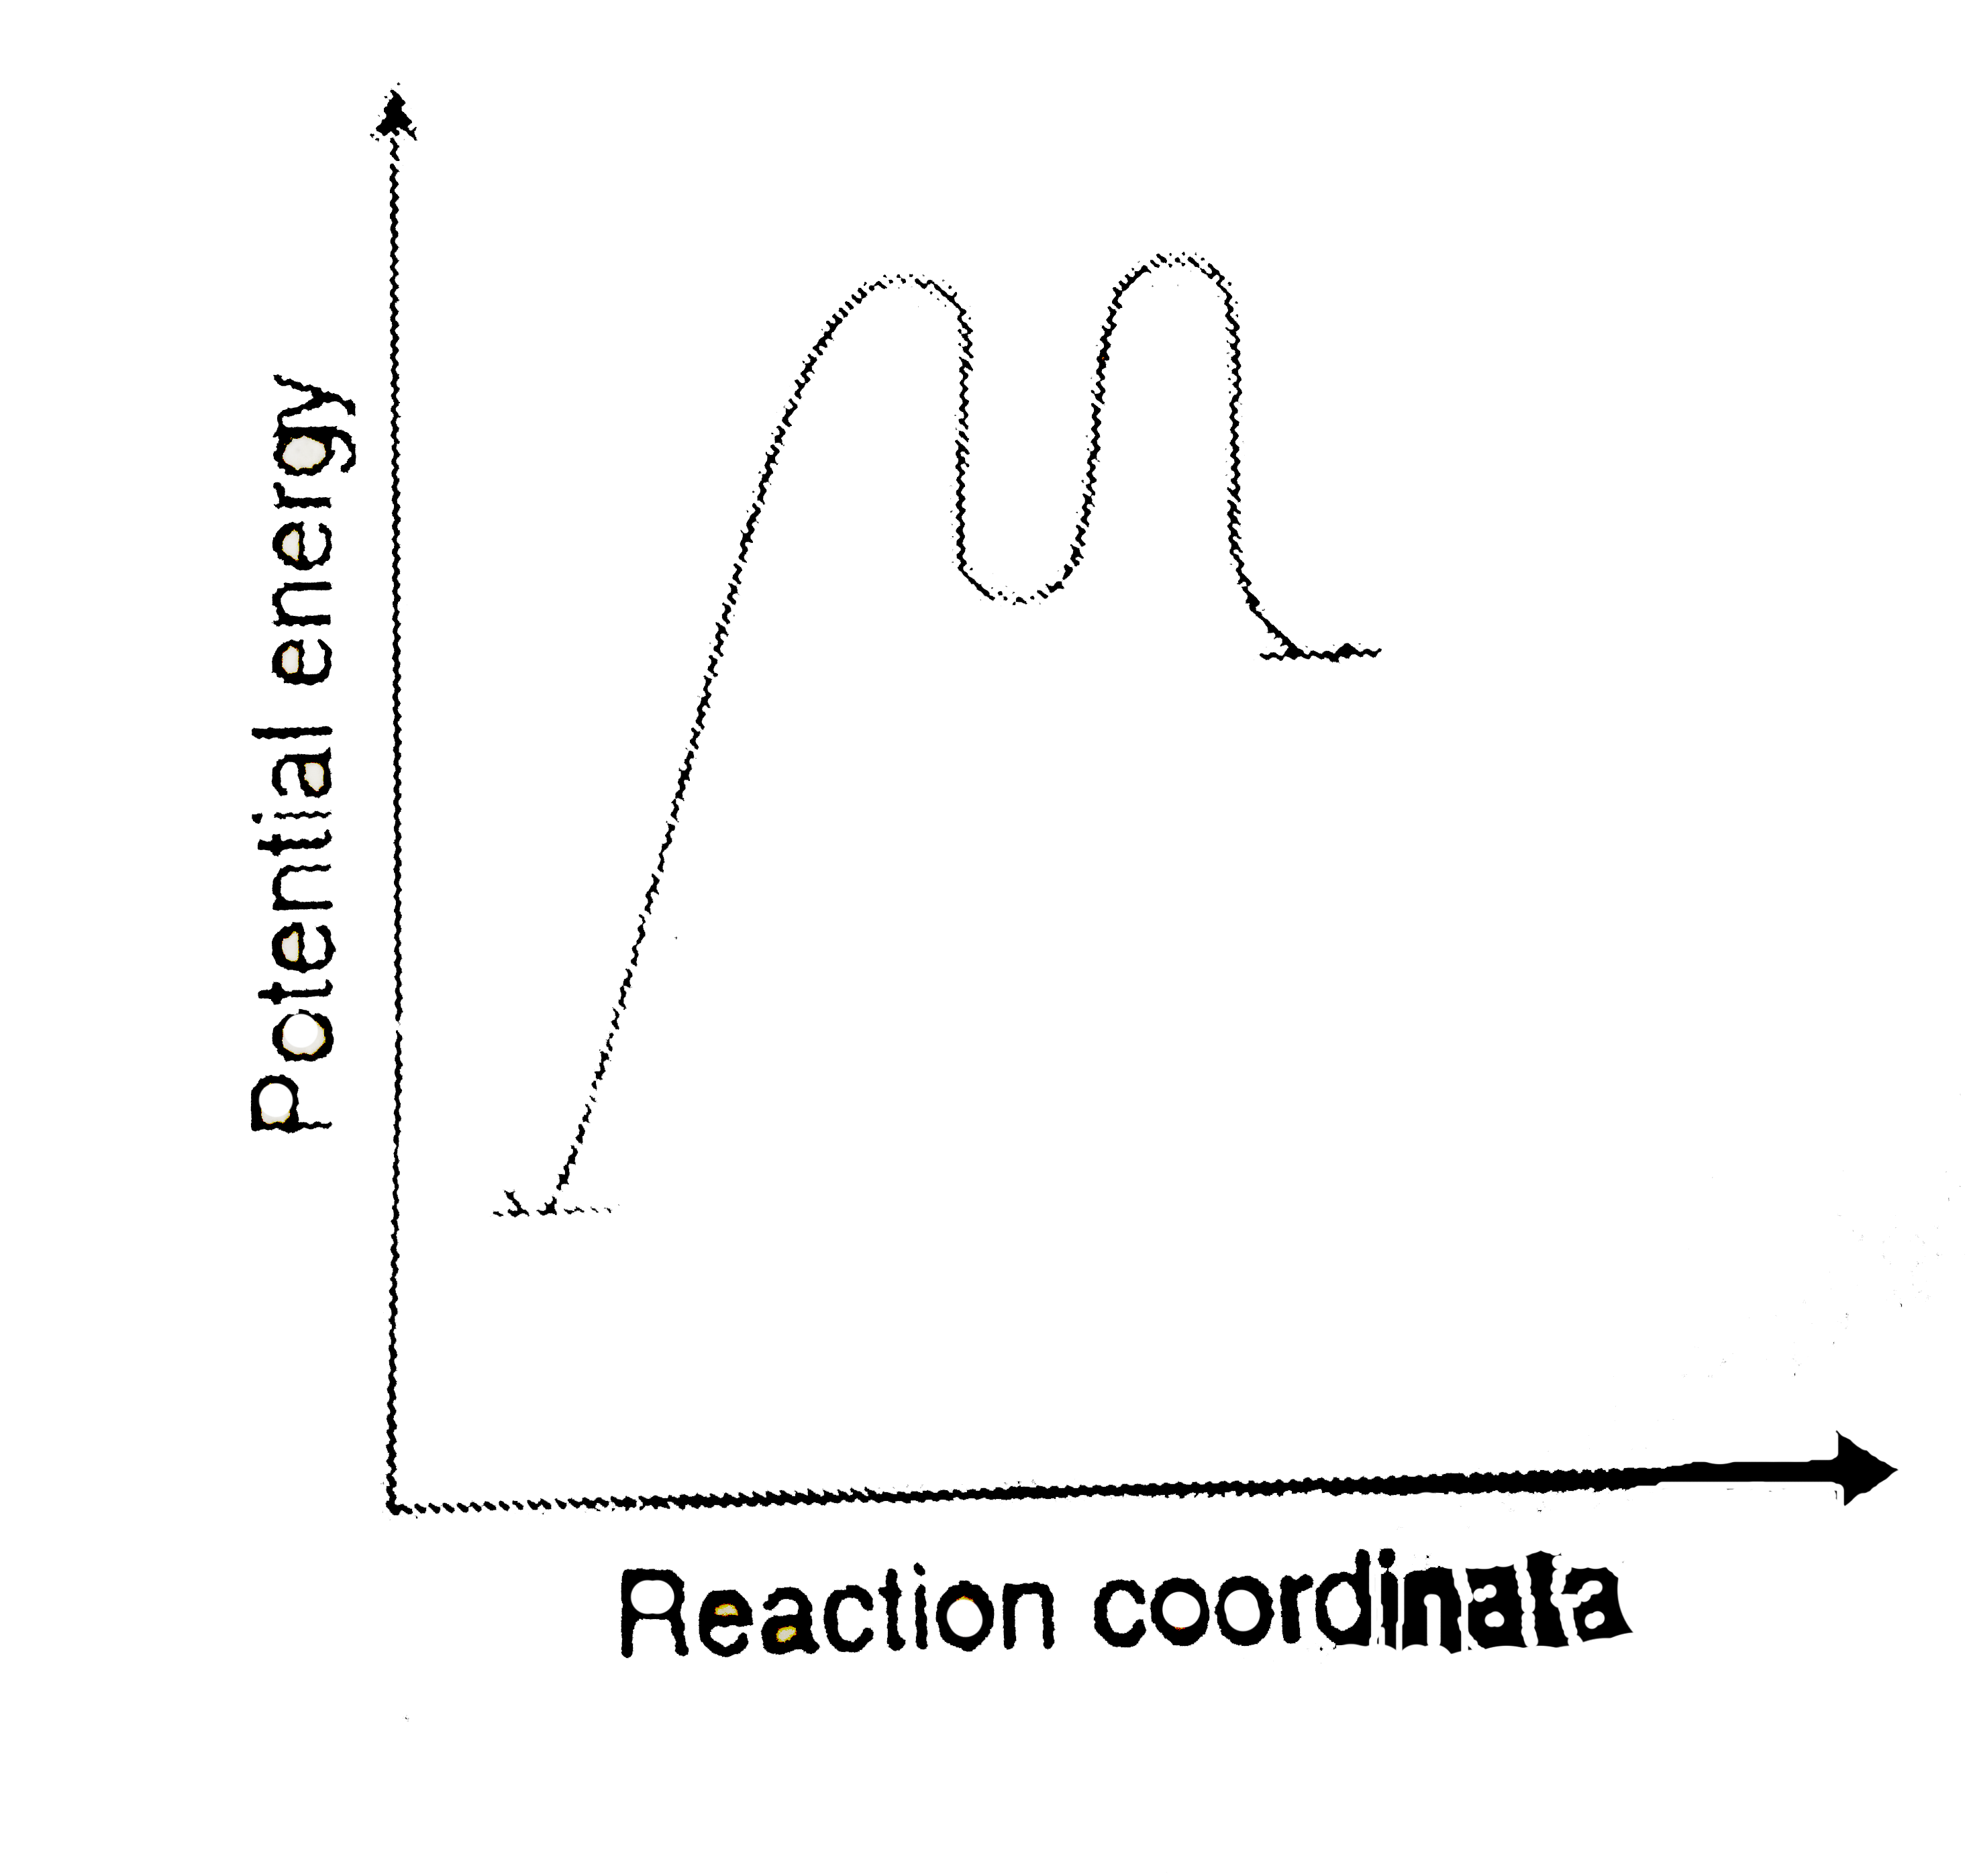
Which is a graphical representation of an application ?
AWindows 95BWindows ExplorerCTaskbarDNone of these


