Consider the first order reaction: A→2B. Which of the following figure correctly describes the rate of disappearance of A(r1) and rate of appearance of B(r2) with time ?
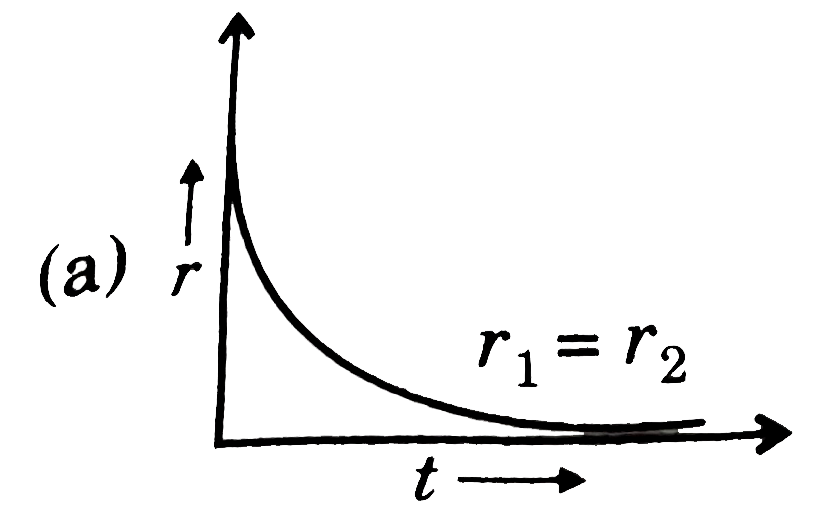
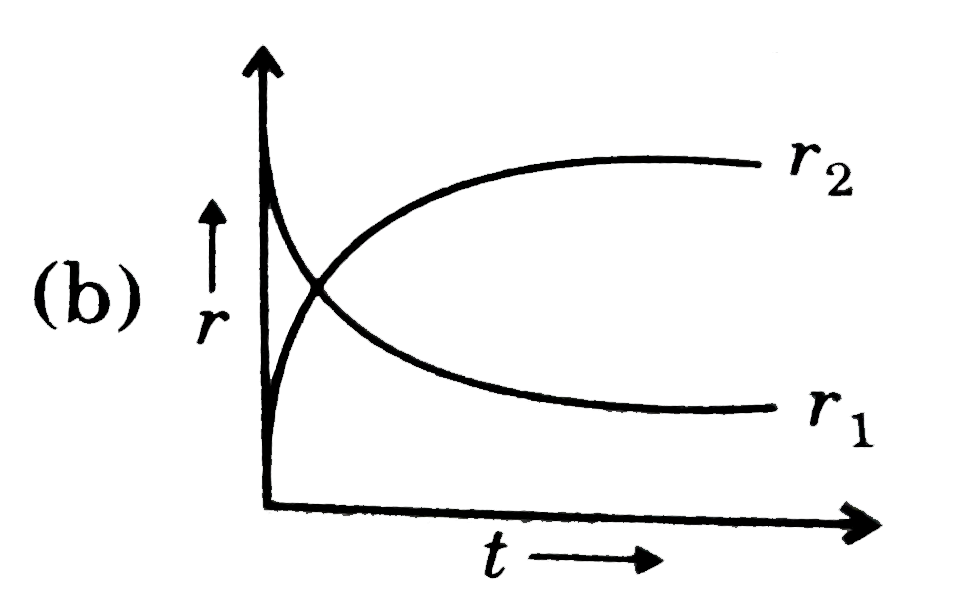
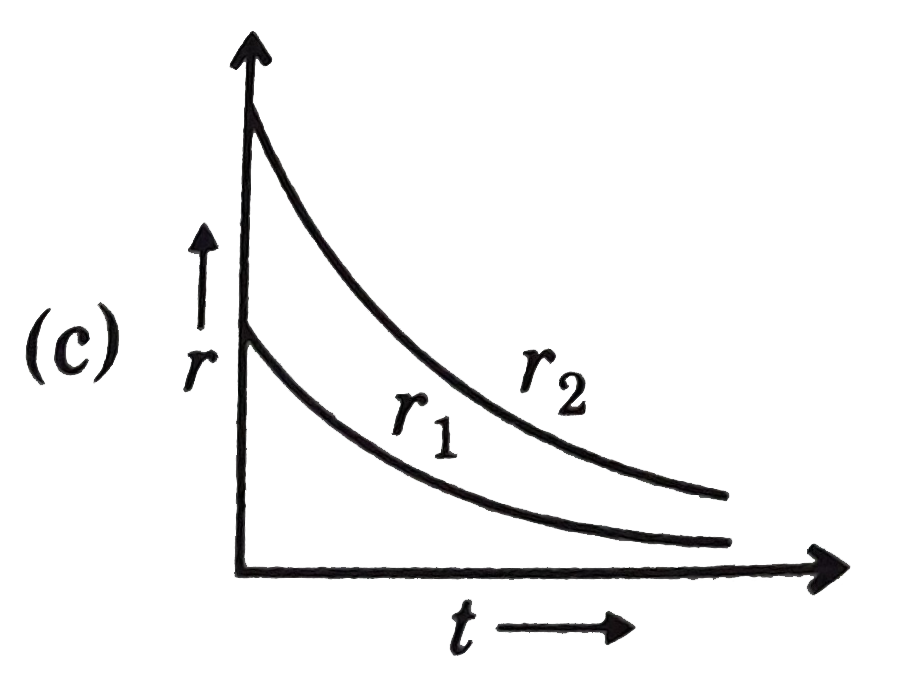
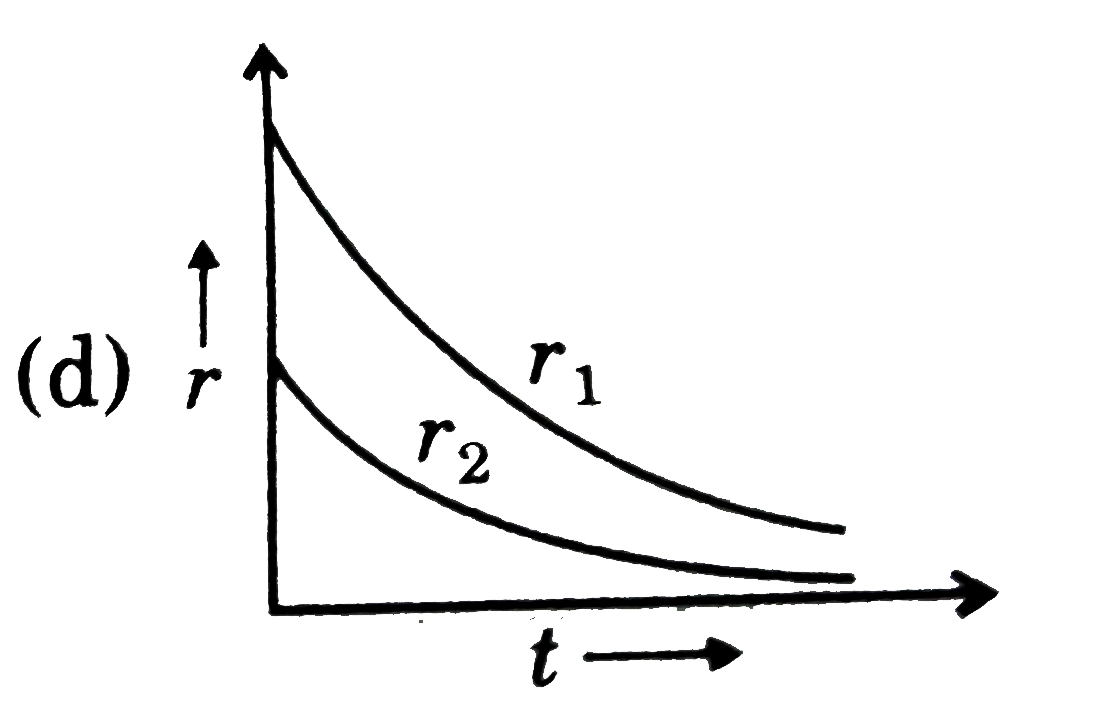
The correct Answer is:C
To solve the problem regarding the first-order reaction A→2B, we need to analyze the rates of disappearance of A and the appearance of B over time. Here’s a step-by-step breakdown of the solution:
Step 1: Understand the Reaction
The reaction given is a first-order reaction where one mole of A produces two moles of B. The stoichiometry indicates that for every mole of A that disappears, two moles of B appear.
Step 2: Define the Rates
- The rate of disappearance of A can be expressed as:
R1=−d(A)dt
- The rate of appearance of B can be expressed as:
R2=d(B)dt
From the stoichiometry of the reaction, we can relate these rates:
R1=−12R2
This means that the rate at which A disappears is half the rate at which B appears.
Step 3: Express Concentrations Over Time
For a first-order reaction, the concentration of A at time t is given by:
(A)=(A)0e−kt
Where (A)0 is the initial concentration of A and k is the rate constant.
Step 4: Calculate the Rate Expressions
Using the expression for (A):
- The rate of disappearance of A becomes:
R1=k(A)=k(A)0e−kt
- The rate of appearance of B becomes:
R2=−d(A)dt=k(A)0e−kt
However, since R2 is related to the stoichiometry, we have:
R2=−d(A)dt=2k(A)0e−kt
Step 5: Analyze the Graphs
- The graph of R1 (rate of disappearance of A) will show an exponential decay since it is proportional to e−kt.
- The graph of R2 (rate of appearance of B) will also show an exponential decay, but it will be steeper because it is multiplied by 2.
Step 6: Conclusion
The correct graph will show:
- R1 decreasing gently over time.
- R2 decreasing more steeply over time, reflecting that B is produced at a rate that is double that of the disappearance of A.
Final Answer
The figure that correctly describes the rates of disappearance of A and appearance of B with time is the one where R1 decreases gently and R2 decreases more steeply.
---
The reaction given is a first-order reaction where one mole of A produces two moles of B. The stoichiometry indicates that for every mole of A that disappears, two moles of B appear.
- The rate of disappearance of A can be expressed as:
R1=−d(A)dt
- The rate of appearance of B can be expressed as:
R2=d(B)dt
R1=−12R2
This means that the rate at which A disappears is half the rate at which B appears.
For a first-order reaction, the concentration of A at time t is given by:
(A)=(A)0e−kt
Where (A)0 is the initial concentration of A and k is the rate constant.
Using the expression for (A):
- The rate of disappearance of A becomes:
R1=k(A)=k(A)0e−kt
- The rate of appearance of B becomes:
R2=−d(A)dt=k(A)0e−kt
However, since R2 is related to the stoichiometry, we have:
R2=−d(A)dt=2k(A)0e−kt
- The graph of R1 (rate of disappearance of A) will show an exponential decay since it is proportional to e−kt.
- The graph of R2 (rate of appearance of B) will also show an exponential decay, but it will be steeper because it is multiplied by 2.
The correct graph will show:
- R1 decreasing gently over time.
- R2 decreasing more steeply over time, reflecting that B is produced at a rate that is double that of the disappearance of A.
The figure that correctly describes the rates of disappearance of A and appearance of B with time is the one where R1 decreases gently and R2 decreases more steeply.
Topper's Solved these Questions
- GRAPHICAL INTERPRETATIONBook:GRB PUBLICATIONChapter:GRAPHICAL INTERPRETATIONExercise:I.Electrochemistry
Explore 1 Video
- GRAPHICAL INTERPRETATIONBook:GRB PUBLICATIONChapter:GRAPHICAL INTERPRETATIONExercise:Electrochemistry
Explore 9 Videos
- GRAPHICAL INTERPRETATIONBook:GRB PUBLICATIONChapter:GRAPHICAL INTERPRETATIONExercise:H. Chemical Kinetics
Explore 1 Video
- F-BLOCK ELEMENTSBook:GRB PUBLICATIONChapter:F-BLOCK ELEMENTSExercise:Subjective type
Explore 7 Videos
- HYDROCARBON (ALIPHATIC)Book:GRB PUBLICATIONChapter:HYDROCARBON (ALIPHATIC)Exercise:Previous years jee questions
Explore 28 Videos
Similar Questions
Knowledge Check
Consider the reaction A→B. The concentration of both the reactants and the products varies exponentially with time. Which of the following figure correctly describes the change in concentration of reactants and products with time ?
A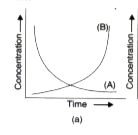 B
B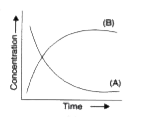 C
C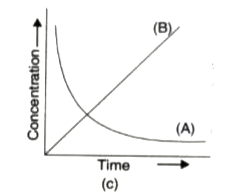 D
D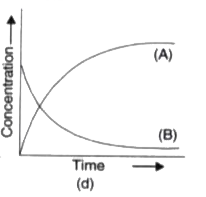
Consider the reaction A→B. The concentration of both the reactants and the products varies exponentially with time. Which of the following figure correctly describes the change in concentration of reactants and products with time ?
A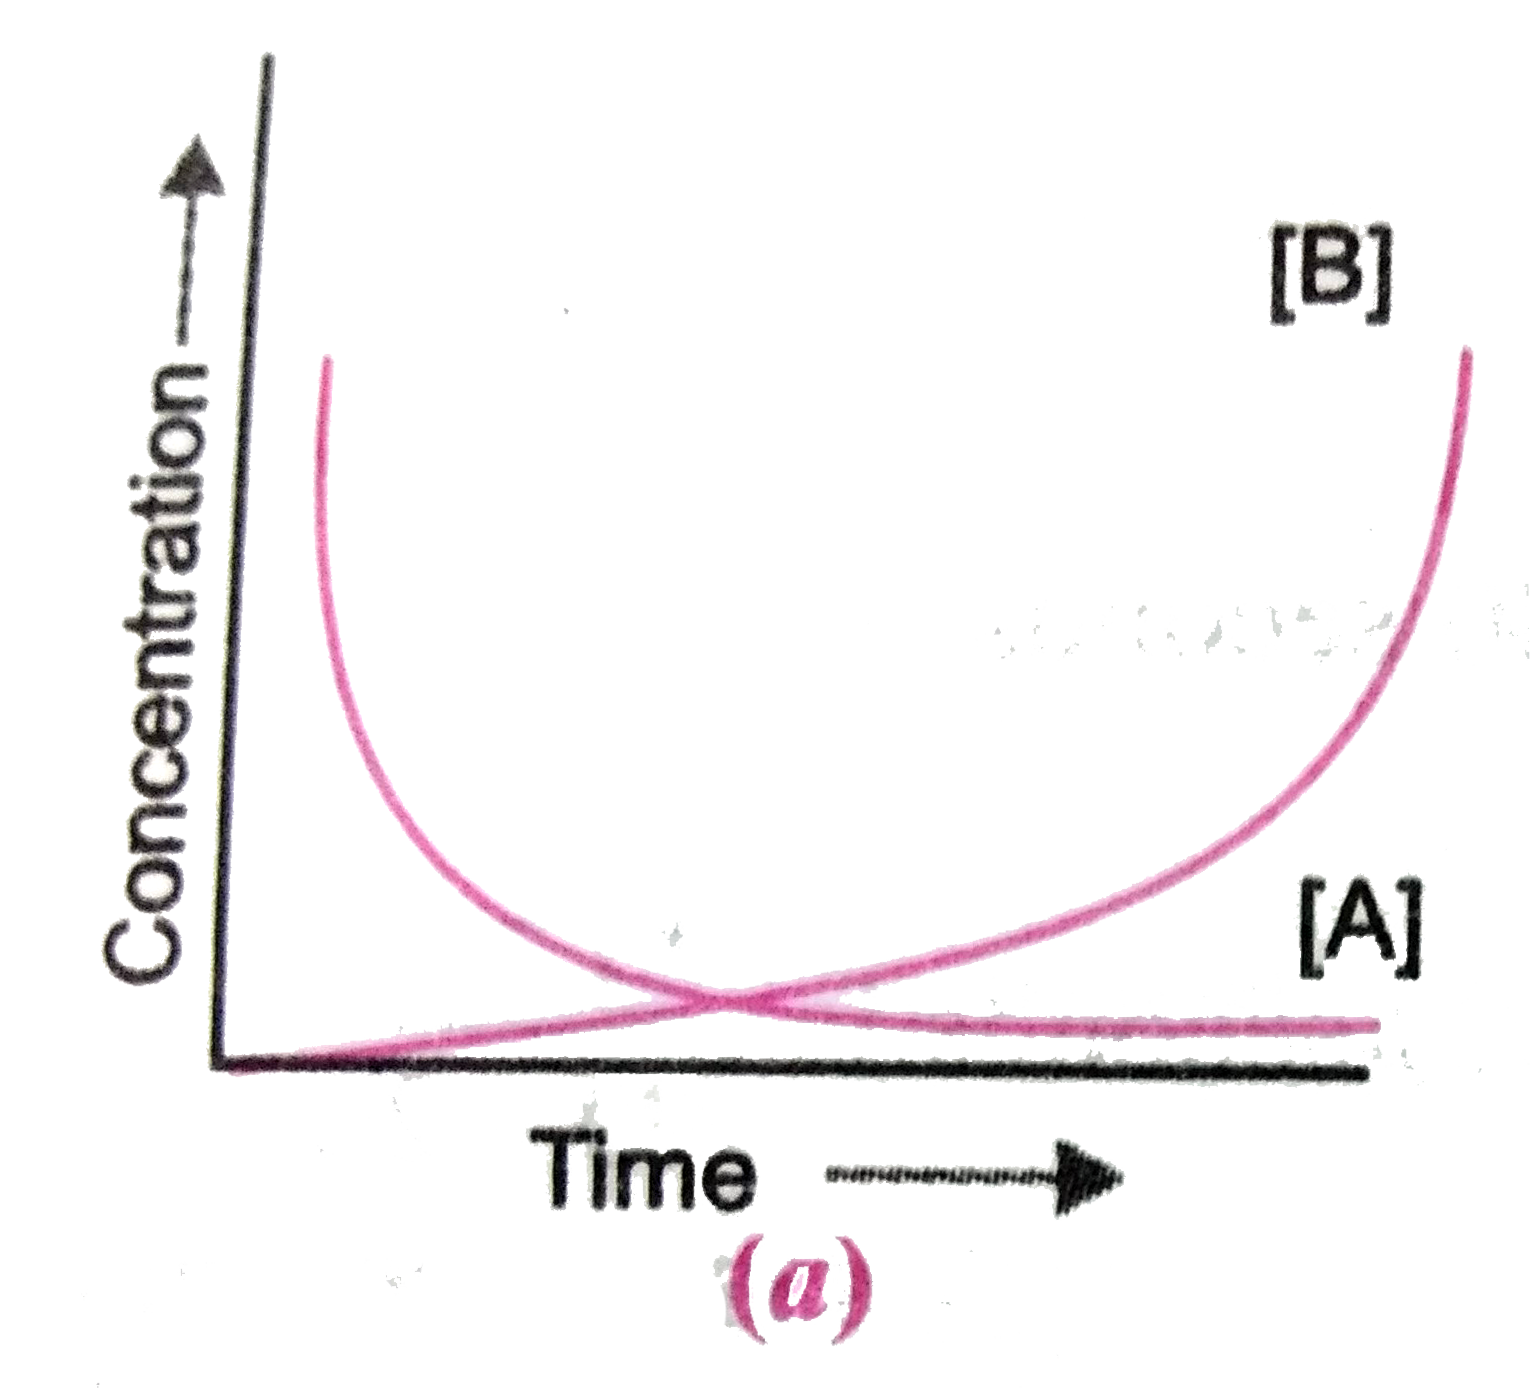 B
B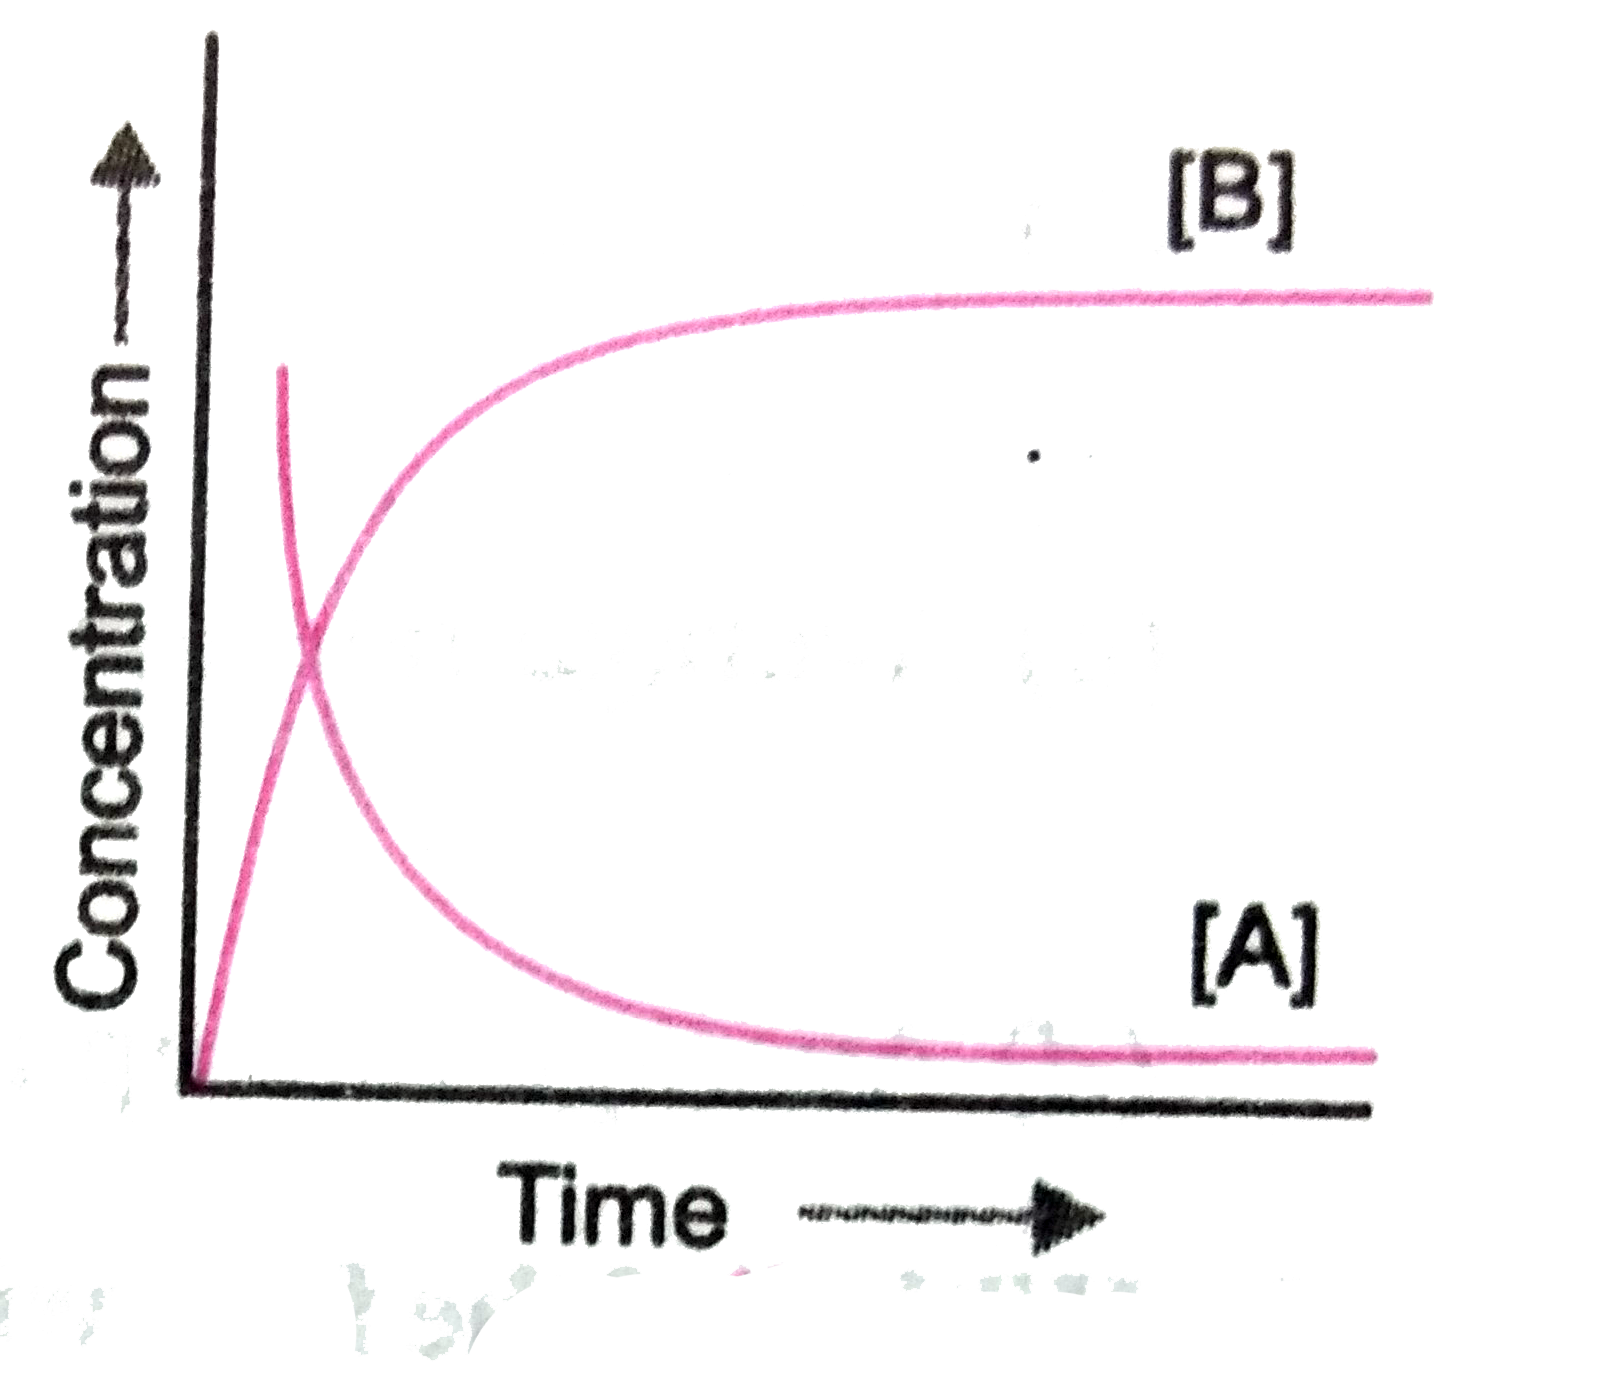 C
C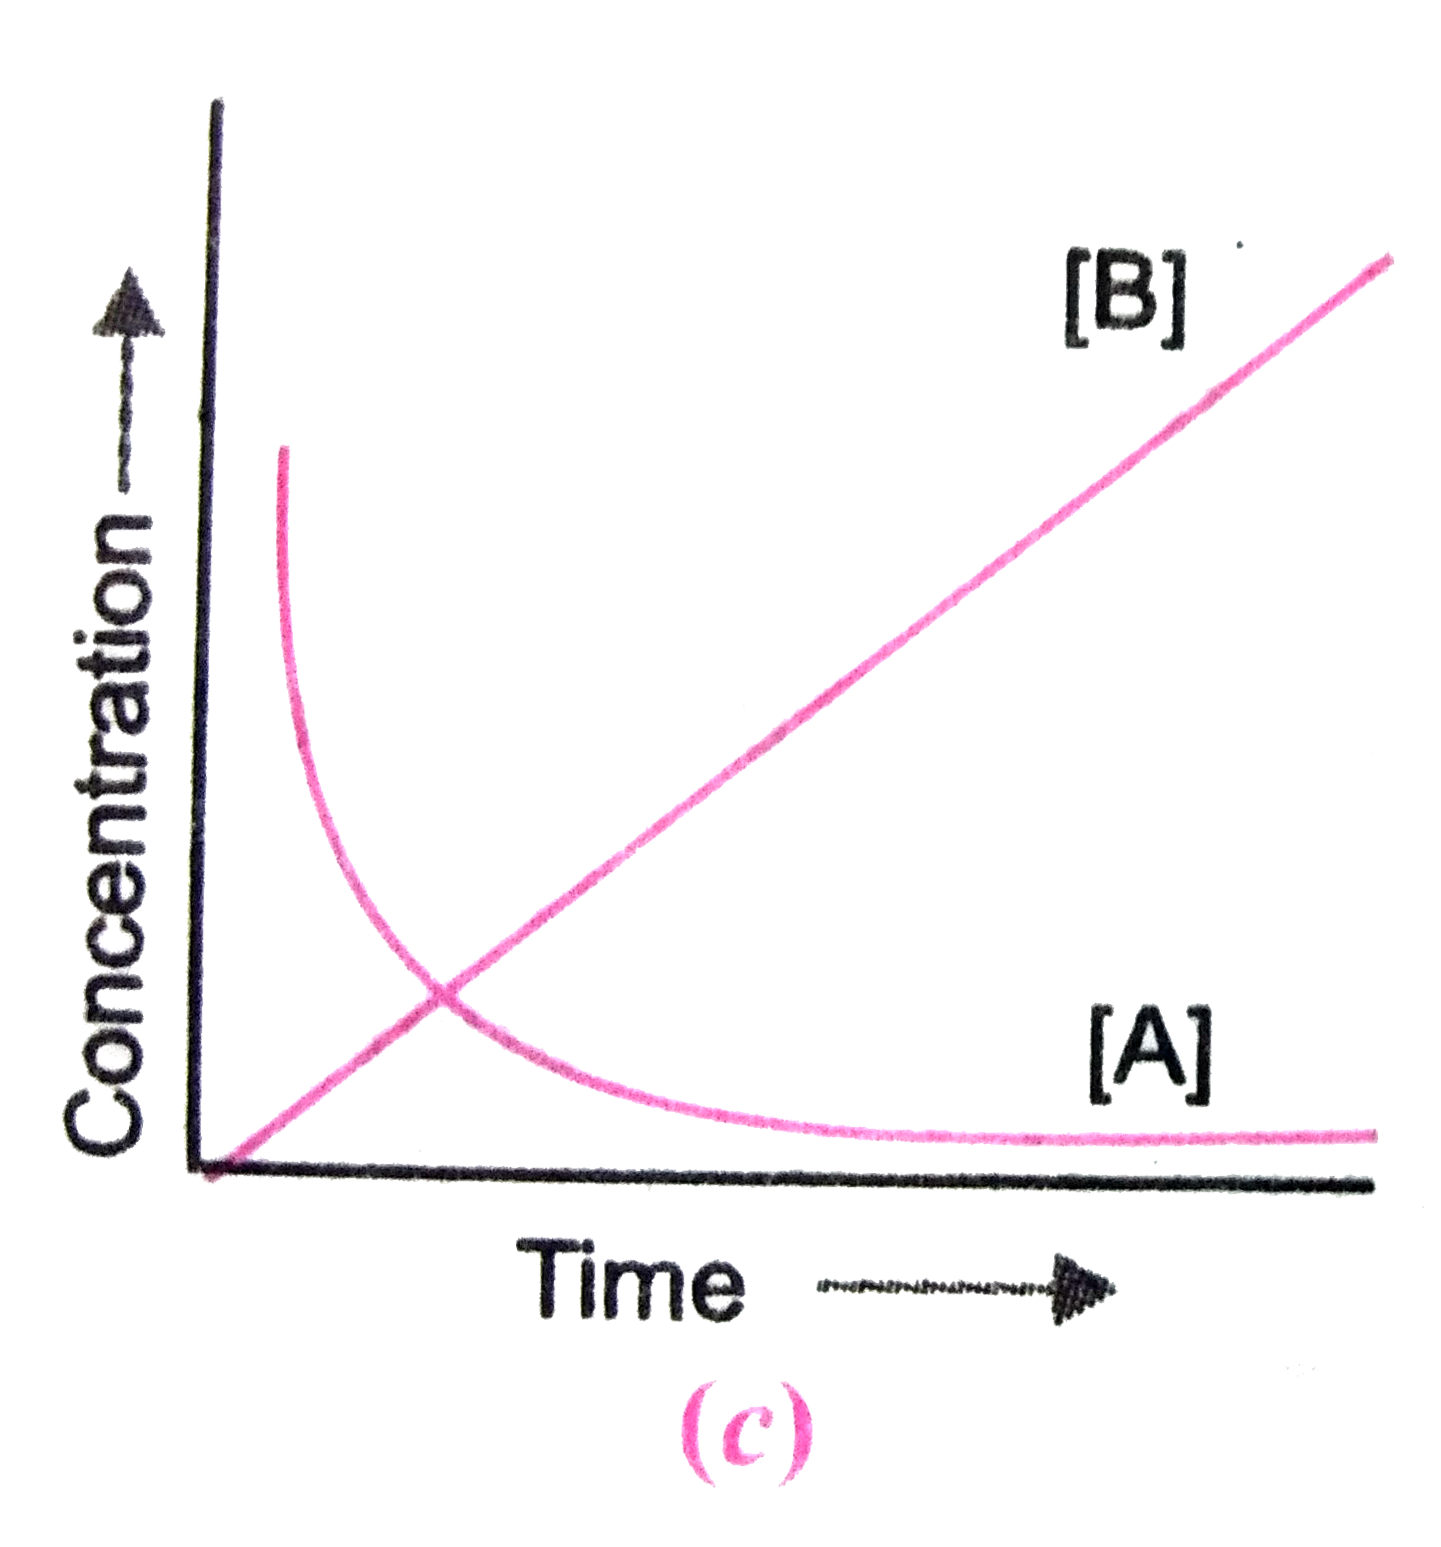 D
D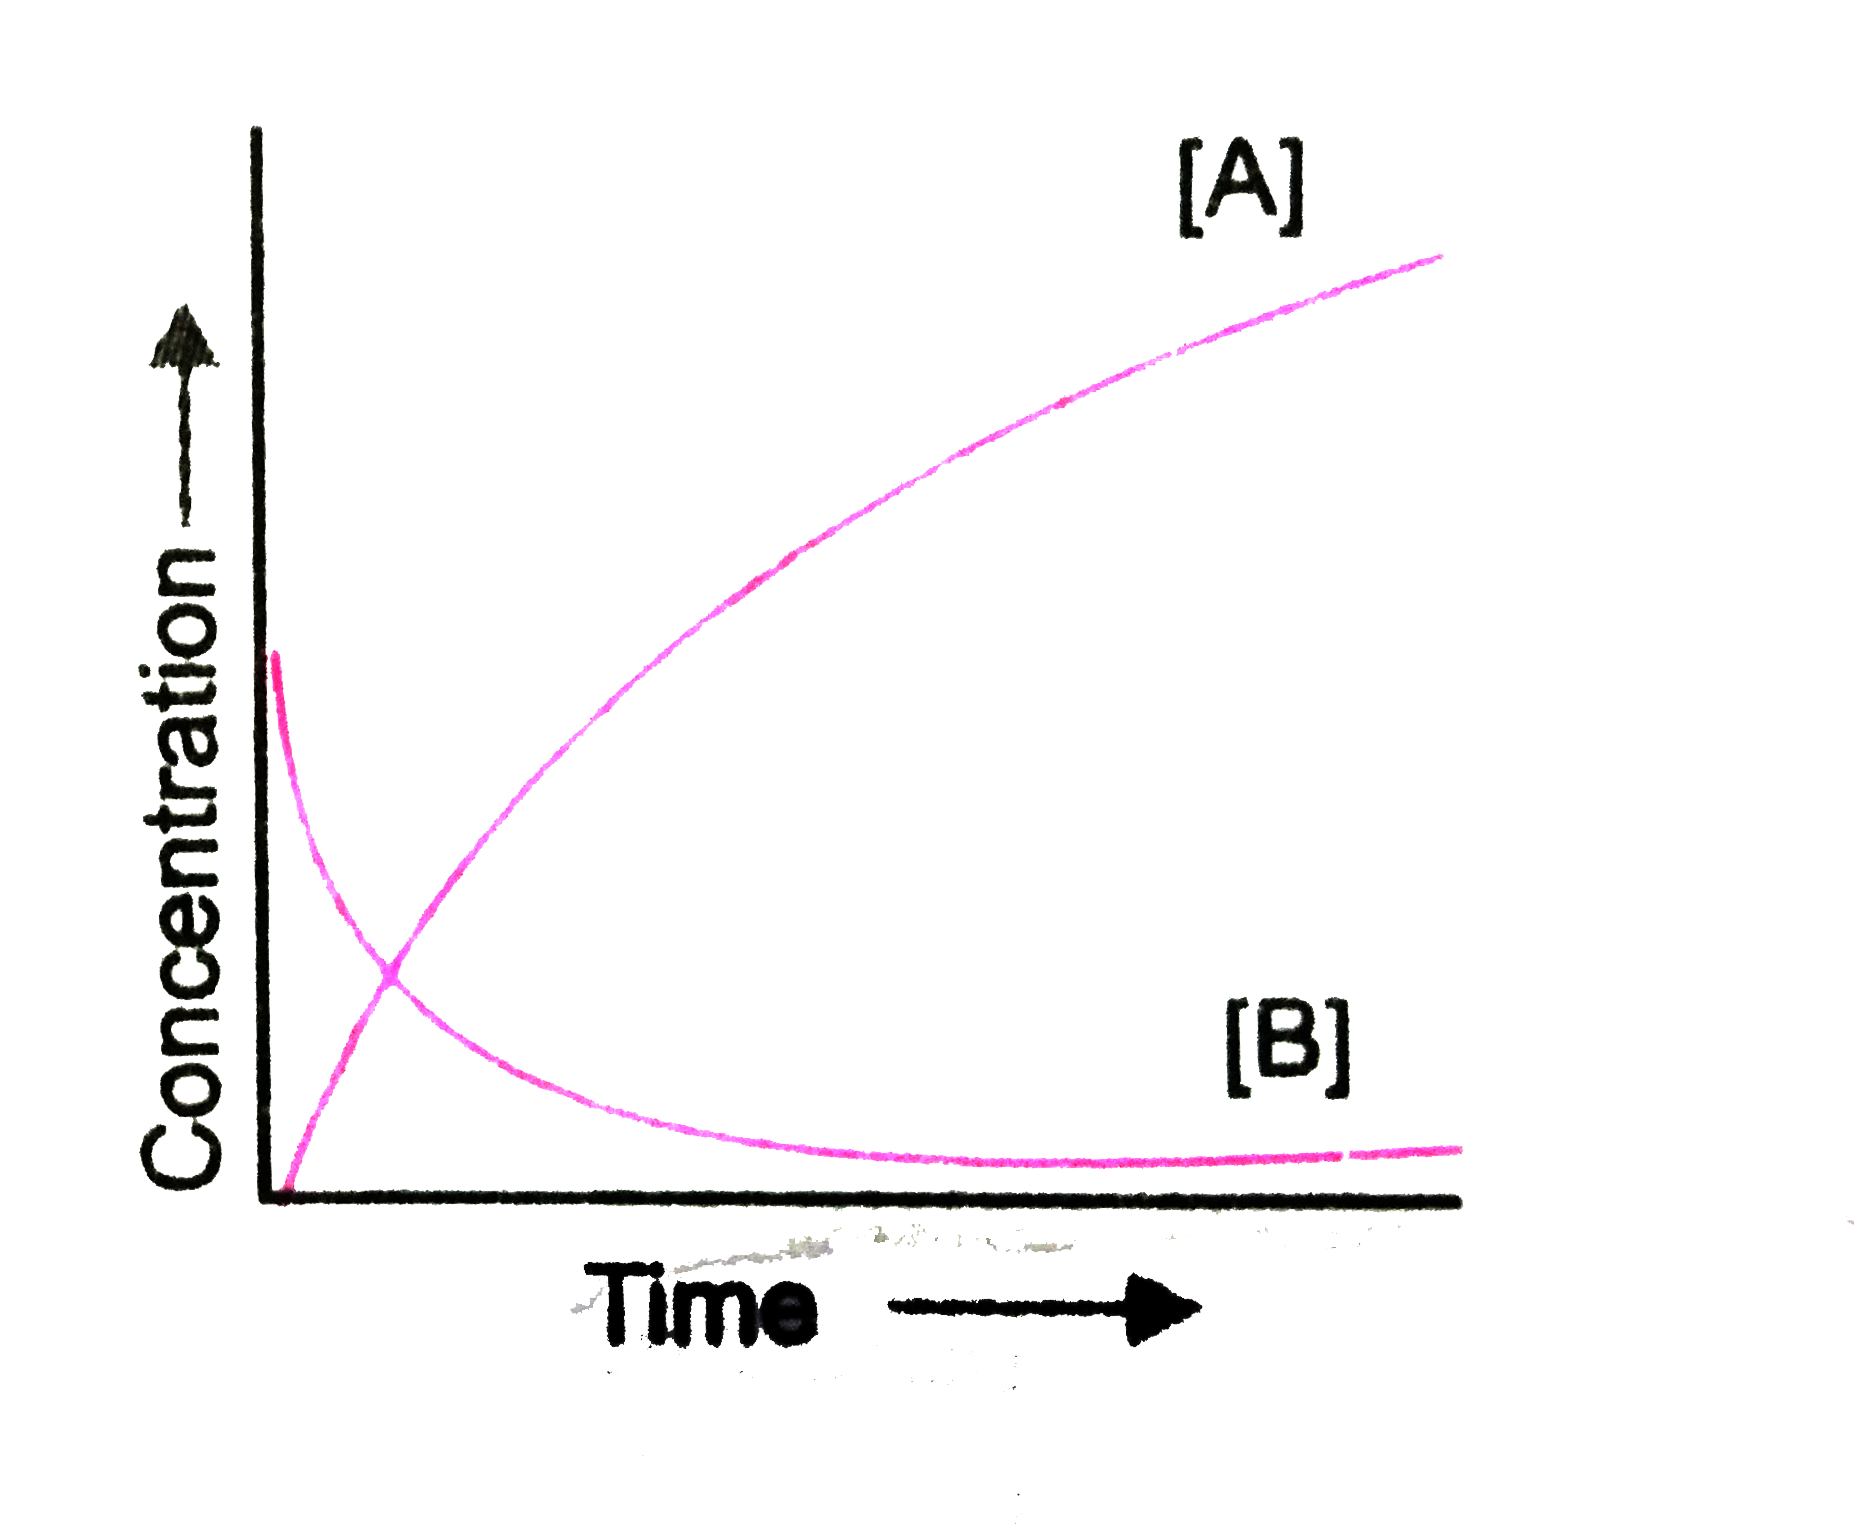
For the reaction,
4P+Q→2R+2S,
Which of the following statement(s) is /are true?
Rate of appearance of S is doubled the rate of the disappearance of Q.
Rate of disappearance of Q is one fourth the rate of disappearance of P.
Rate of formation of R is equal to the rate of formation of S.
Choose the correct ooption.AI and IIBII and IIICI and IIIDAll of these
Consider the reaction : A→B. The concentration of both reactant and product varies exponentially with time. Which of the following figure correctly describes the rate of reactant and product with time ?
View SolutionFor a reaction, 12A→2B rate of disappearance of A is related to the rate of appearance of B by the expression
View SolutionFor a reaction 1/2A→2B, rate of disappearance of A is related to the rate of appearance of B by the expression:
View Solution2AK−−→3B+4C
Rate of disappearance of A is 4×10⁻²Ms−1. Find the rate of appearance of B at the same instant.
View SolutionFor a reaction 12A→2B, rate of disappearance of 'A' is related to the rate of apperance of 'B' by the expression:
View Solution

