Which of the following graph is incorrect for variation of rate constant (K) with temperature for a reaction obeying Arrhenius equation ?
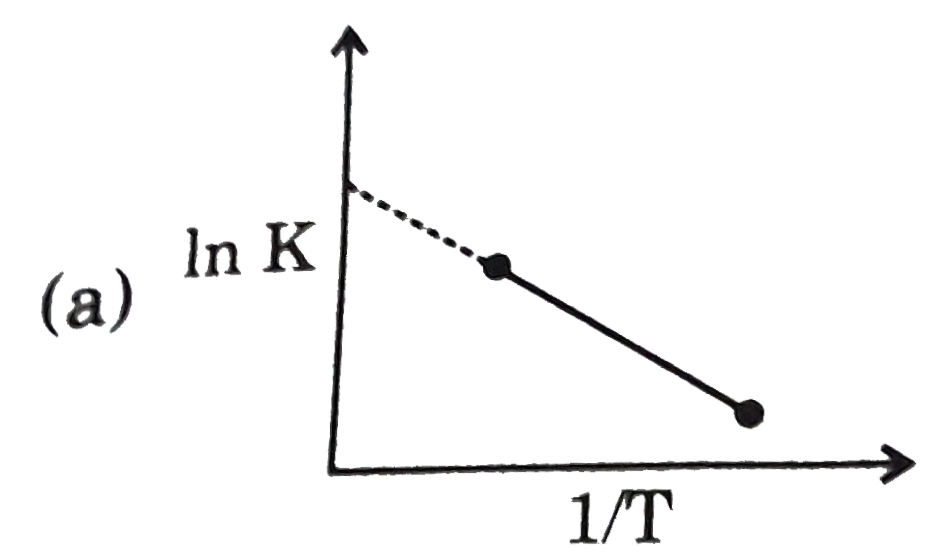
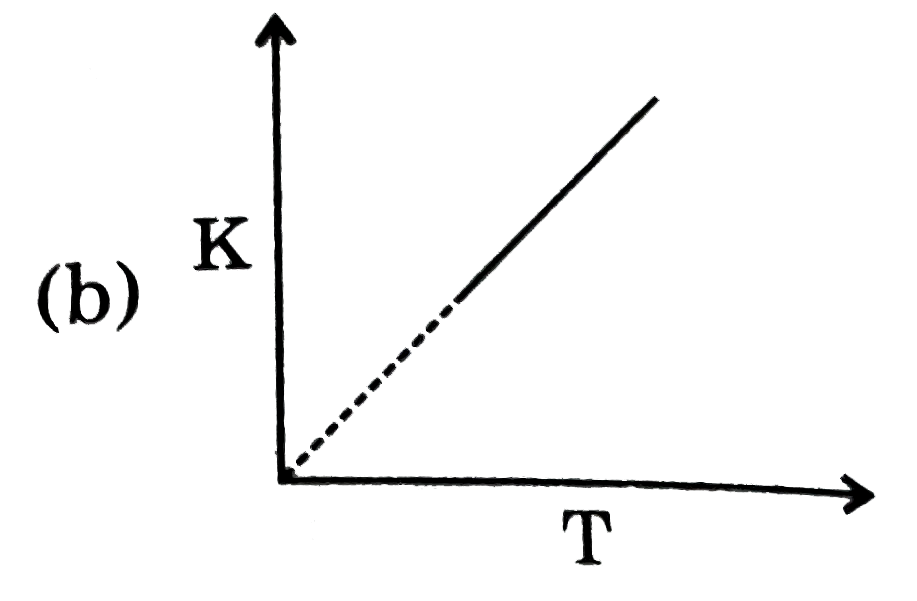
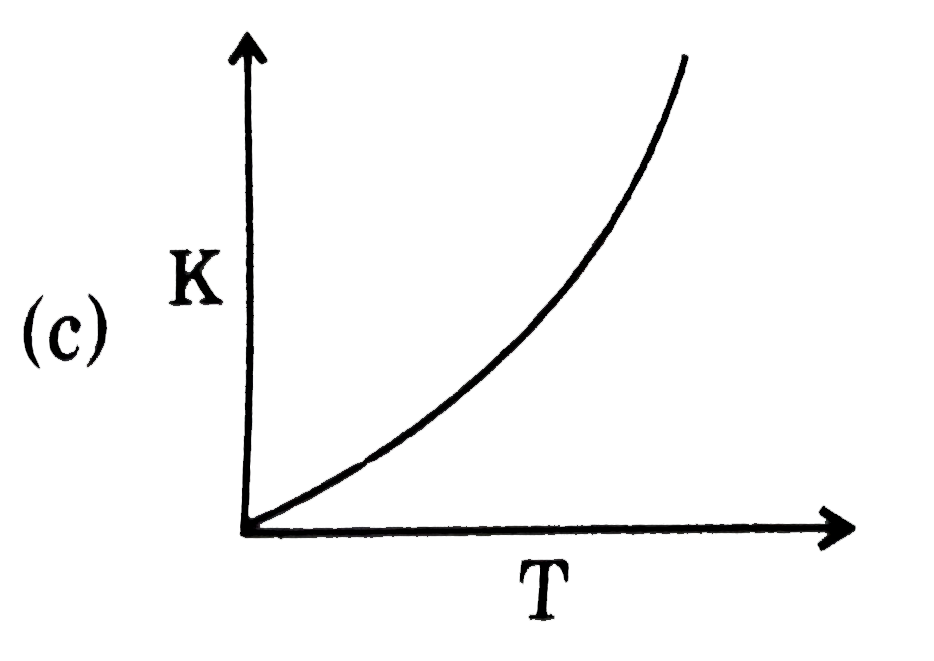
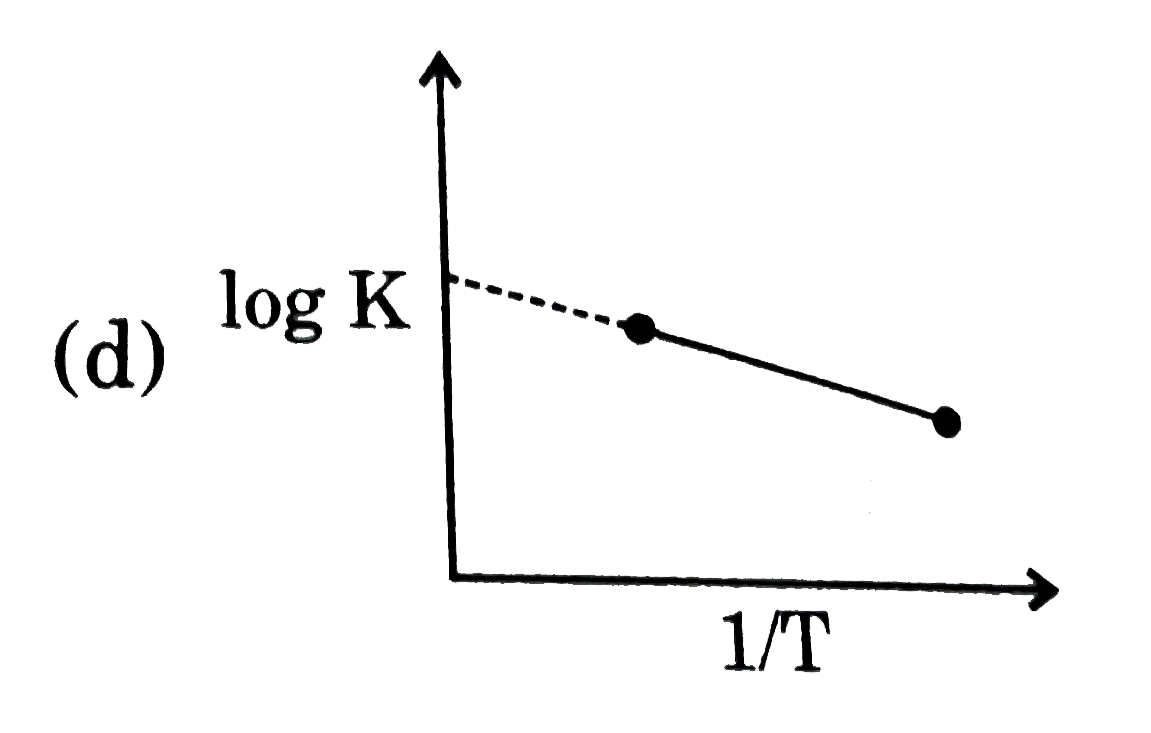
The correct Answer is:B
Step by step video, text & image solution for Which of the following graph is incorrect for variation of rate constant (K) with temperature for a reaction obeying Arrhenius equation ? by Chemistry experts to help you in doubts & scoring excellent marks in Class 12 exams.
Updated on:21/07/2023Topper's Solved these Questions
- GRAPHICAL INTERPRETATIONBook:GRB PUBLICATIONChapter:GRAPHICAL INTERPRETATIONExercise:I.Electrochemistry
Explore 1 Video
- GRAPHICAL INTERPRETATIONBook:GRB PUBLICATIONChapter:GRAPHICAL INTERPRETATIONExercise:Electrochemistry
Explore 9 Videos
- GRAPHICAL INTERPRETATIONBook:GRB PUBLICATIONChapter:GRAPHICAL INTERPRETATIONExercise:H. Chemical Kinetics
Explore 1 Video
- F-BLOCK ELEMENTSBook:GRB PUBLICATIONChapter:F-BLOCK ELEMENTSExercise:Subjective type
Explore 7 Videos
- HYDROCARBON (ALIPHATIC)Book:GRB PUBLICATIONChapter:HYDROCARBON (ALIPHATIC)Exercise:Previous years jee questions
Explore 28 Videos
Similar Questions
Knowledge Check
Which of the following graphs is incorrect regarding rate constant (k) and absolute temperature ? [Symbols have usual meaning]
A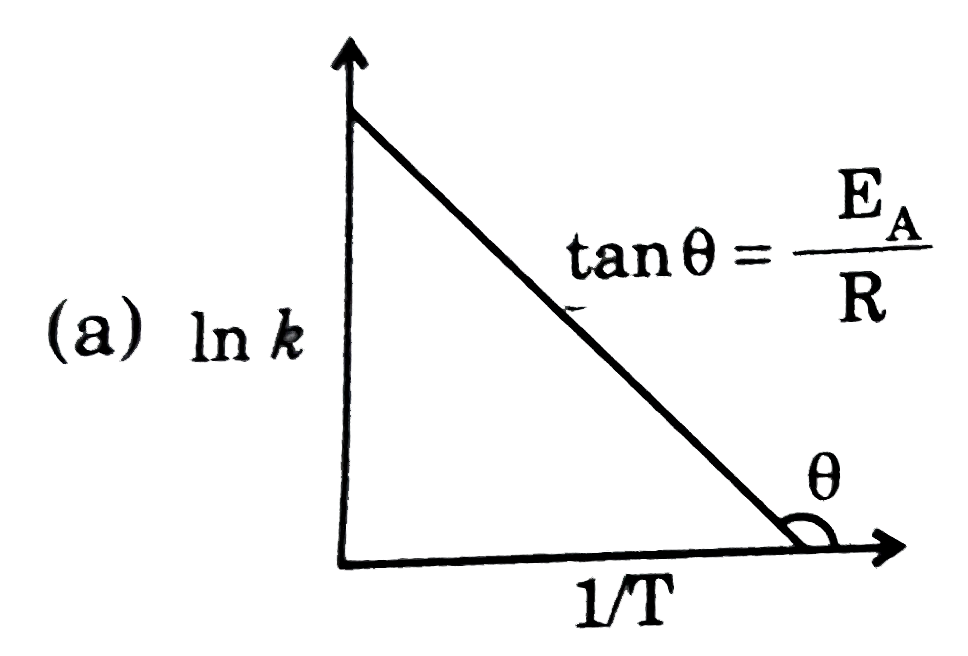 B
B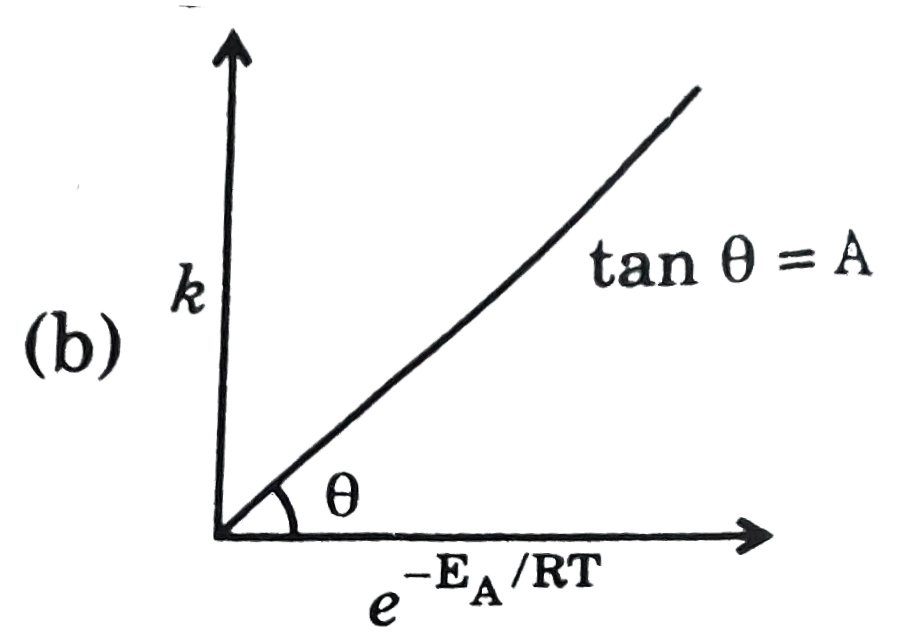 C
C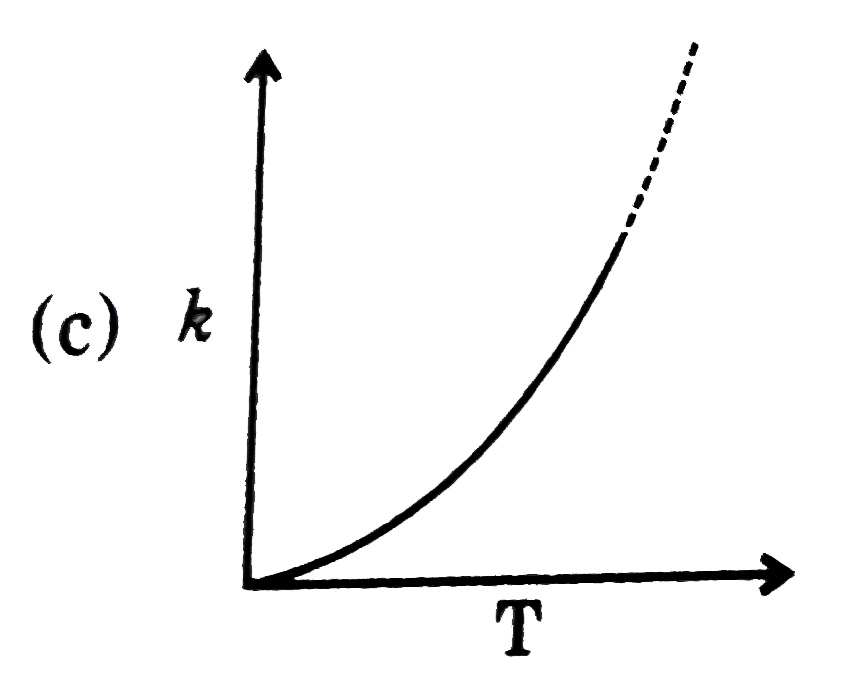 D
D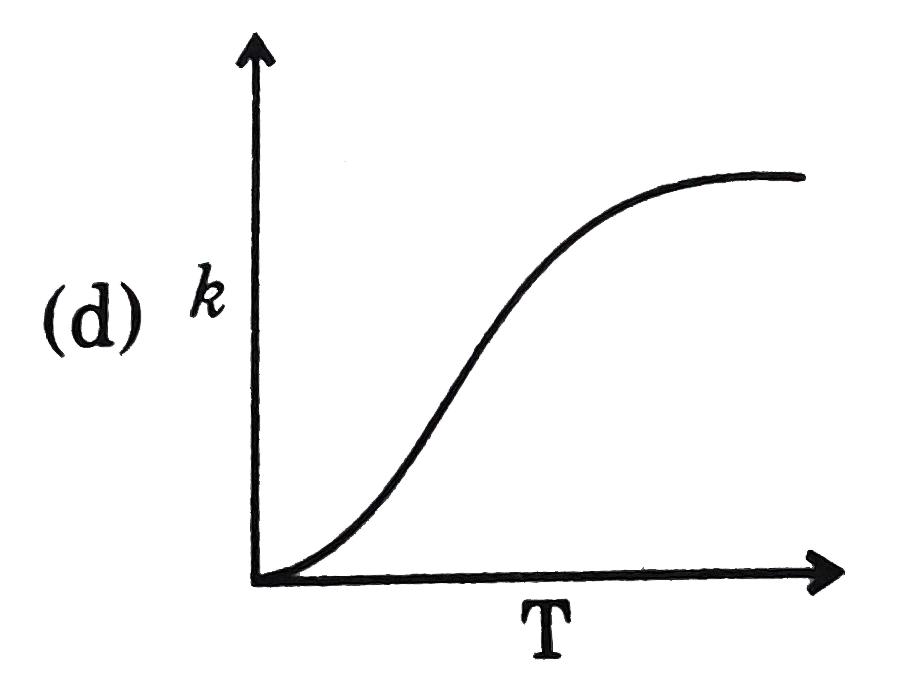
Plots showing the variation of the rate constant (k) with temperature (T) are given below. The plot that follows the Arrhenius equation is
A B
B C
C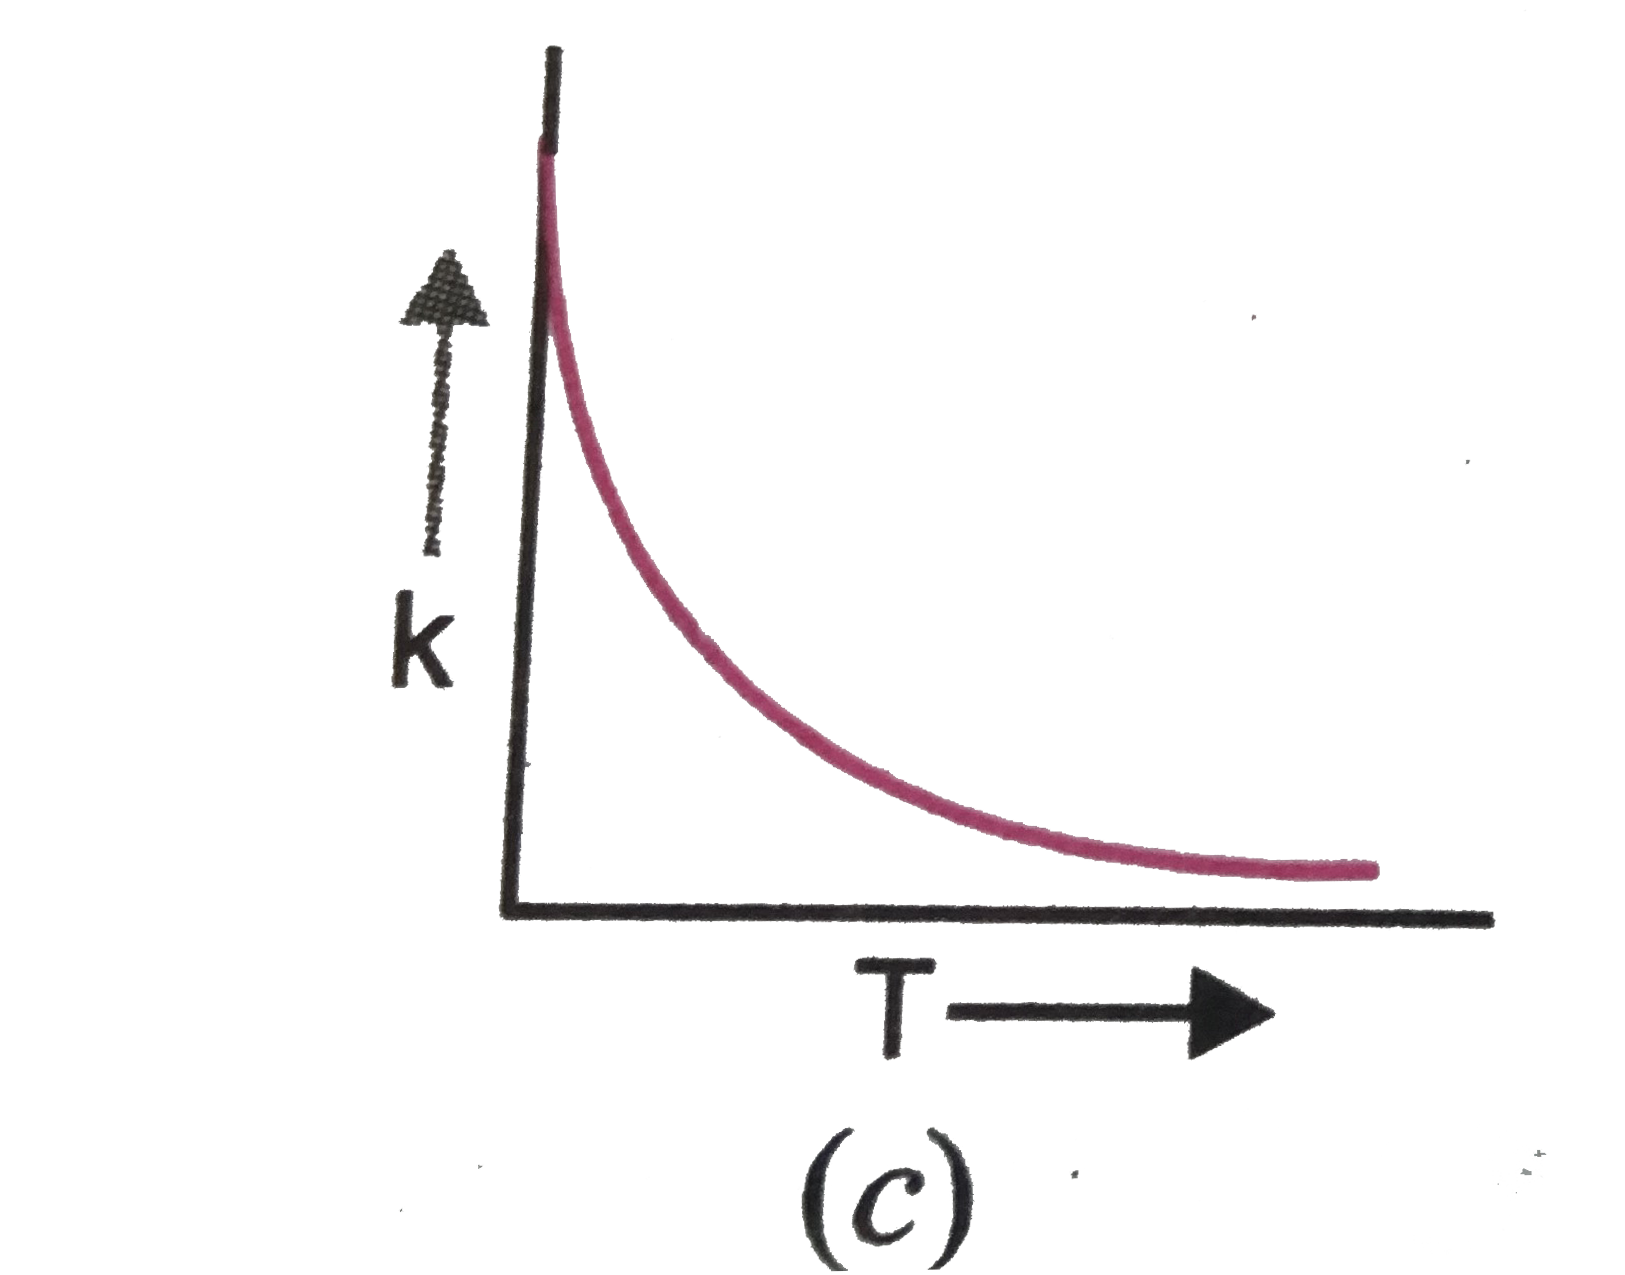 D
D
Plots showing the variation of the rate constant (k) with temperature (T) are given below. The plot that follows the Arrhenius equation is
A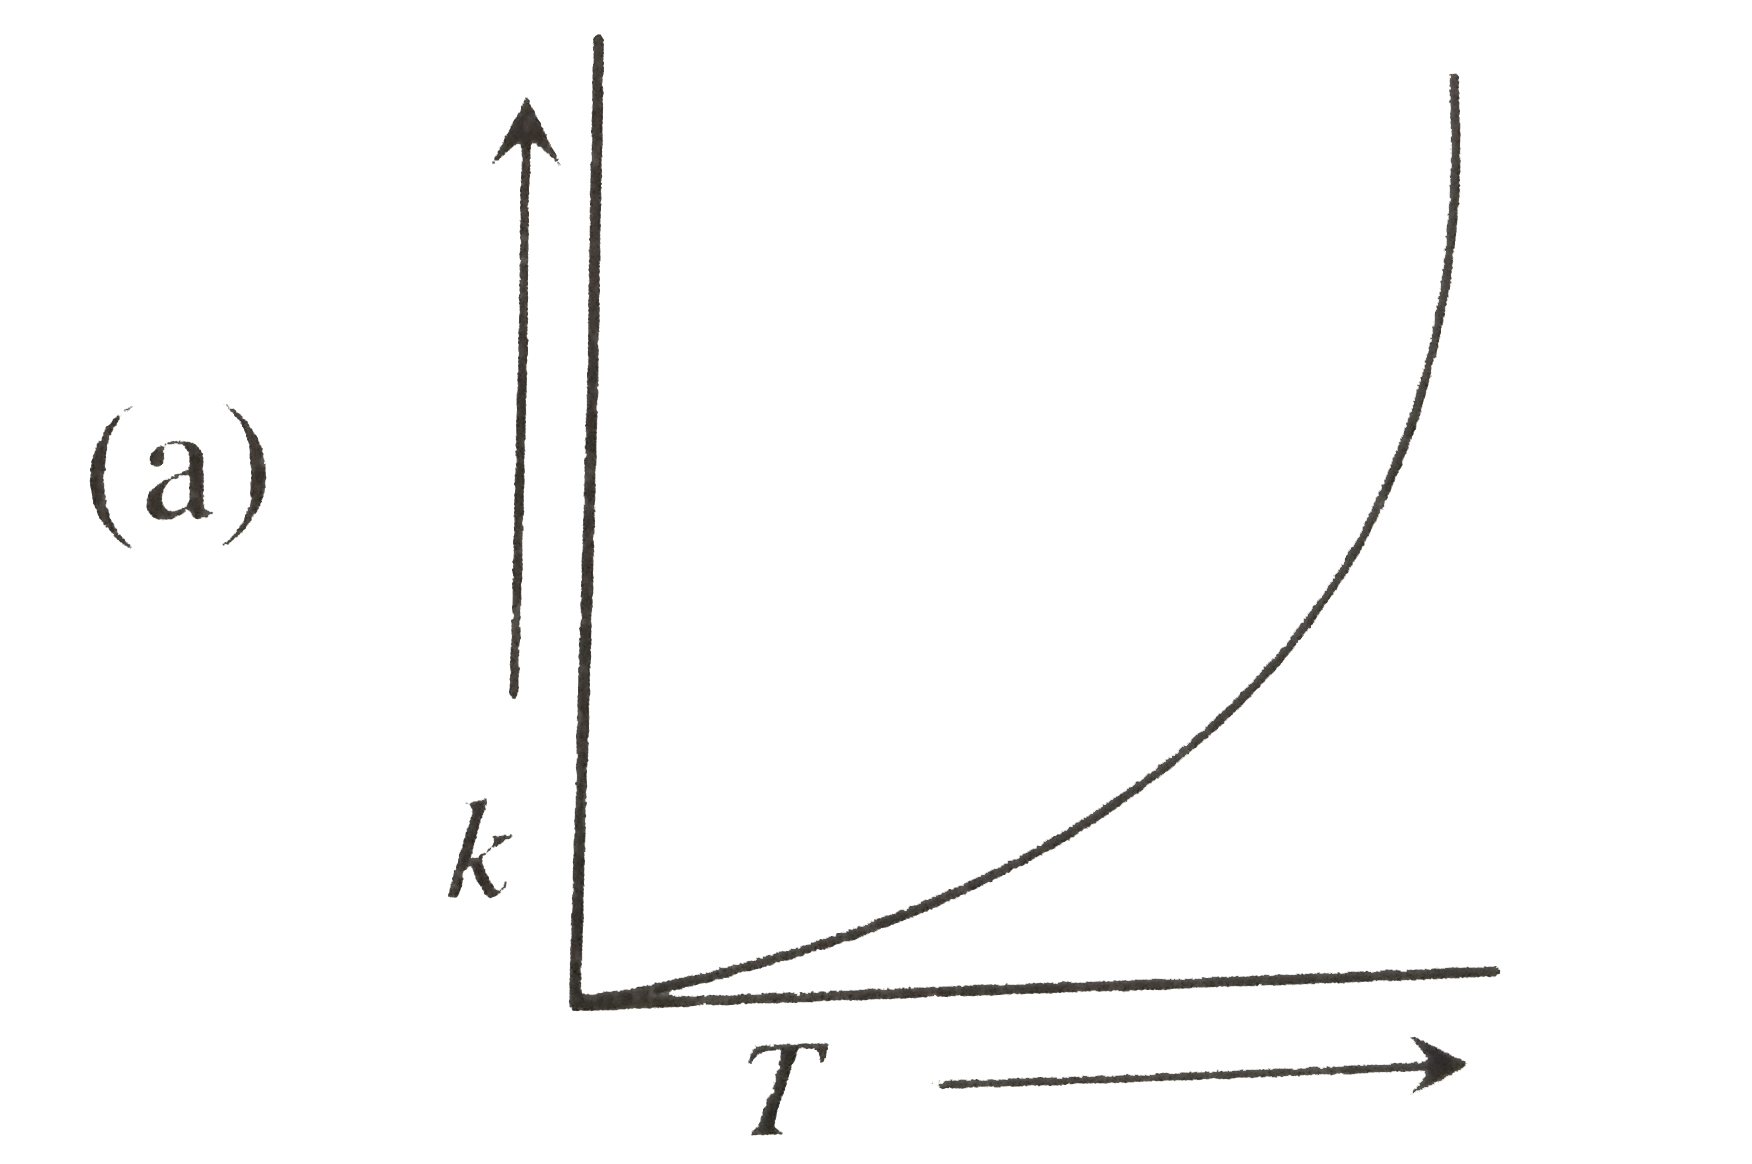 B
B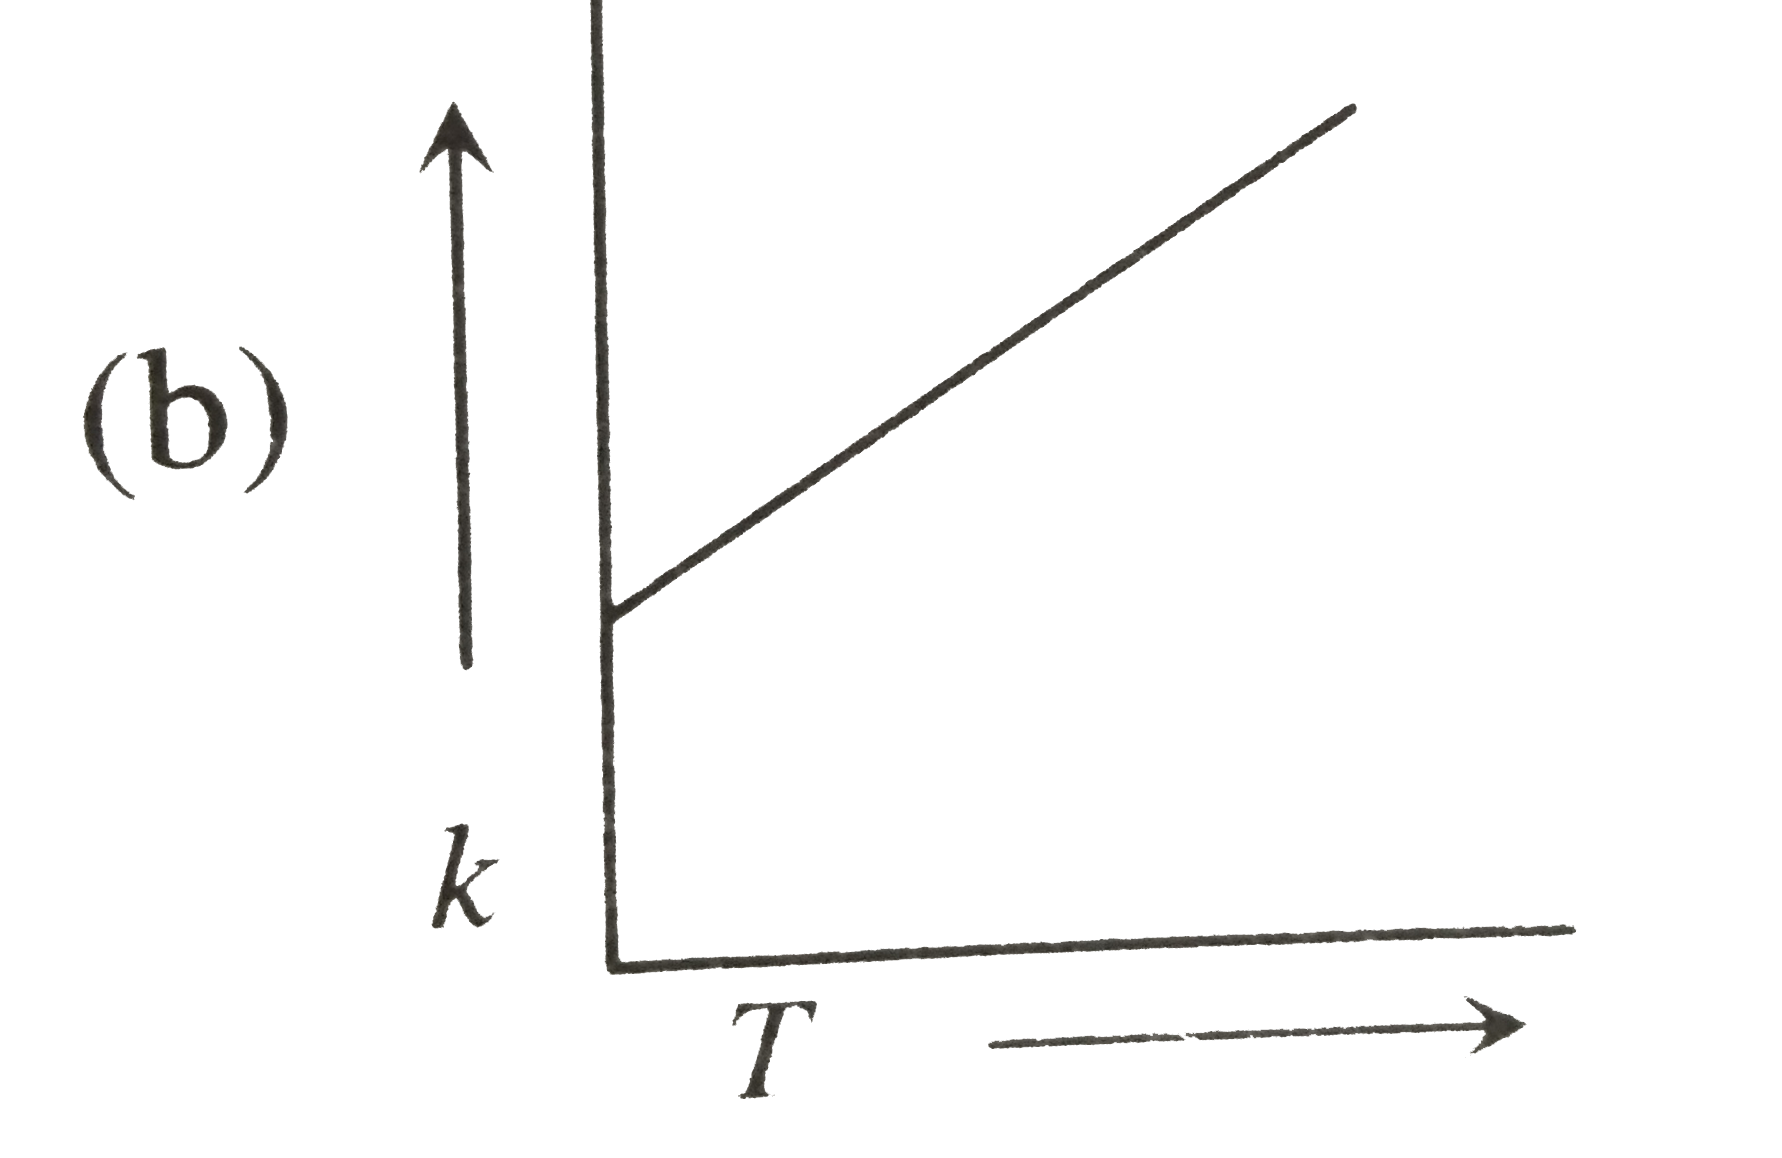 C
C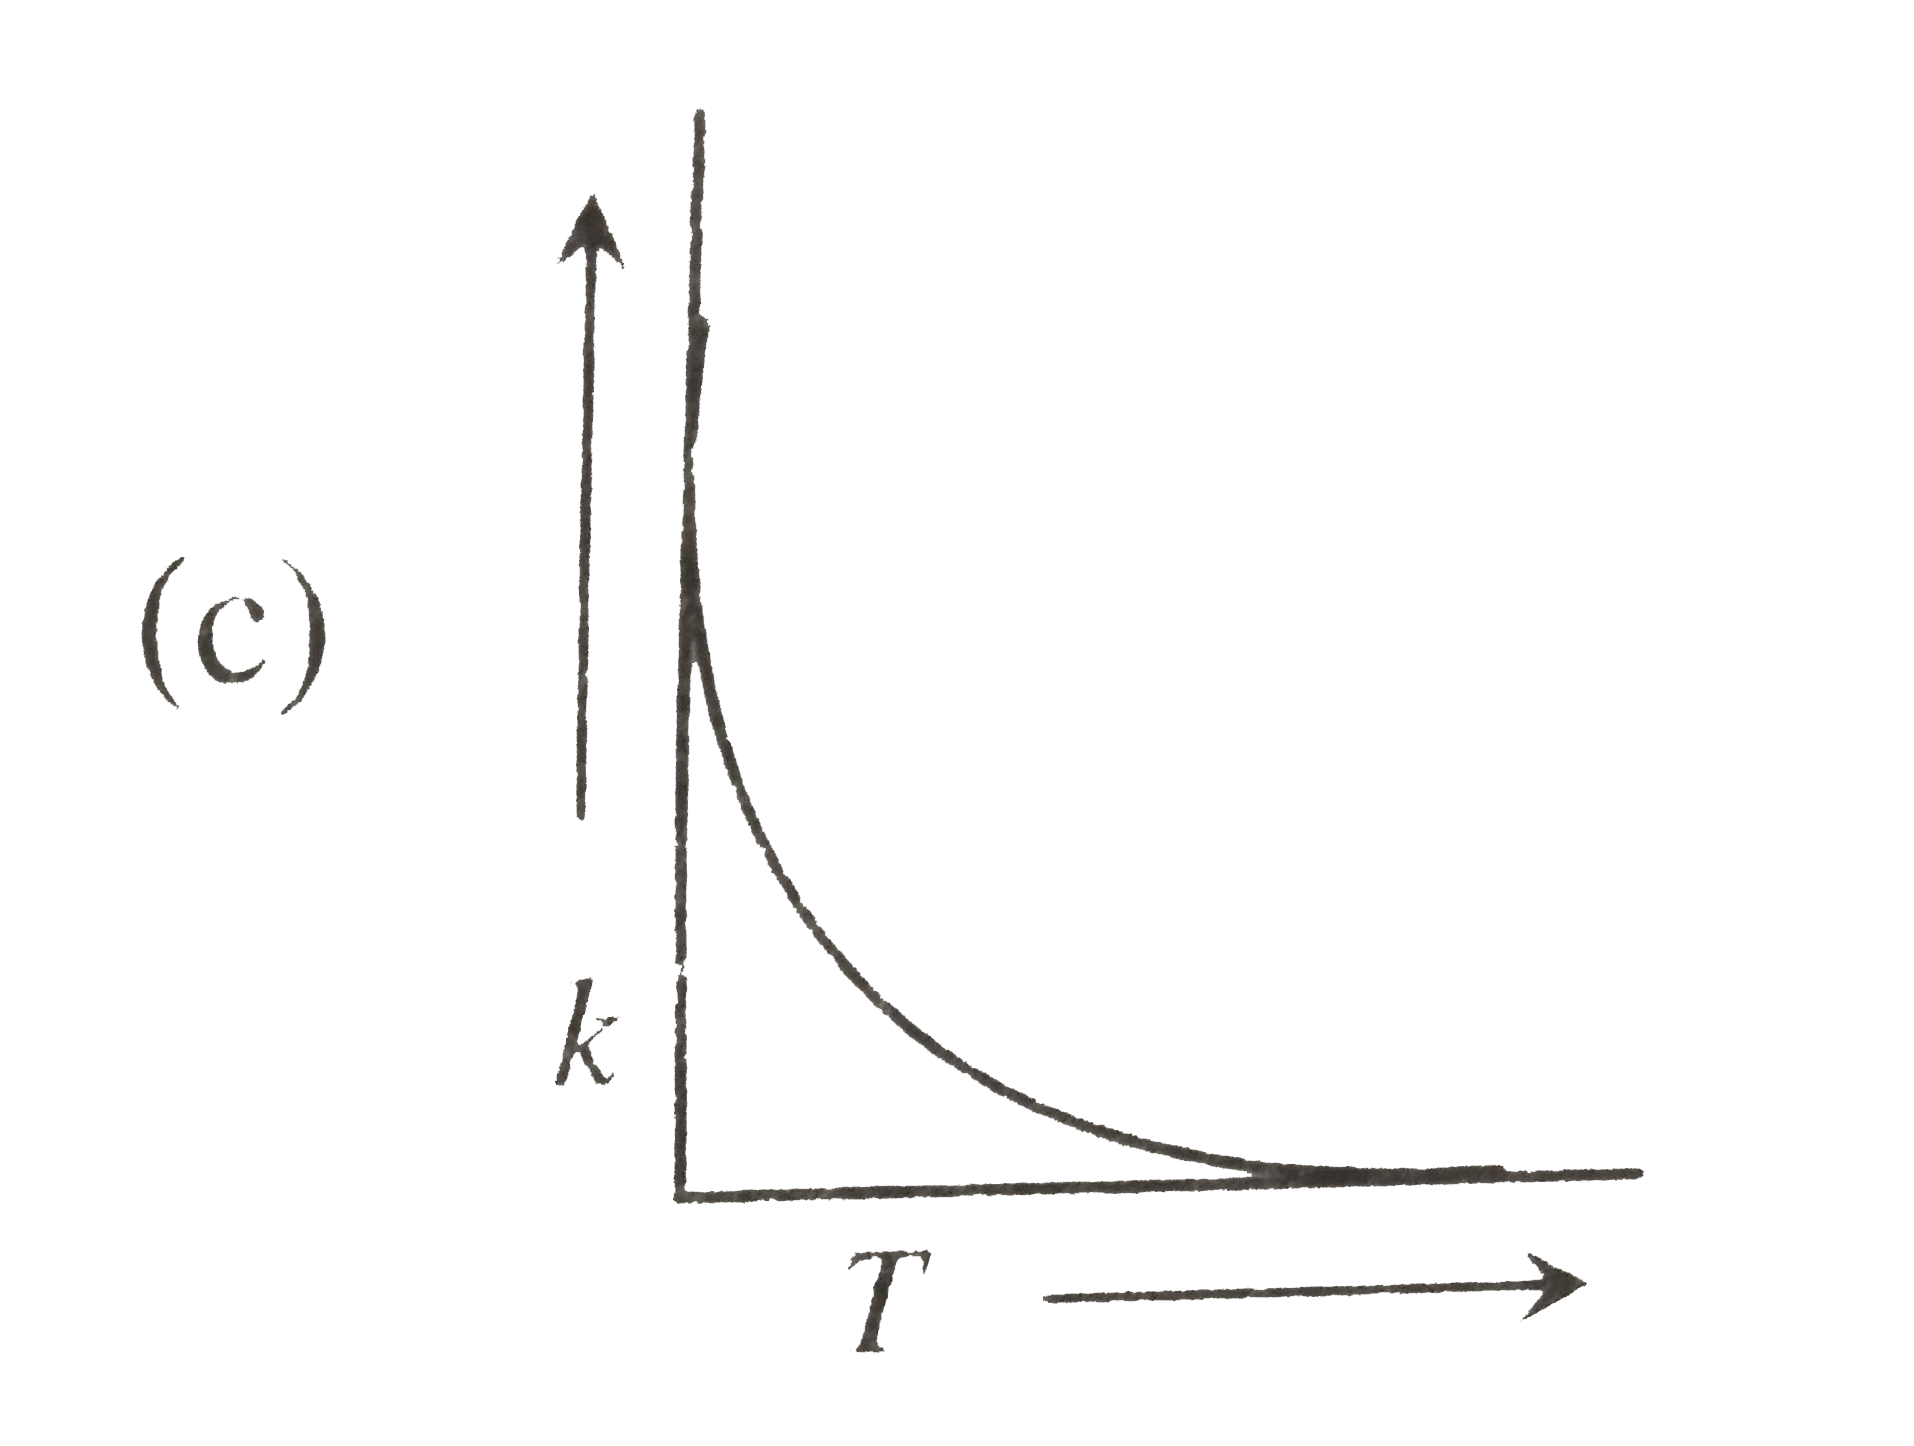 D
D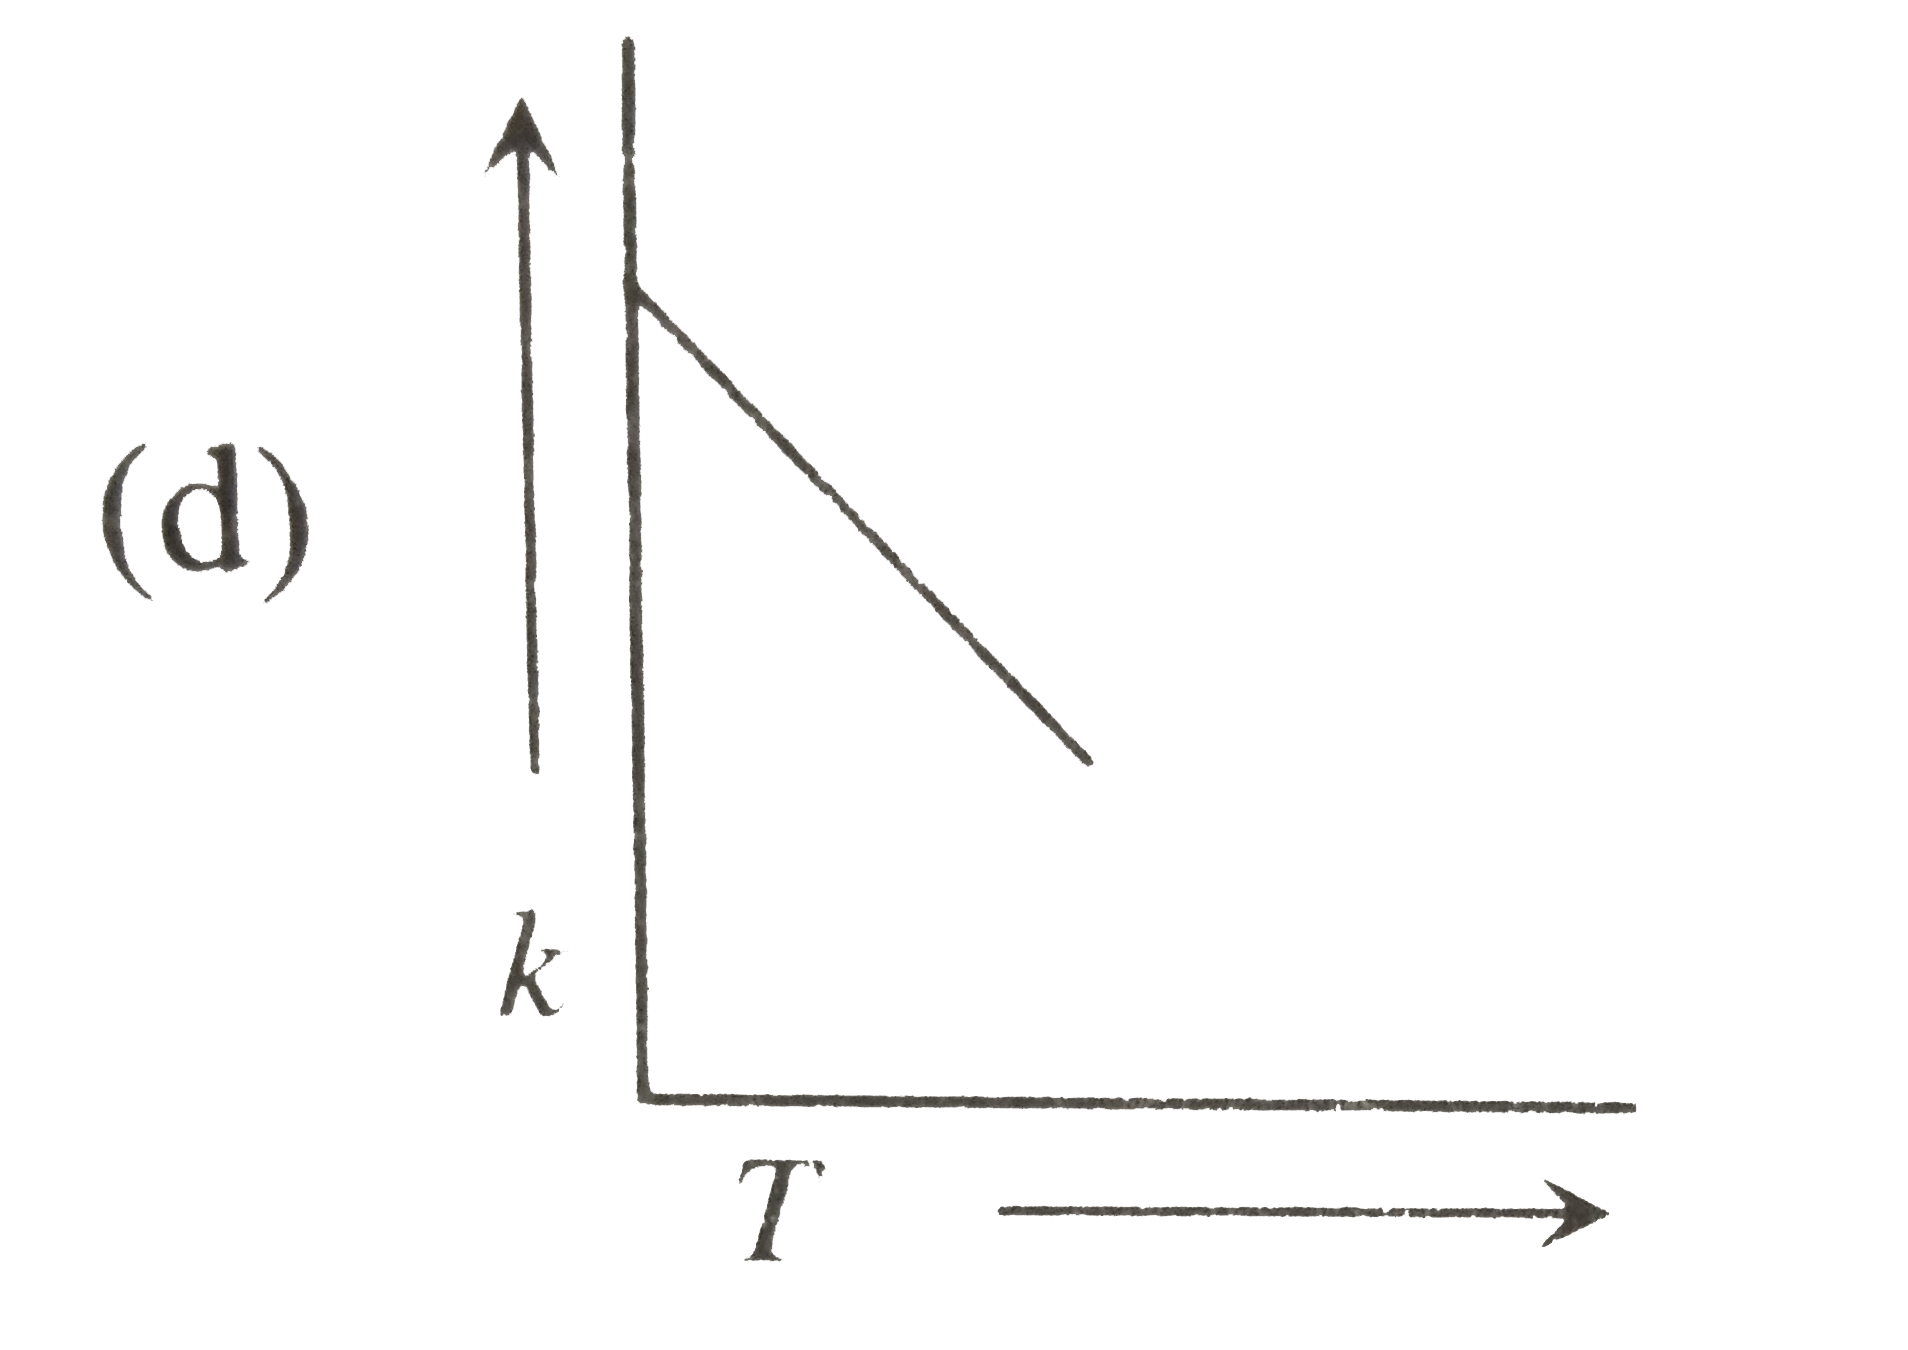
Which one of the following given graphs represents the variation of rate constant (k) with temperature (t) for an endothermic reaction ?
View SolutionPlots showing the variation of the rate constant (k) with temperature (T) are given below. The plot that follows Arrhenius equations is
View SolutionPlots showing the variation of the rate constant (k) with temperature (T) are given below. The plot that follows the Arrhenius equation is
View SolutionWhich of the following graphs describes the typical dependence of the rate constant of a reaction on temperature ?
View SolutionWhich of the following graphs correctly represents the variation of β=−(dV/dP)/V with P for an ideal gas at constant temperature?
View Solution

