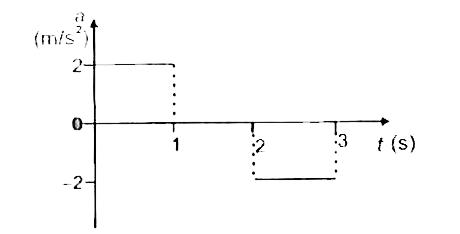
The acceleration vs time of a particle moving along +x direction is shown in figure-1.23. If starts at t=0, from rest, Draw the position -time graph for the motion.
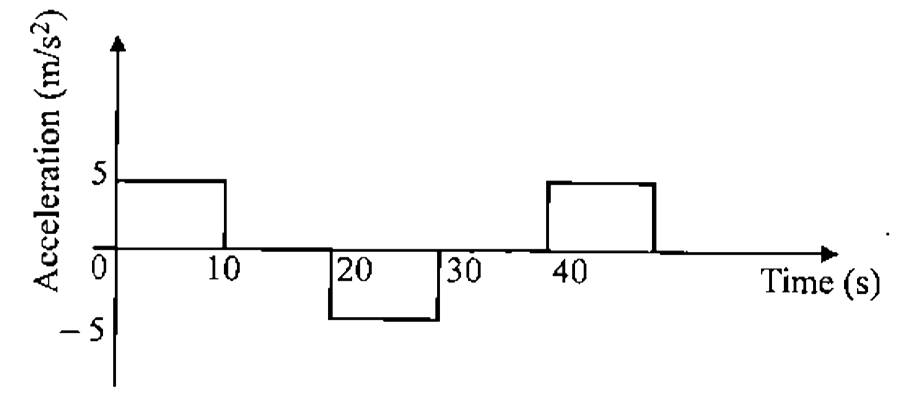
Step by step video, text & image solution for The acceleration vs time of a particle moving along +x direction is shown in figure-1.23. If starts at t = 0, from rest, Draw the position -time graph for the motion. by Physics experts to help you in doubts & scoring excellent marks in Class 11 exams.
Updated on:21/07/2023Topper's Solved these Questions
- KINEMATICSBook:PHYSICS GALAXY - ASHISH ARORAChapter:KINEMATICSExercise:Discussion Question
Explore 18 Videos
- KINEMATICSBook:PHYSICS GALAXY - ASHISH ARORAChapter:KINEMATICSExercise:Conceptual MCQs Single Option Correct
Explore 35 Videos
- KINEMATICSBook:PHYSICS GALAXY - ASHISH ARORAChapter:KINEMATICSExercise:Unsolved Numerical Pro.
Explore 83 Videos
- GRAVITATIONBook:PHYSICS GALAXY - ASHISH ARORAChapter:GRAVITATIONExercise:Unsolved Numerical
Explore 94 Videos
- LINEAR MOMENTUM & ITS CONSERVATIONBook:PHYSICS GALAXY - ASHISH ARORAChapter:LINEAR MOMENTUM & ITS CONSERVATIONExercise:exercise 1.3
Explore 3 Videos
Similar Questions
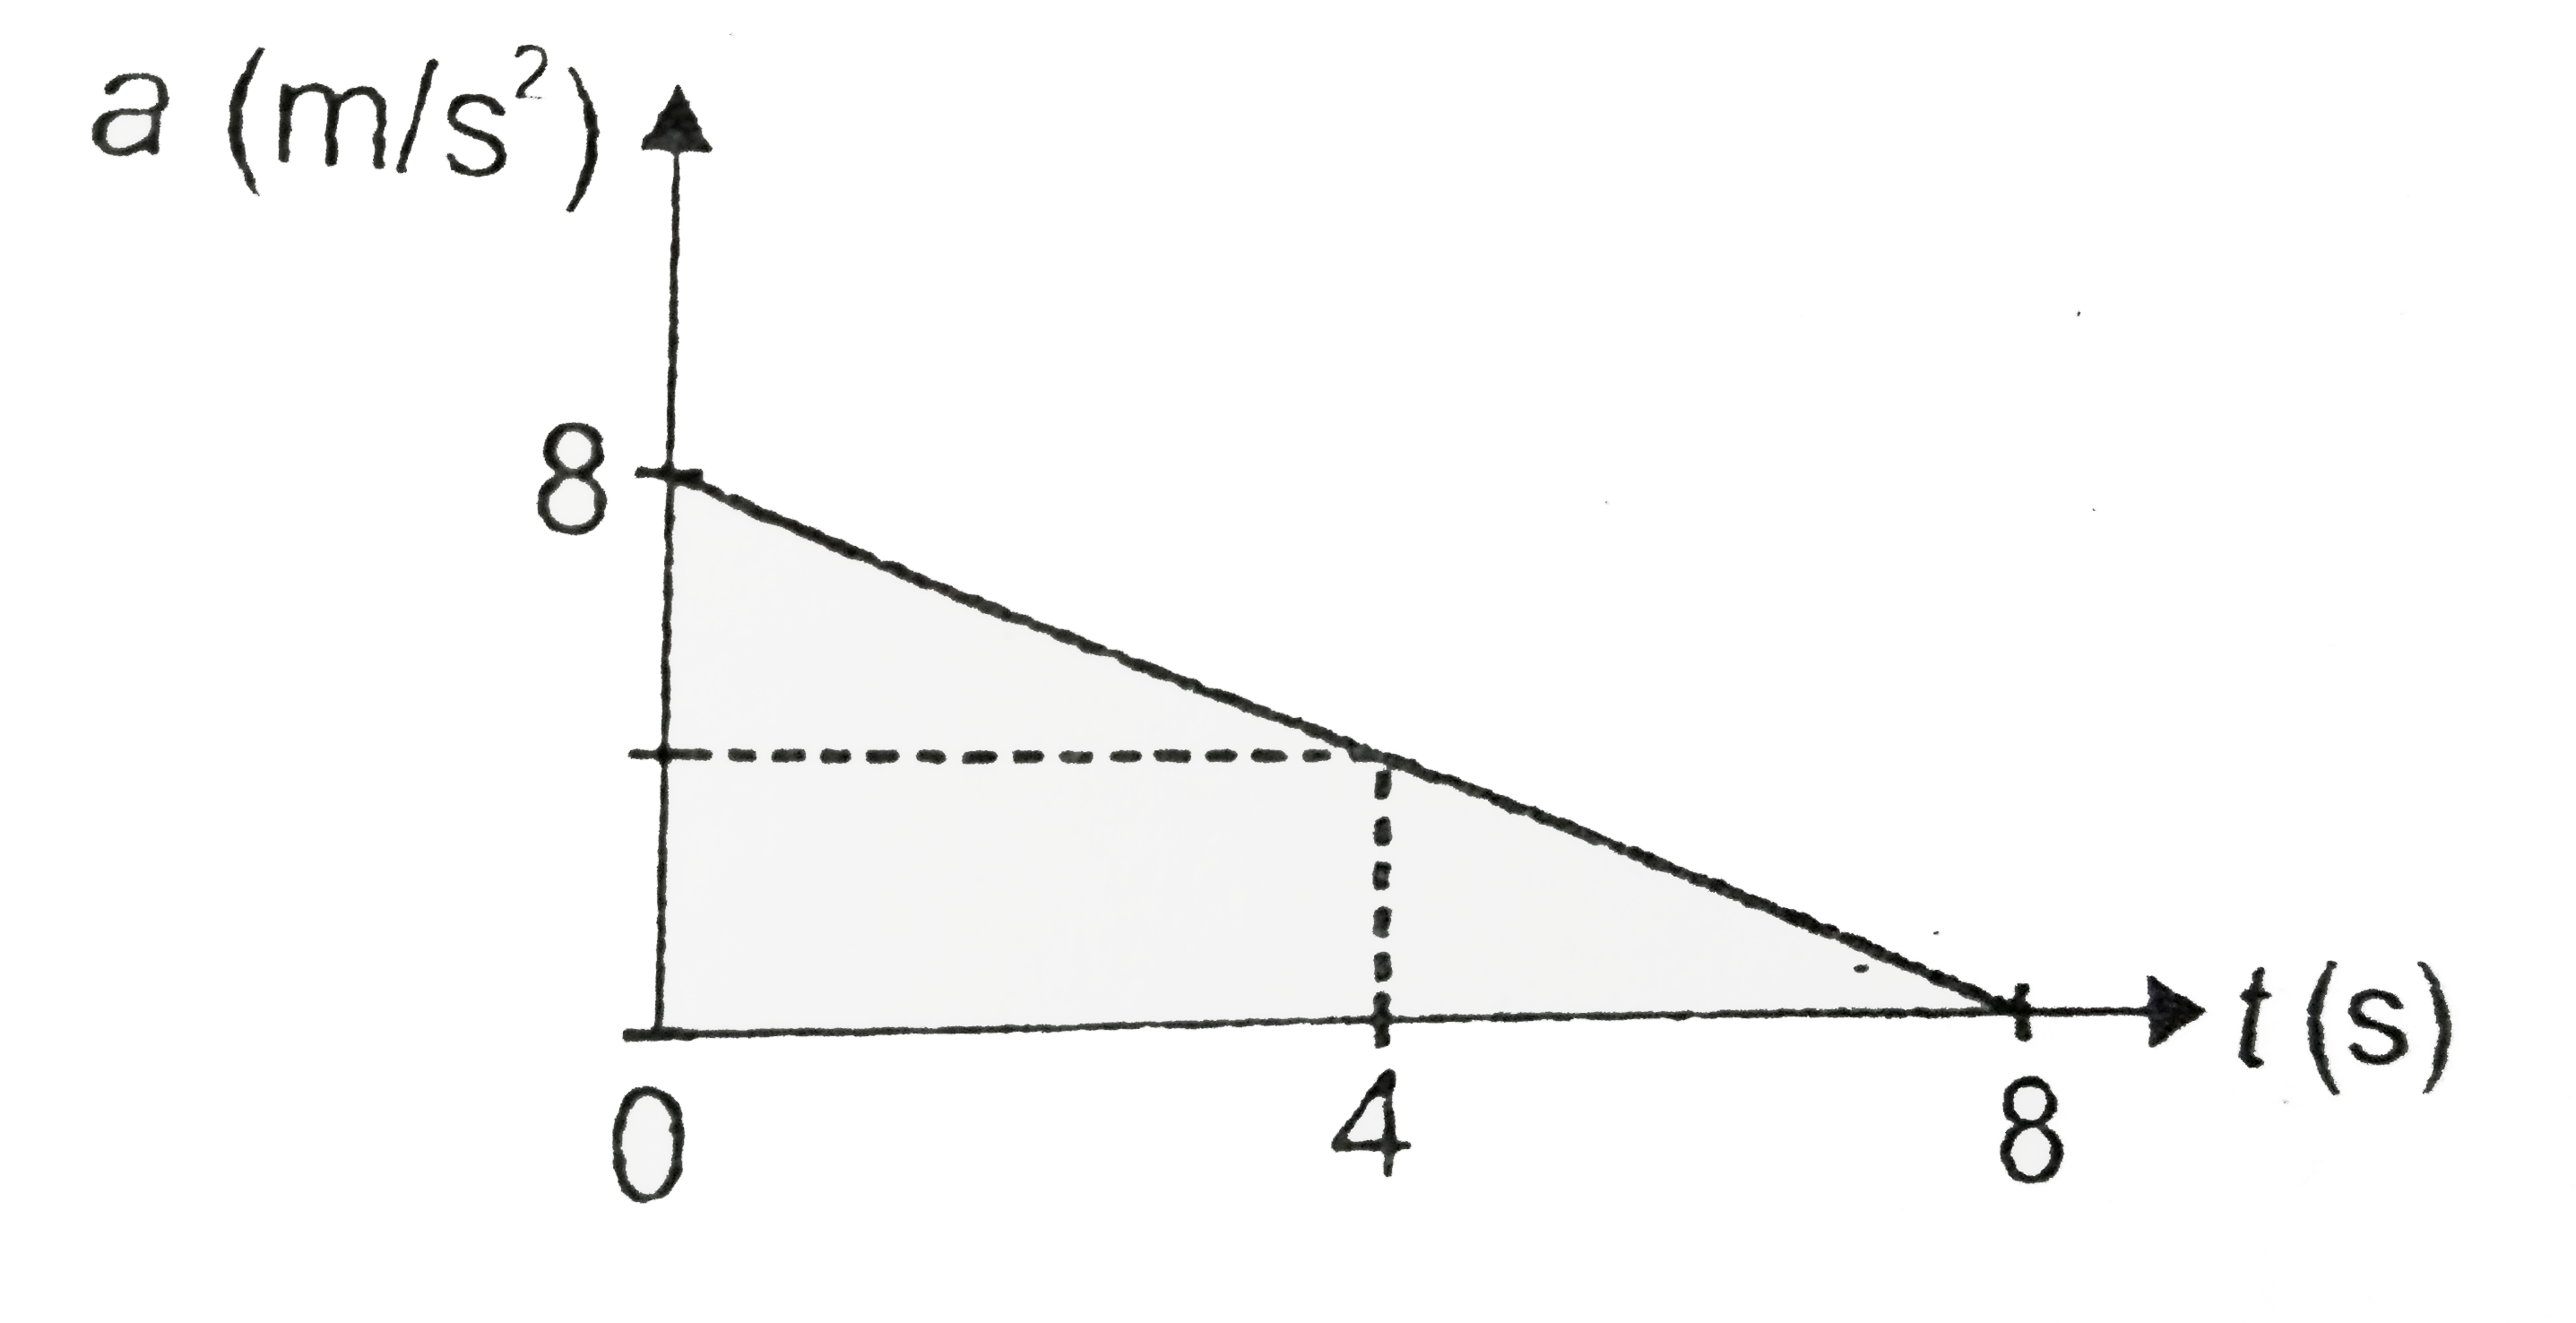
The acceleration versus time graph of a particle moving along a straight line is shown in the figure. Draw the respective velocity-time graph Given v=0 at t=0.
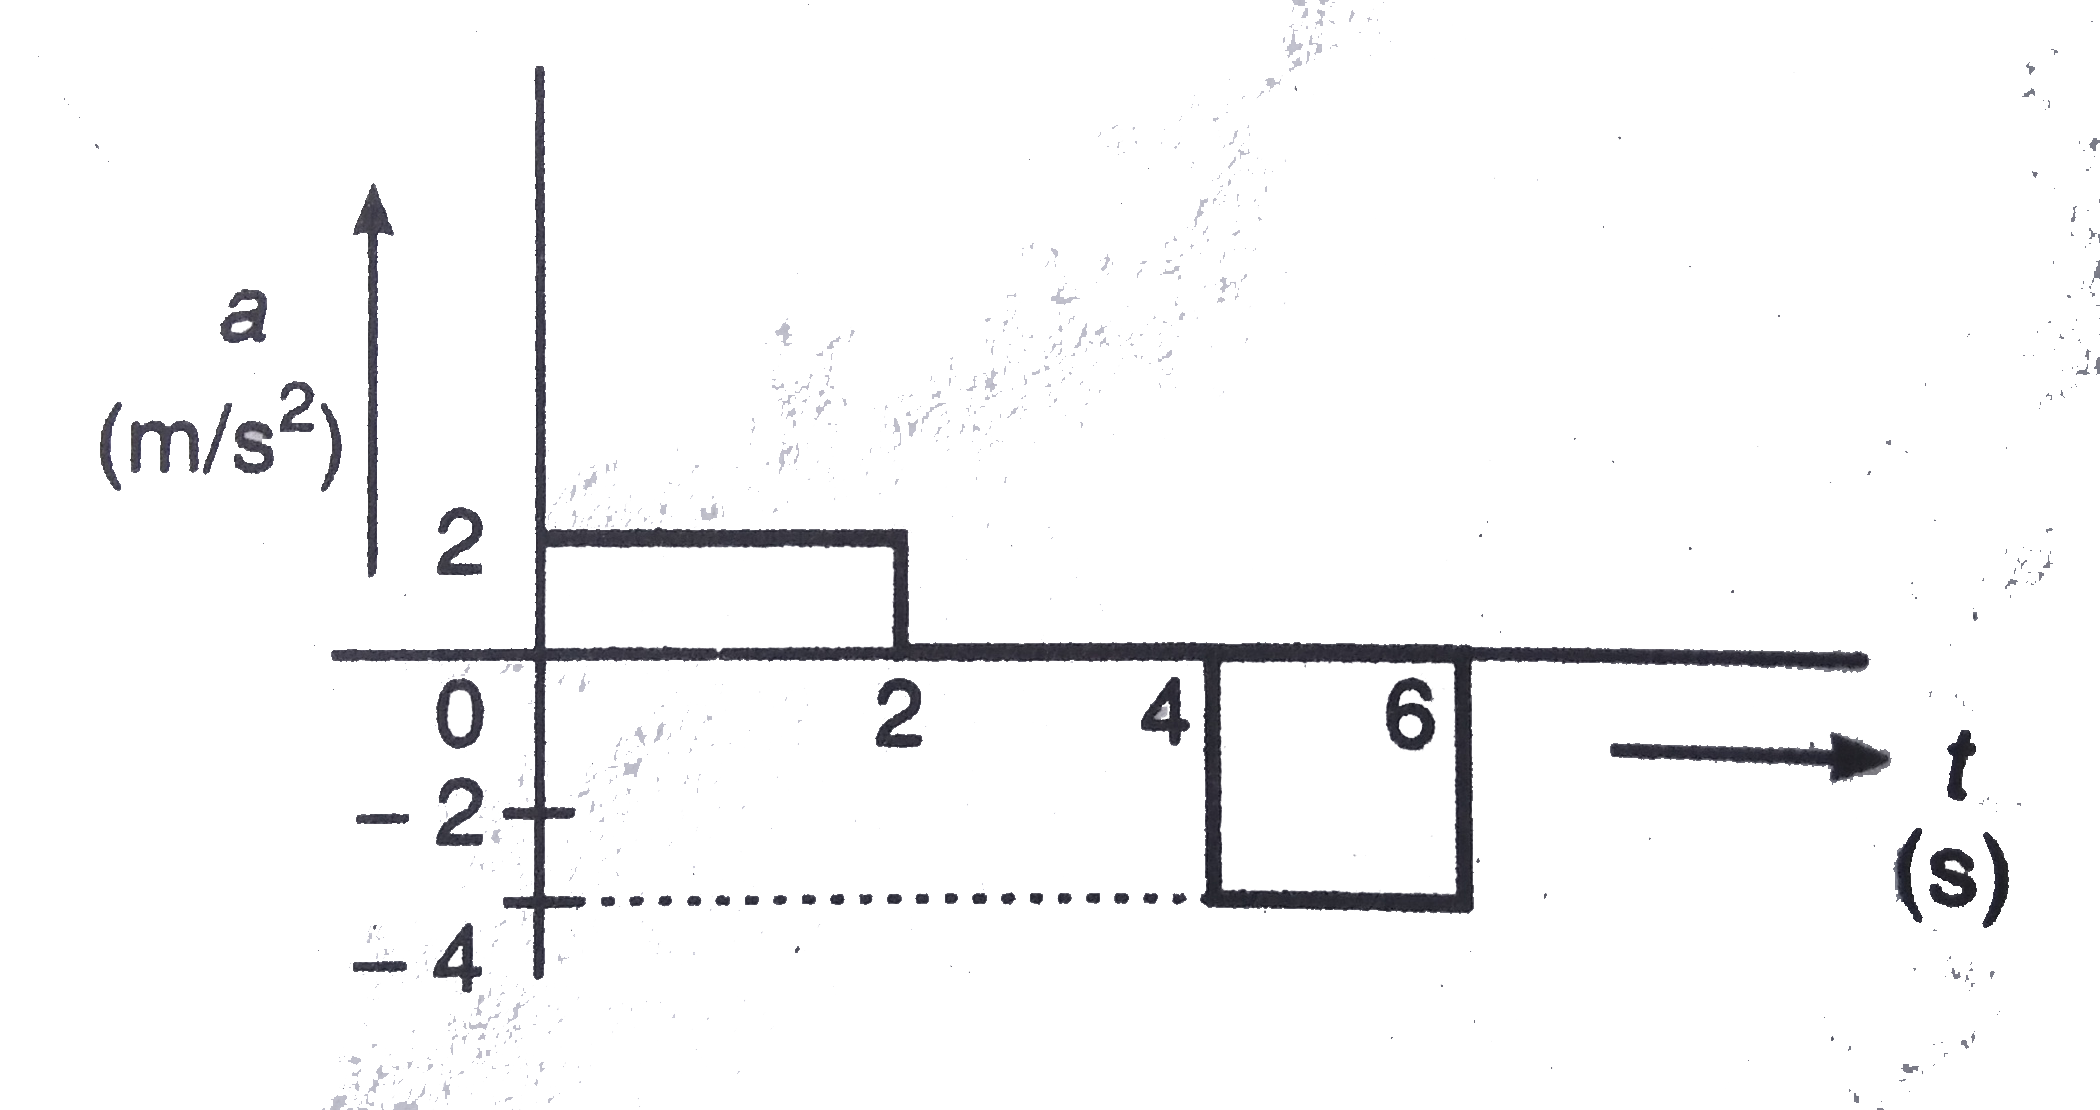
View SolutionThe acceleration-time graph of a particle moving along x-axis is shown in the figure. If the particle starts with velocity 3 m/s at t = 0, find the velocity of particle at t = 4 s.
View Solution
Knowledge Check
The acceleration versus time graph for a particle moving along a straight line is shown in the figure. If the particle starts from rest at t = 0, then its speed at t = 30 sec will be :
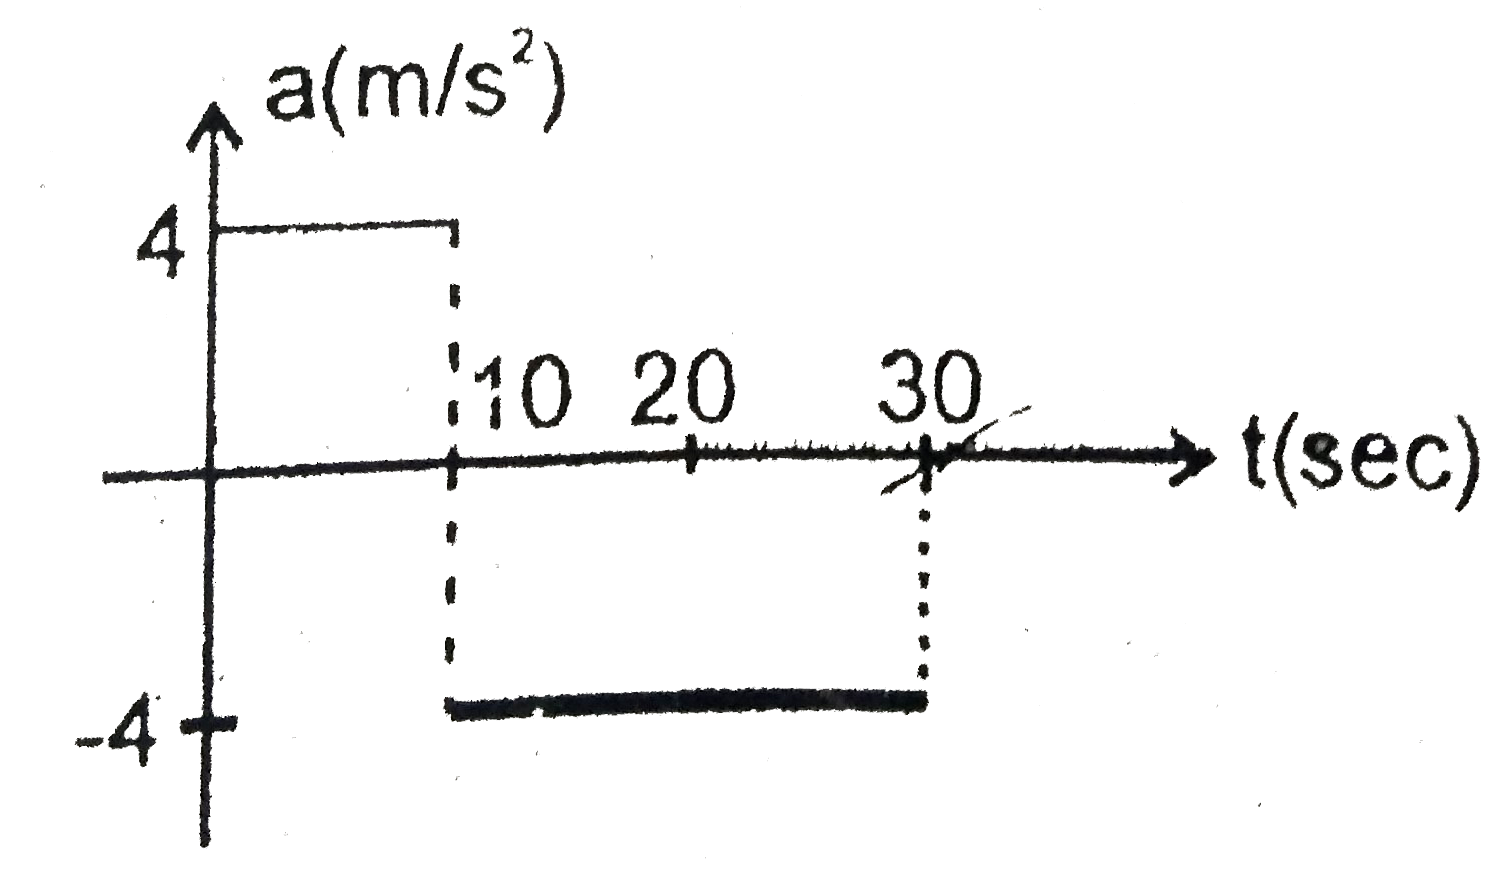 A20m/secB40m/secC0m/secD−40m/sec
Position-time graph for a particle moving along x− direction is as shown in the figure. Average speed of the particle from t=0 to t=4 is :
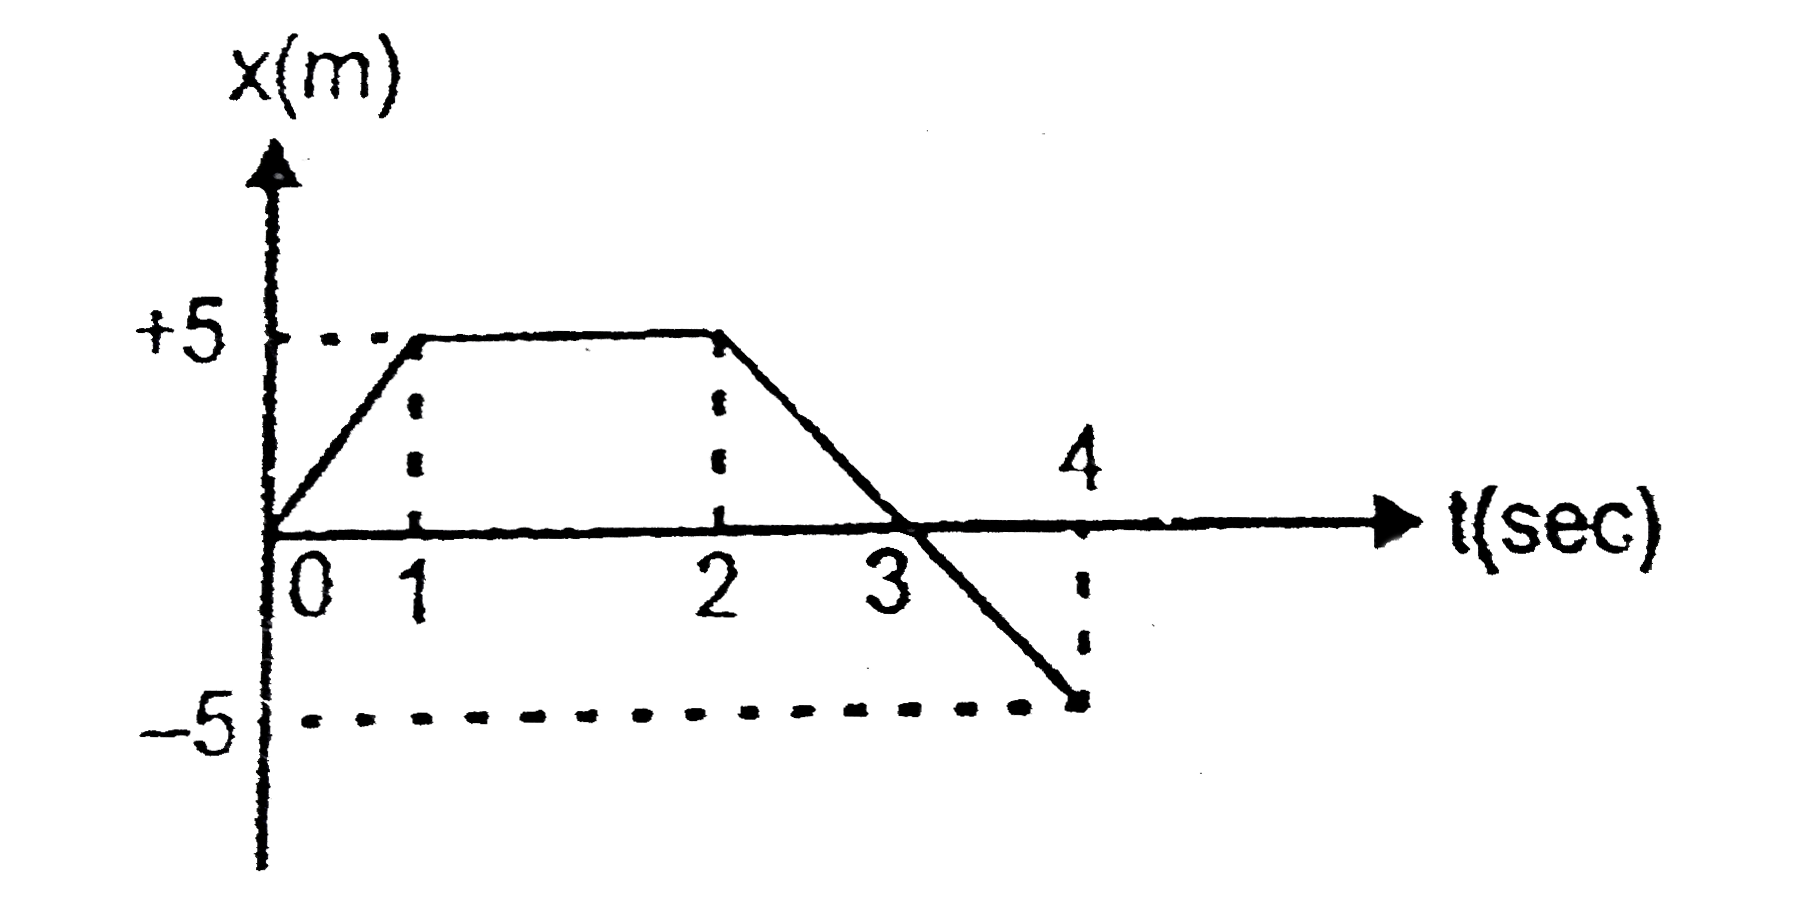 A154m/sB103m/sC52m/sD54m/s
Acceleration versus time curve for a particle moving in a straight line is shown in the figure. If particle starts from rest at t=0, then which of the following curve is correct for the same particle.
 A
A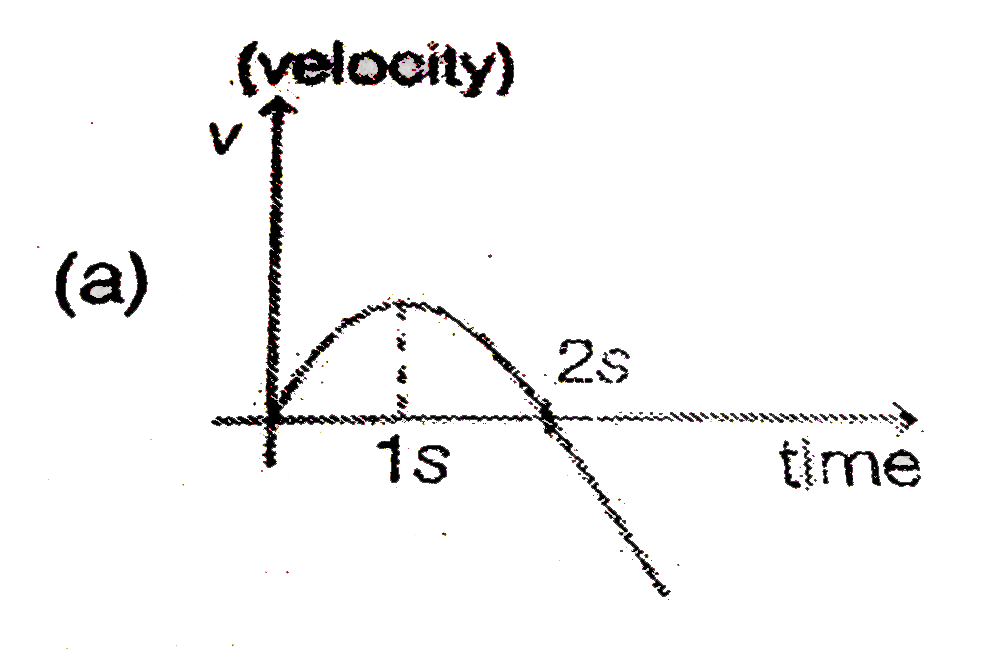 B
B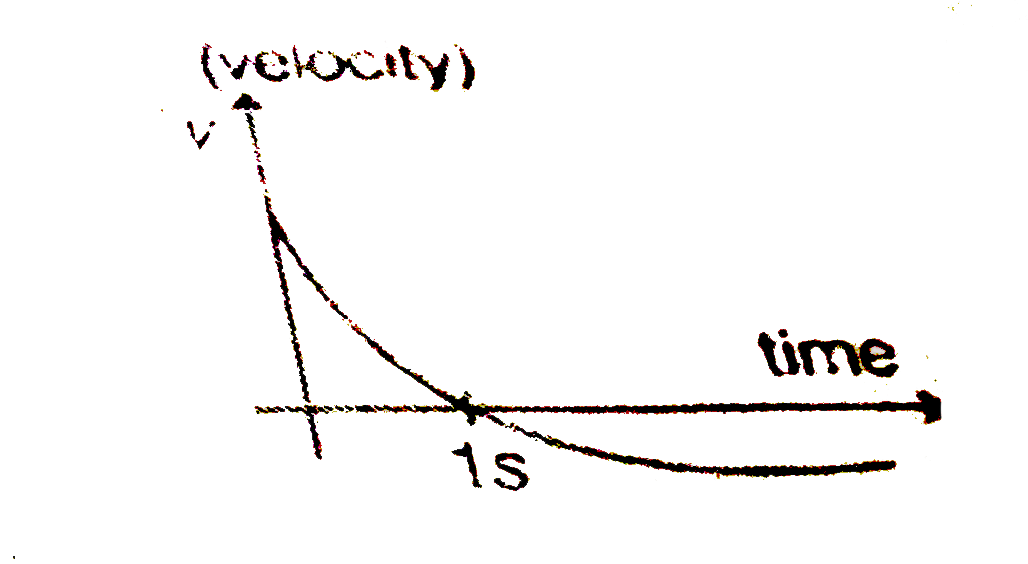 C
C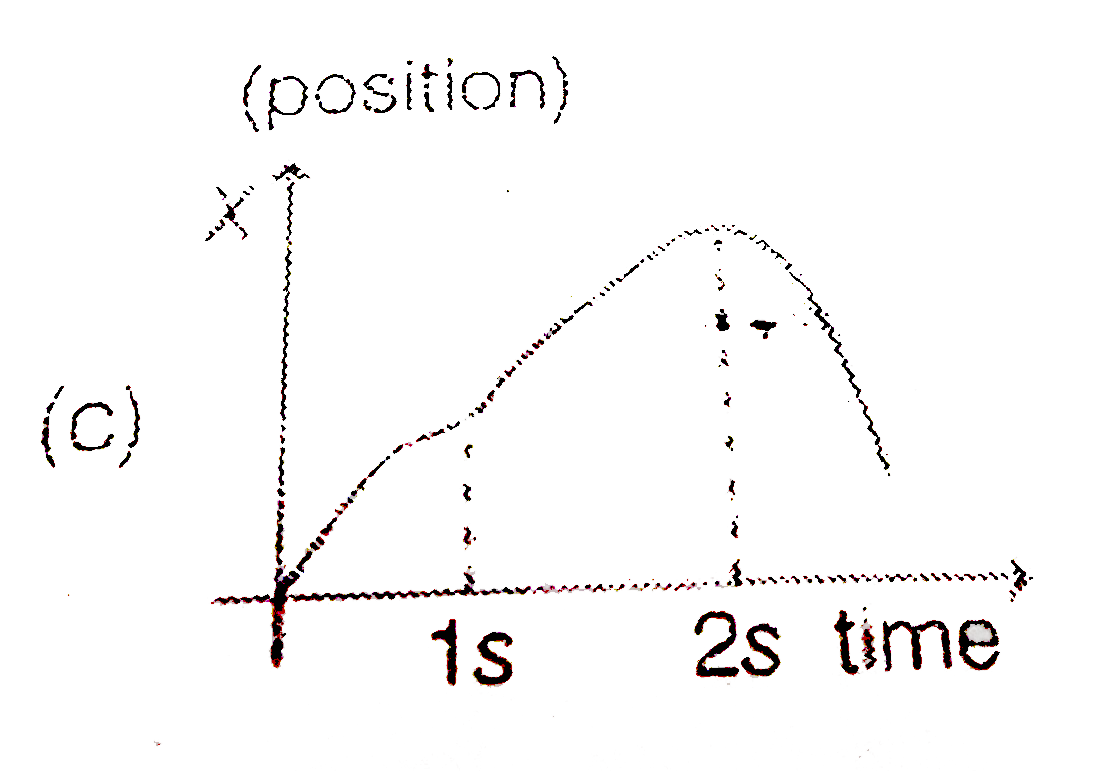 D
D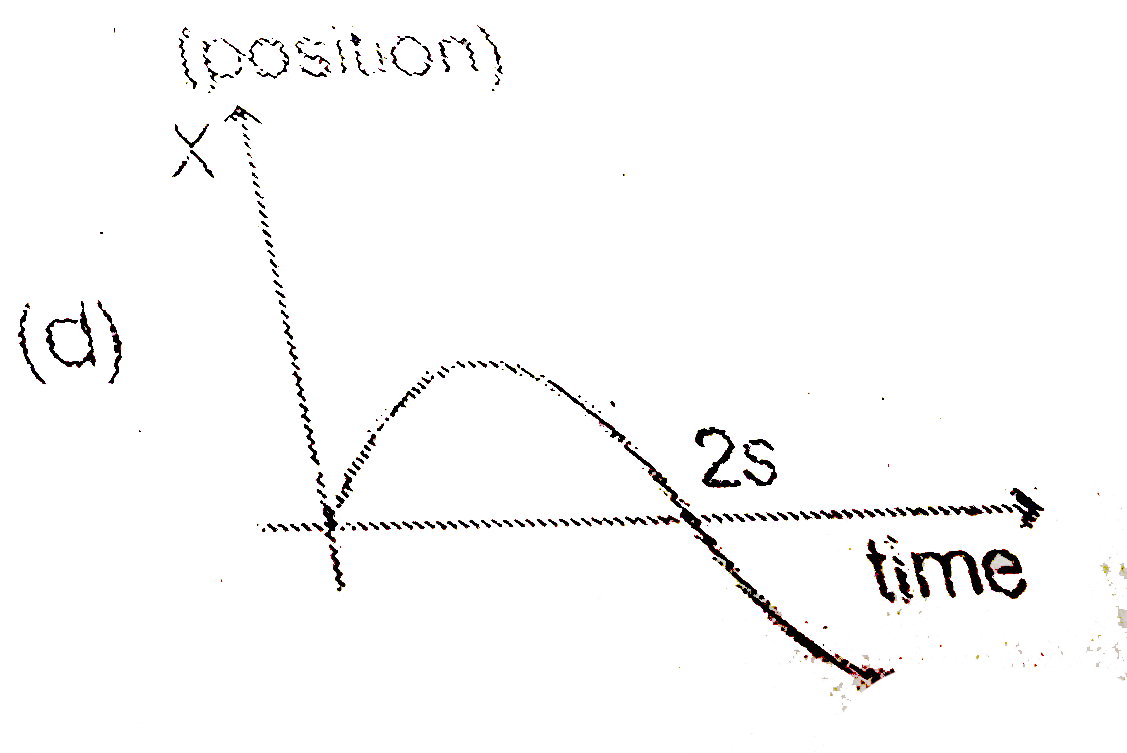
The velocity-time graph of a particle moving along a straight line is shown in Figure 2.W7.
Does the particle change its direction of motion ?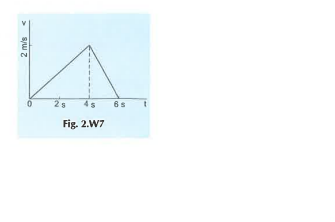
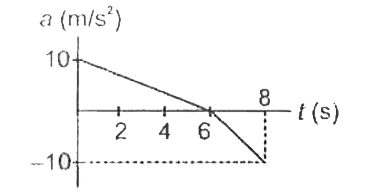
View SolutionThe acceleration - time graph for a particle moving along x - axis is shown in figure, If the initial velocity of particle is −5m/s, the velocity at t = 8 s is
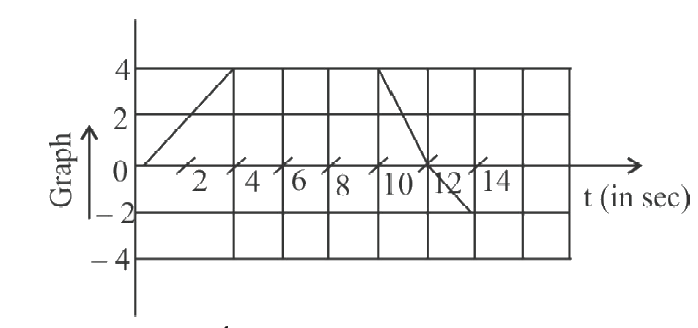
View SolutionA graph of acceleration versus time of a particle starting from rest at t=0 is as shown in figure. The speed of the particle at t=14s is
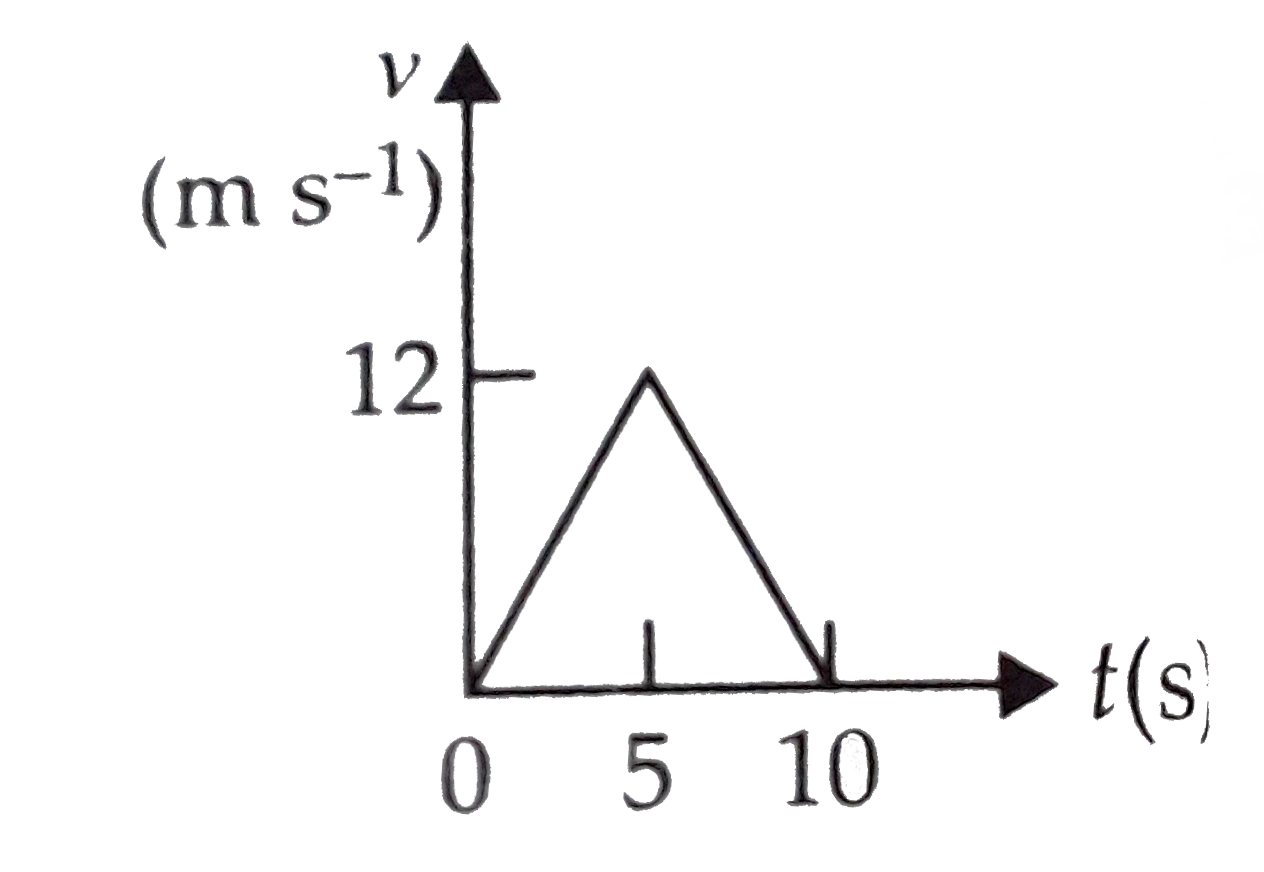
View SolutionThe speed-time graph of a particle moving along a fixed direction as shown in the figure. The distance travelled by the particle between t = 0 s to t = 10 s is
View SolutionAcceleration - time graph for a particle is given in figure. If it starts motion at t = 0, distance travelled in 3 s will be
View Solution

