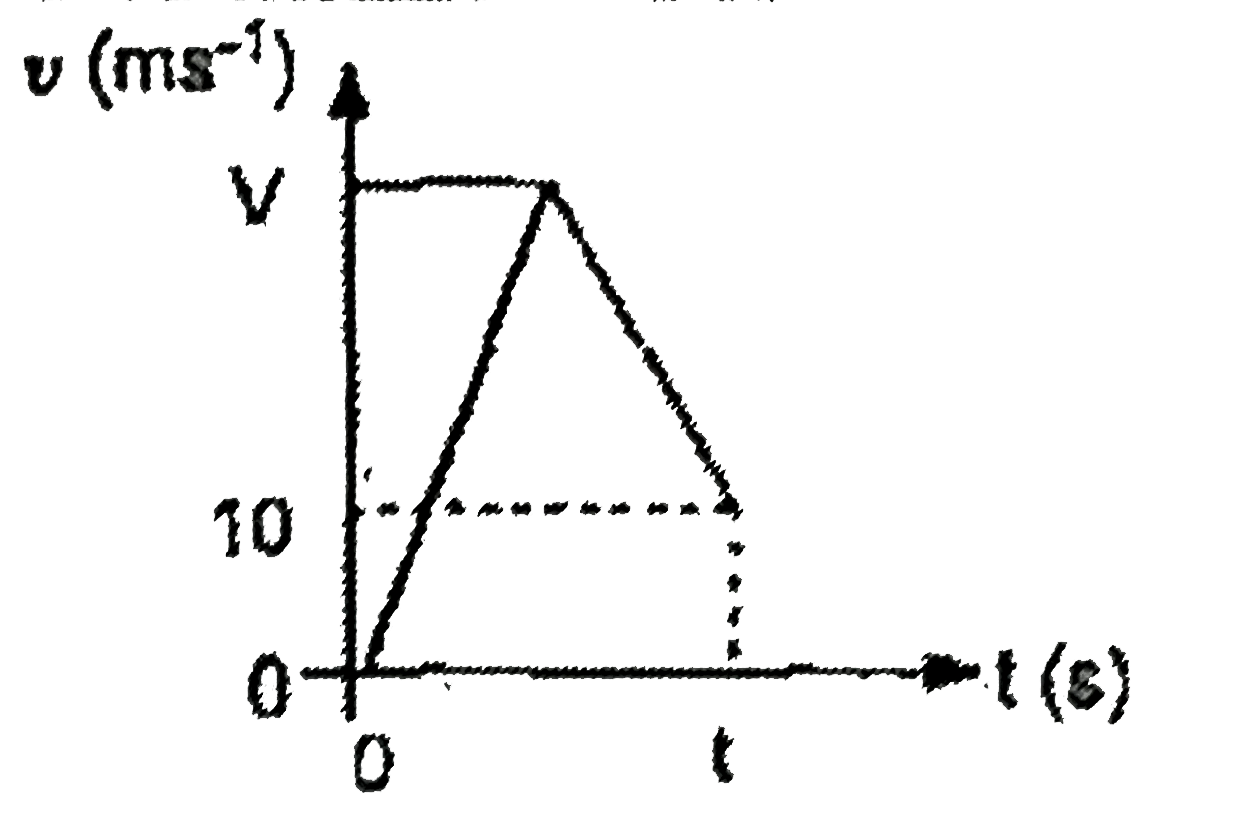
(The figure shows the (V,t) graph for the train .accelerating' ifrom resi up to a maximum speed of Vms−1. and then decelerating to a speed of 10ms−1The acceleration and deceleration. have , the same magnitude which is equal to 0.5m/s

show that the distance travelled is (2V2−100) metre
Step by step video & image solution for (The figure shows the (V,t) graph for the train .accelerating' ifrom resi up to a maximum speed of Vms-1. and then decelerating to a speed of 10ms^(-1)The acceleration and deceleration. have , the same magnitude which is equal to 0.5 m//s show that the distance travelled is (2V^(2)-100) metre by Physics experts to help you in doubts & scoring excellent marks in Class 11 exams.
Updated on:21/07/2023Topper's Solved these Questions
- DESCRIPTION OF MOTIONBook:ANURAG MISHRAChapter:DESCRIPTION OF MOTIONExercise:Level-1
Explore 86 Videos
- DESCRIPTION OF MOTIONBook:ANURAG MISHRAChapter:DESCRIPTION OF MOTIONExercise:Level-2
Explore 25 Videos
- DESCRIPTION OF MOTIONBook:ANURAG MISHRAChapter:DESCRIPTION OF MOTIONExercise:Level-3
Explore 34 Videos
- FORCE ANALYSISBook:ANURAG MISHRAChapter:FORCE ANALYSISExercise:Matching type
Explore 13 Videos
Similar Questions
A car starts from rest and accelerates uniformly to a speed 50ms−1 over a distance of 250m . The speed of car is increased to 60ms−1 within 10s,if the acceleration is further increased. Find this acceleration and the distance travelled by car in 10s .
View SolutionA motor cycle moving with a speed of 5m/s is subjected to an acceleration of 0.2m/s2. Calculate the speed of the motor cycle after 10 second, and the distance travelled in this time.
View Solution
Knowledge Check
A particle executing SHM has a maximum speed of 0.5ms−1 and maximum acceleration of 1.0ms−2. The angular frequency of oscillation is
A2 rad s−1B0.5 rad s−1C2π rad s−1D0.5π rad s−1An automobile can accelerate or decelerated at a maximum value of 5m/s2 and can attain a maximum speed of 90kmhr. It it starts from rest. What is the shortest time in which can travel 80 metre. If it is comes to rest at the end of the 80 metre run ?
A4secB8secC16secD32secThe velocity- time graph of the particle moving along a straight line is shown. The rate of acceleration and deceleration is constant and it is equal to 5ms−2. If the average velocity during the motion is 20ms−1, then the value of t is
 A3 secB5 secC10 secD12 sec
figure
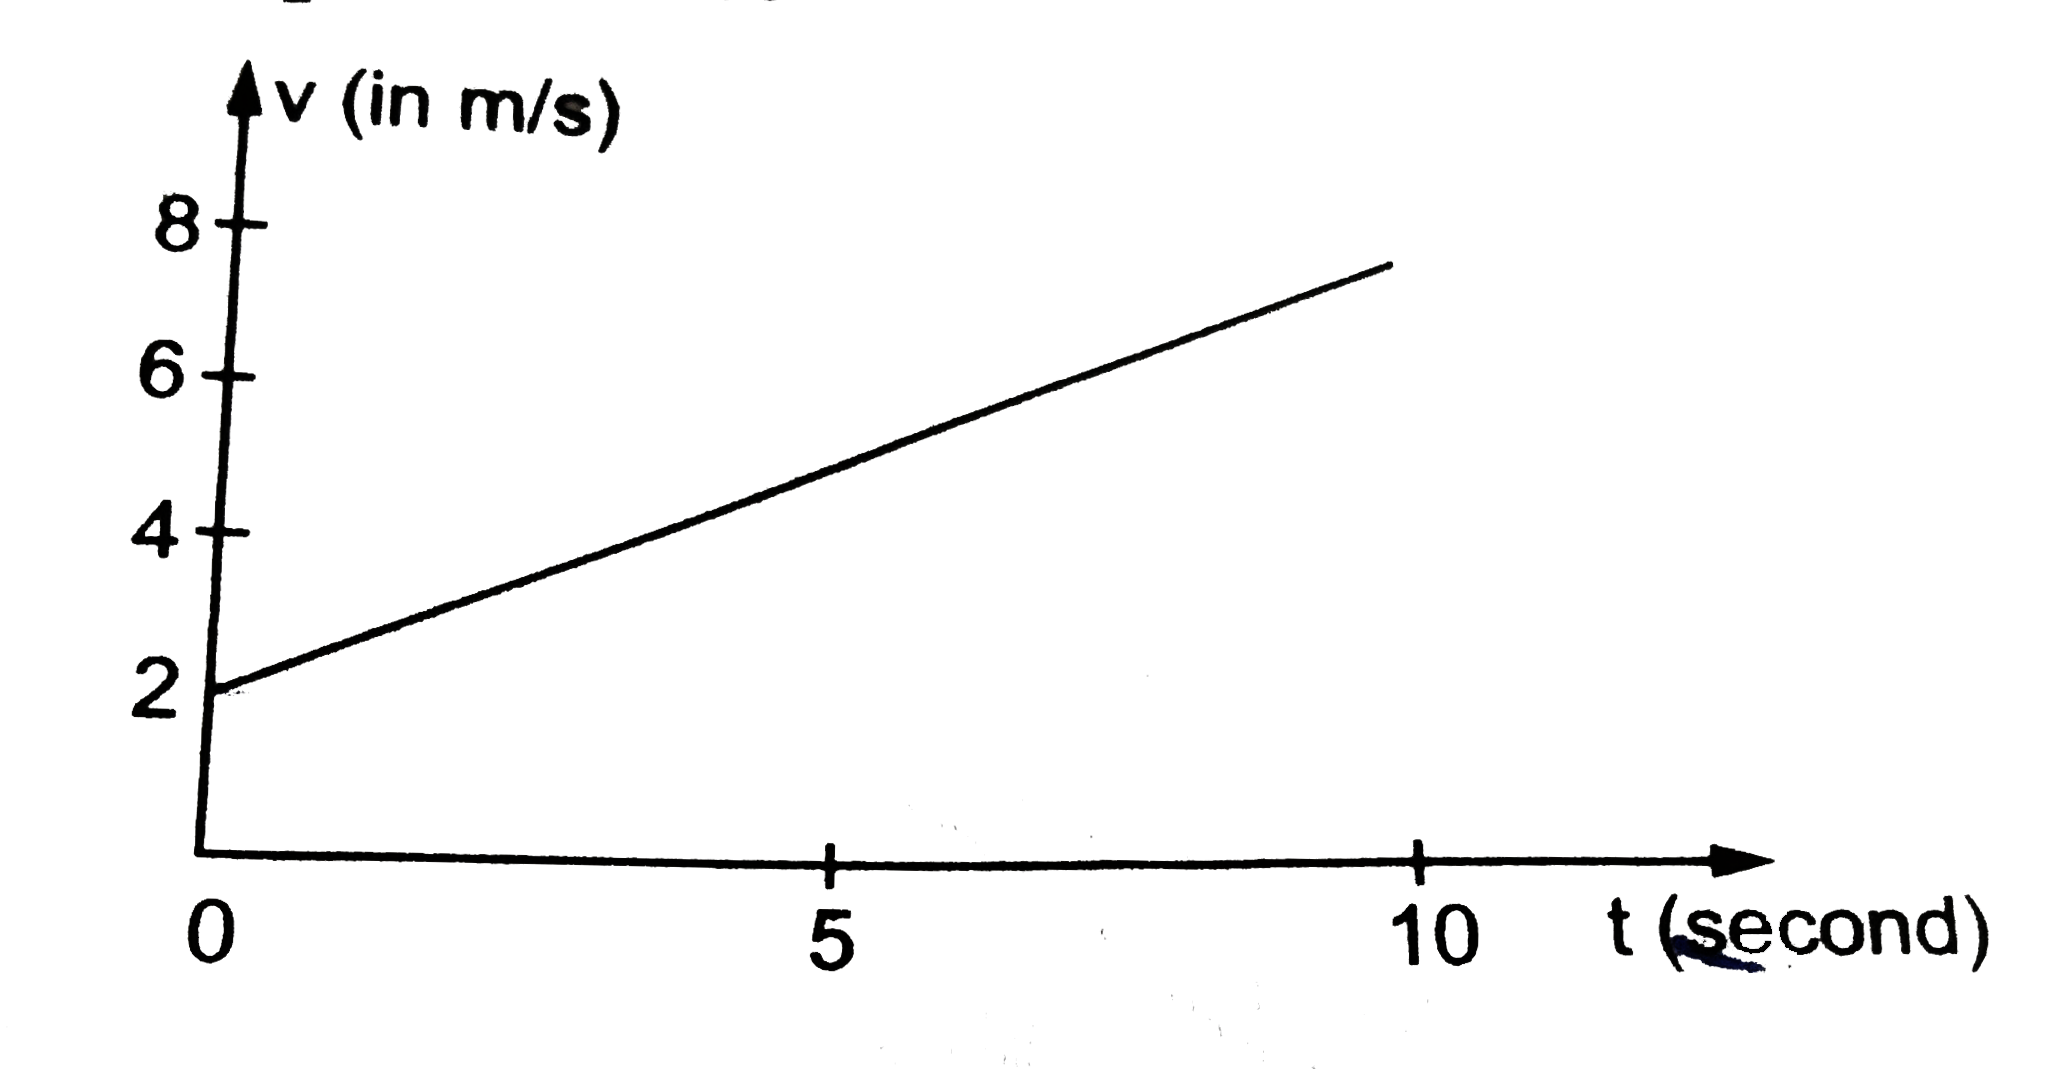
 shows the graph of velocity versus tie for a particle going along the X-axis. Find a. the acceleration, b. The distance travelled in 0 to 10 s and c. the displacement in 0 to 10 s.
View SolutionA particle is moving on a circular path of 10 m radius. At any instant of time, its speed is 5ms−1 and the speed is increasing at a rate of 2 m s2. The magnitude of net acceleration at this instant is
View SolutionThe velocity-time graph of a particle moving along a straight line is shown is Fing. The rate of acceleration and deceleration is constant and it is equal to 5ms−2. If the a average velocity during the motion is 20ms−1, Then
 .
.
The distace travelled with uniform velcoty is .
View SolutionA car is travelling on a straight road. The maximum velocity the car Can attain is 24ms−1. The maximum acceleration and deceleration it can attain are 1ms−2 and 4ms−2 respectively. The shortest time the car takes from rest to rest in a distance of 200 m is,
View SolutionA particle is moving on a circular path of 10 m radius. At any instant of time, its speed is 5ms−1 and the speed is increasing at a rate of 2ms−2. At this instant, the magnitude of the net acceleration will be
View Solution

