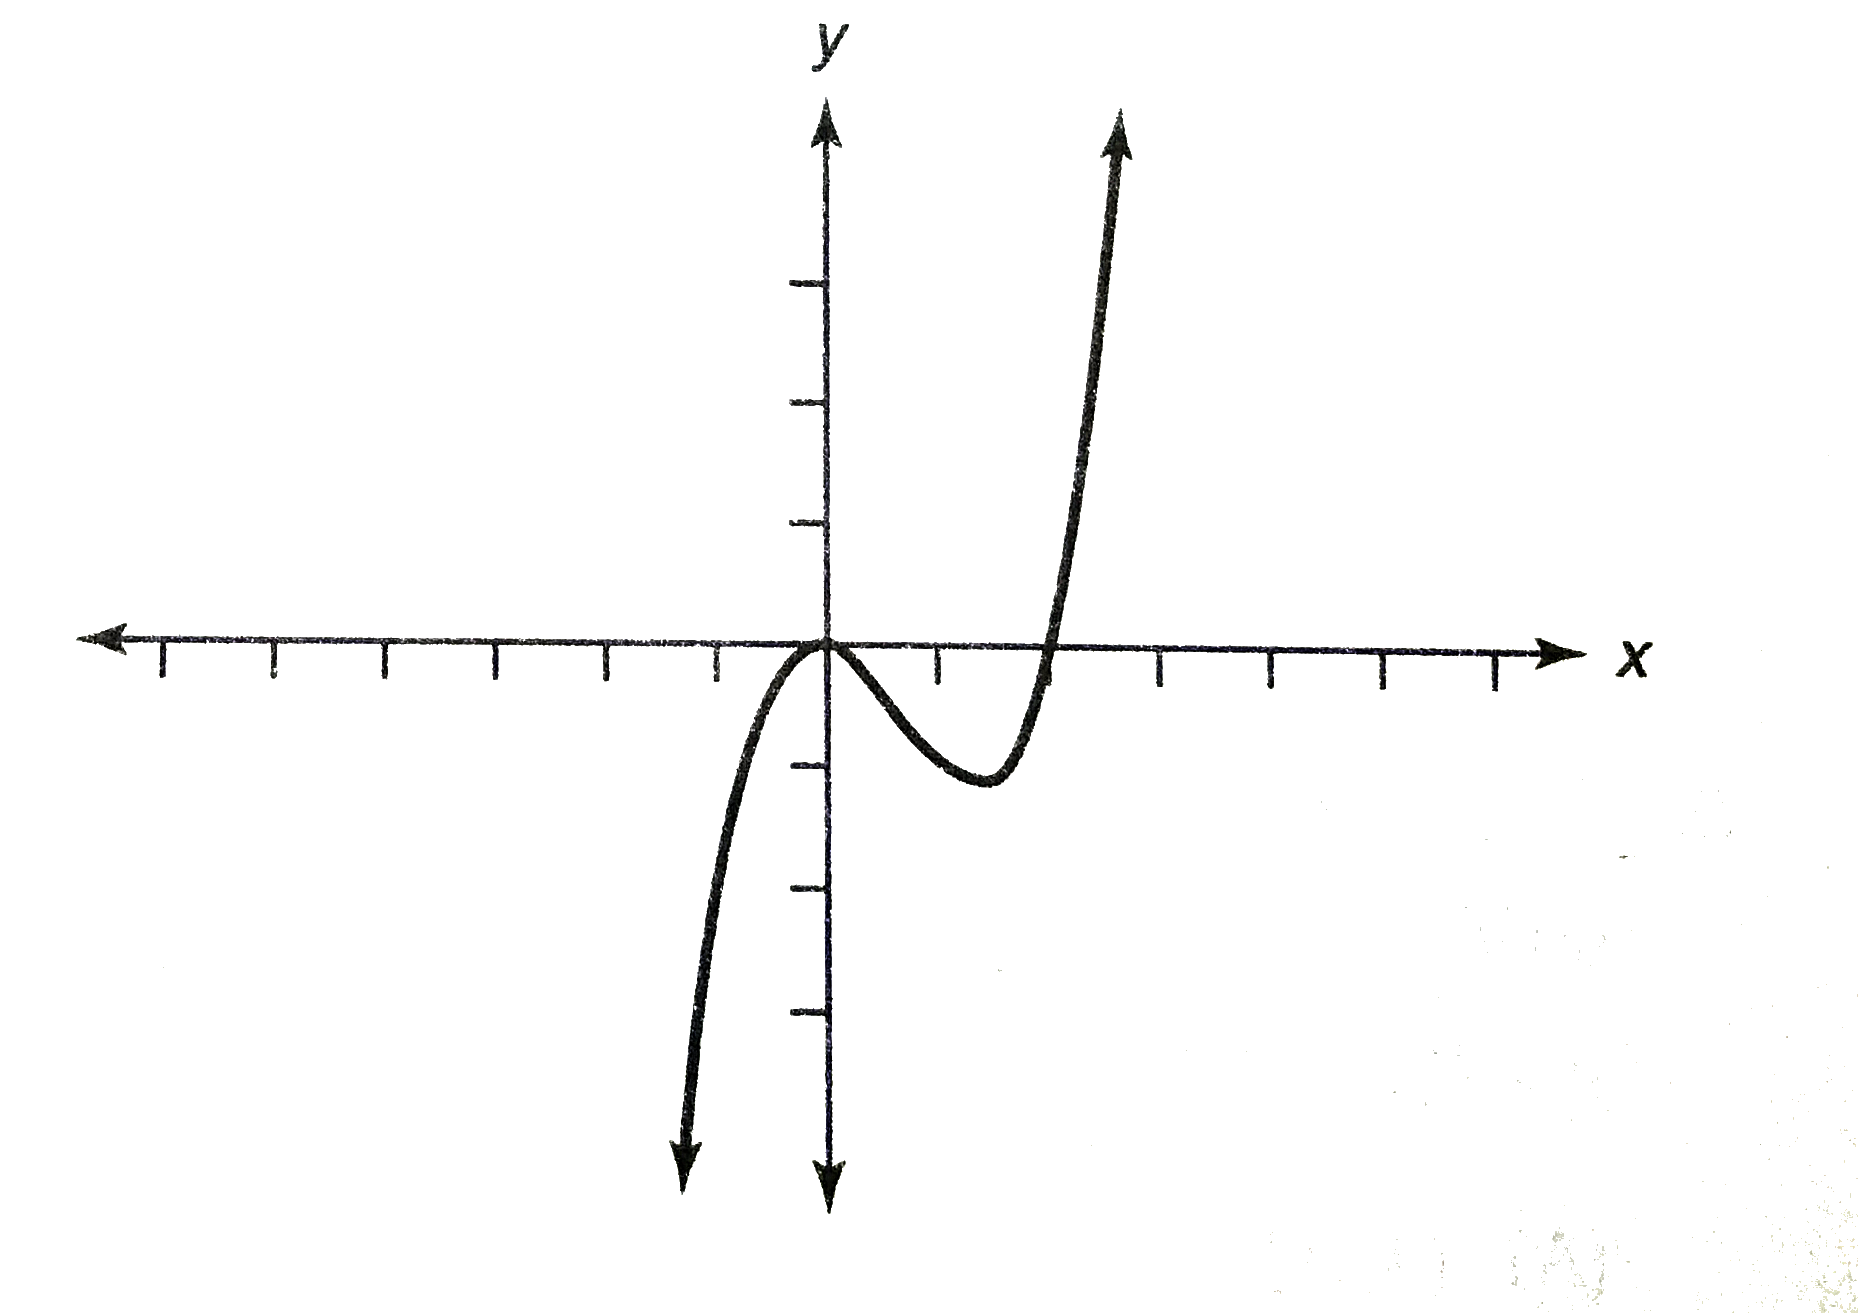
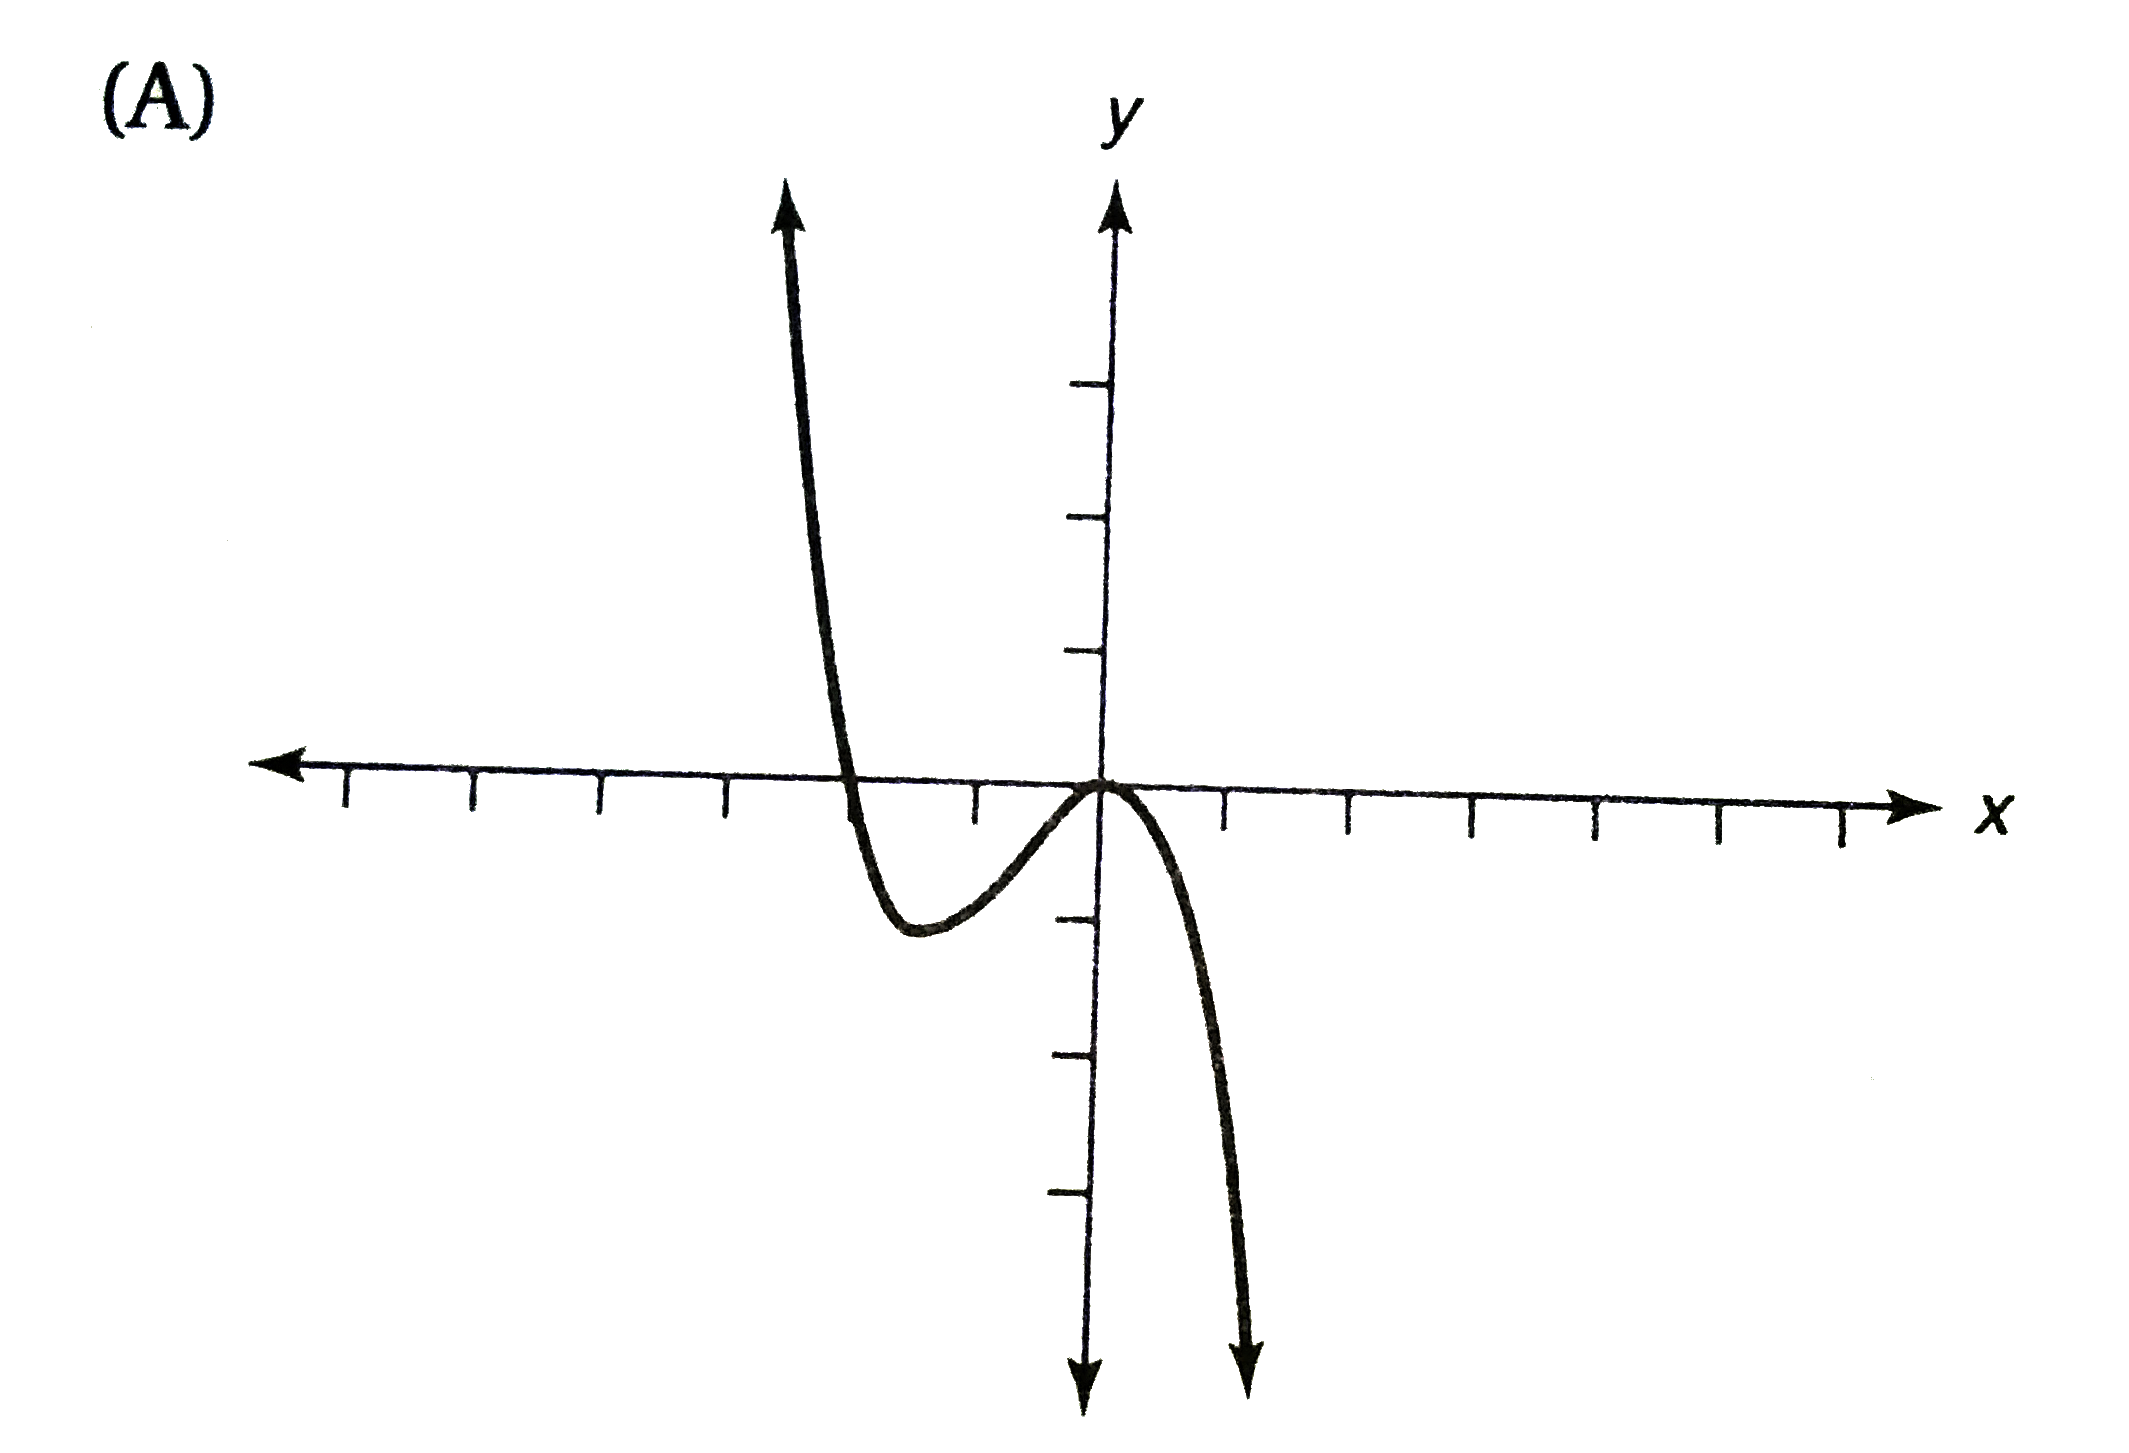
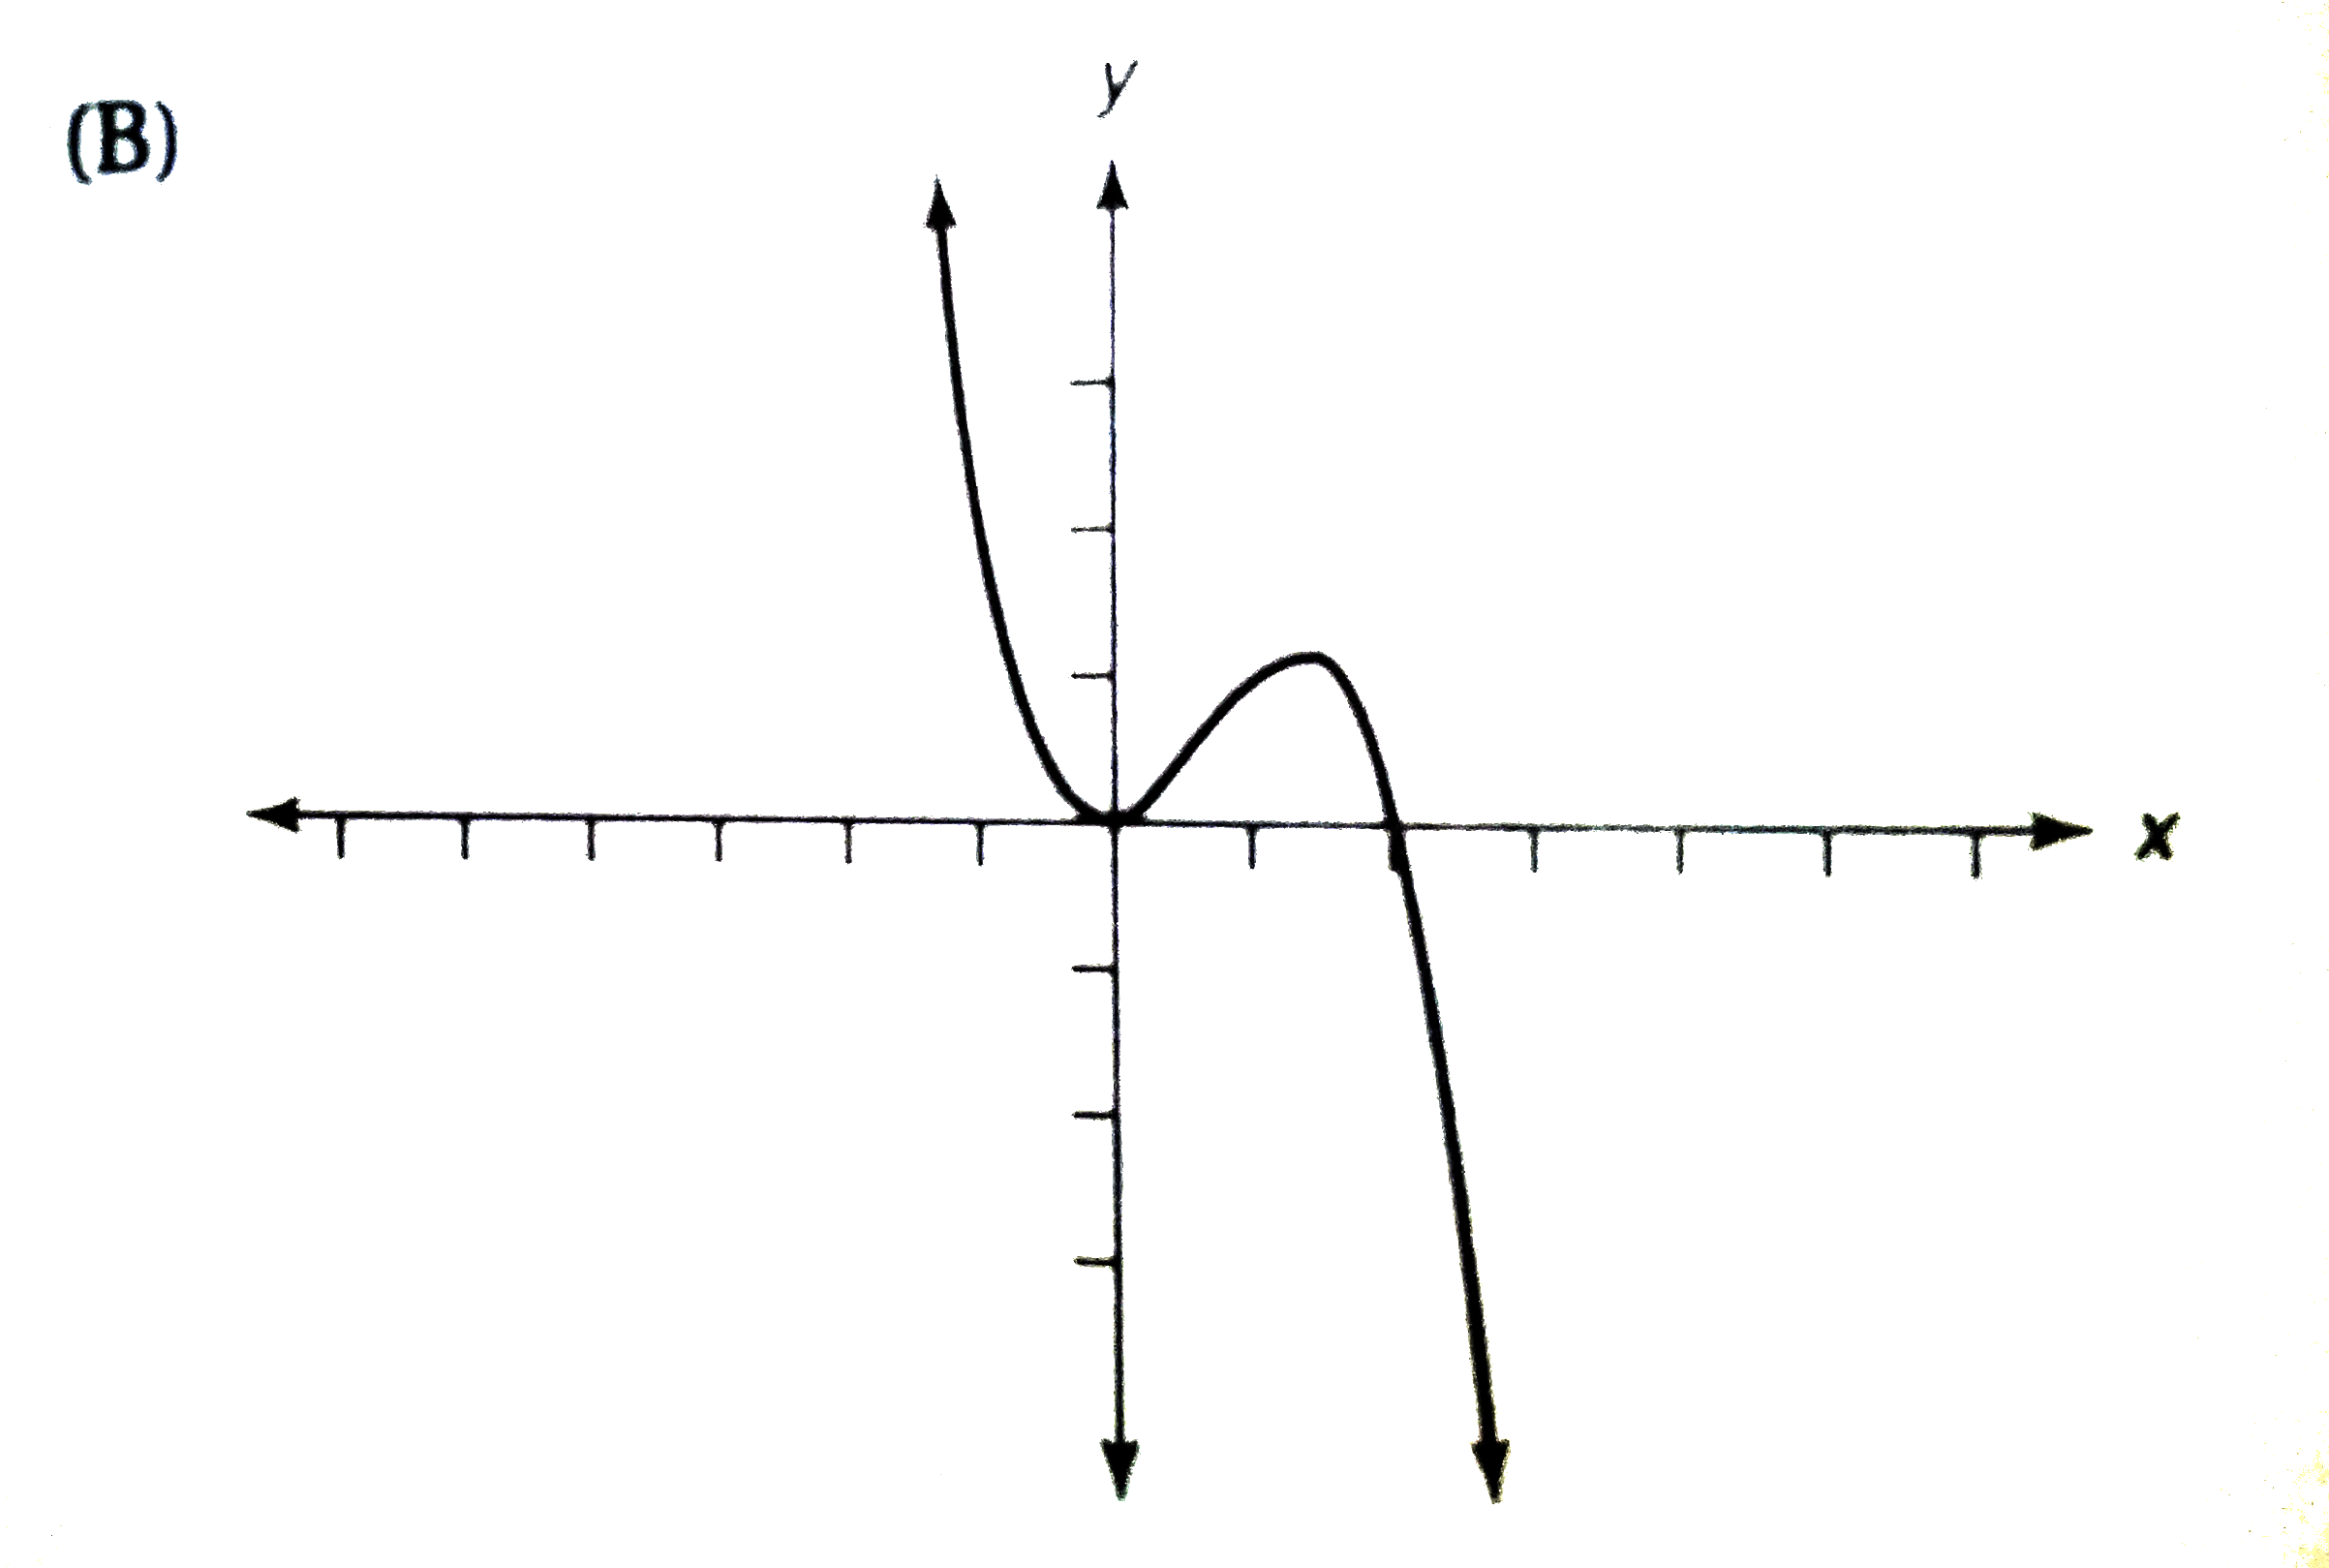
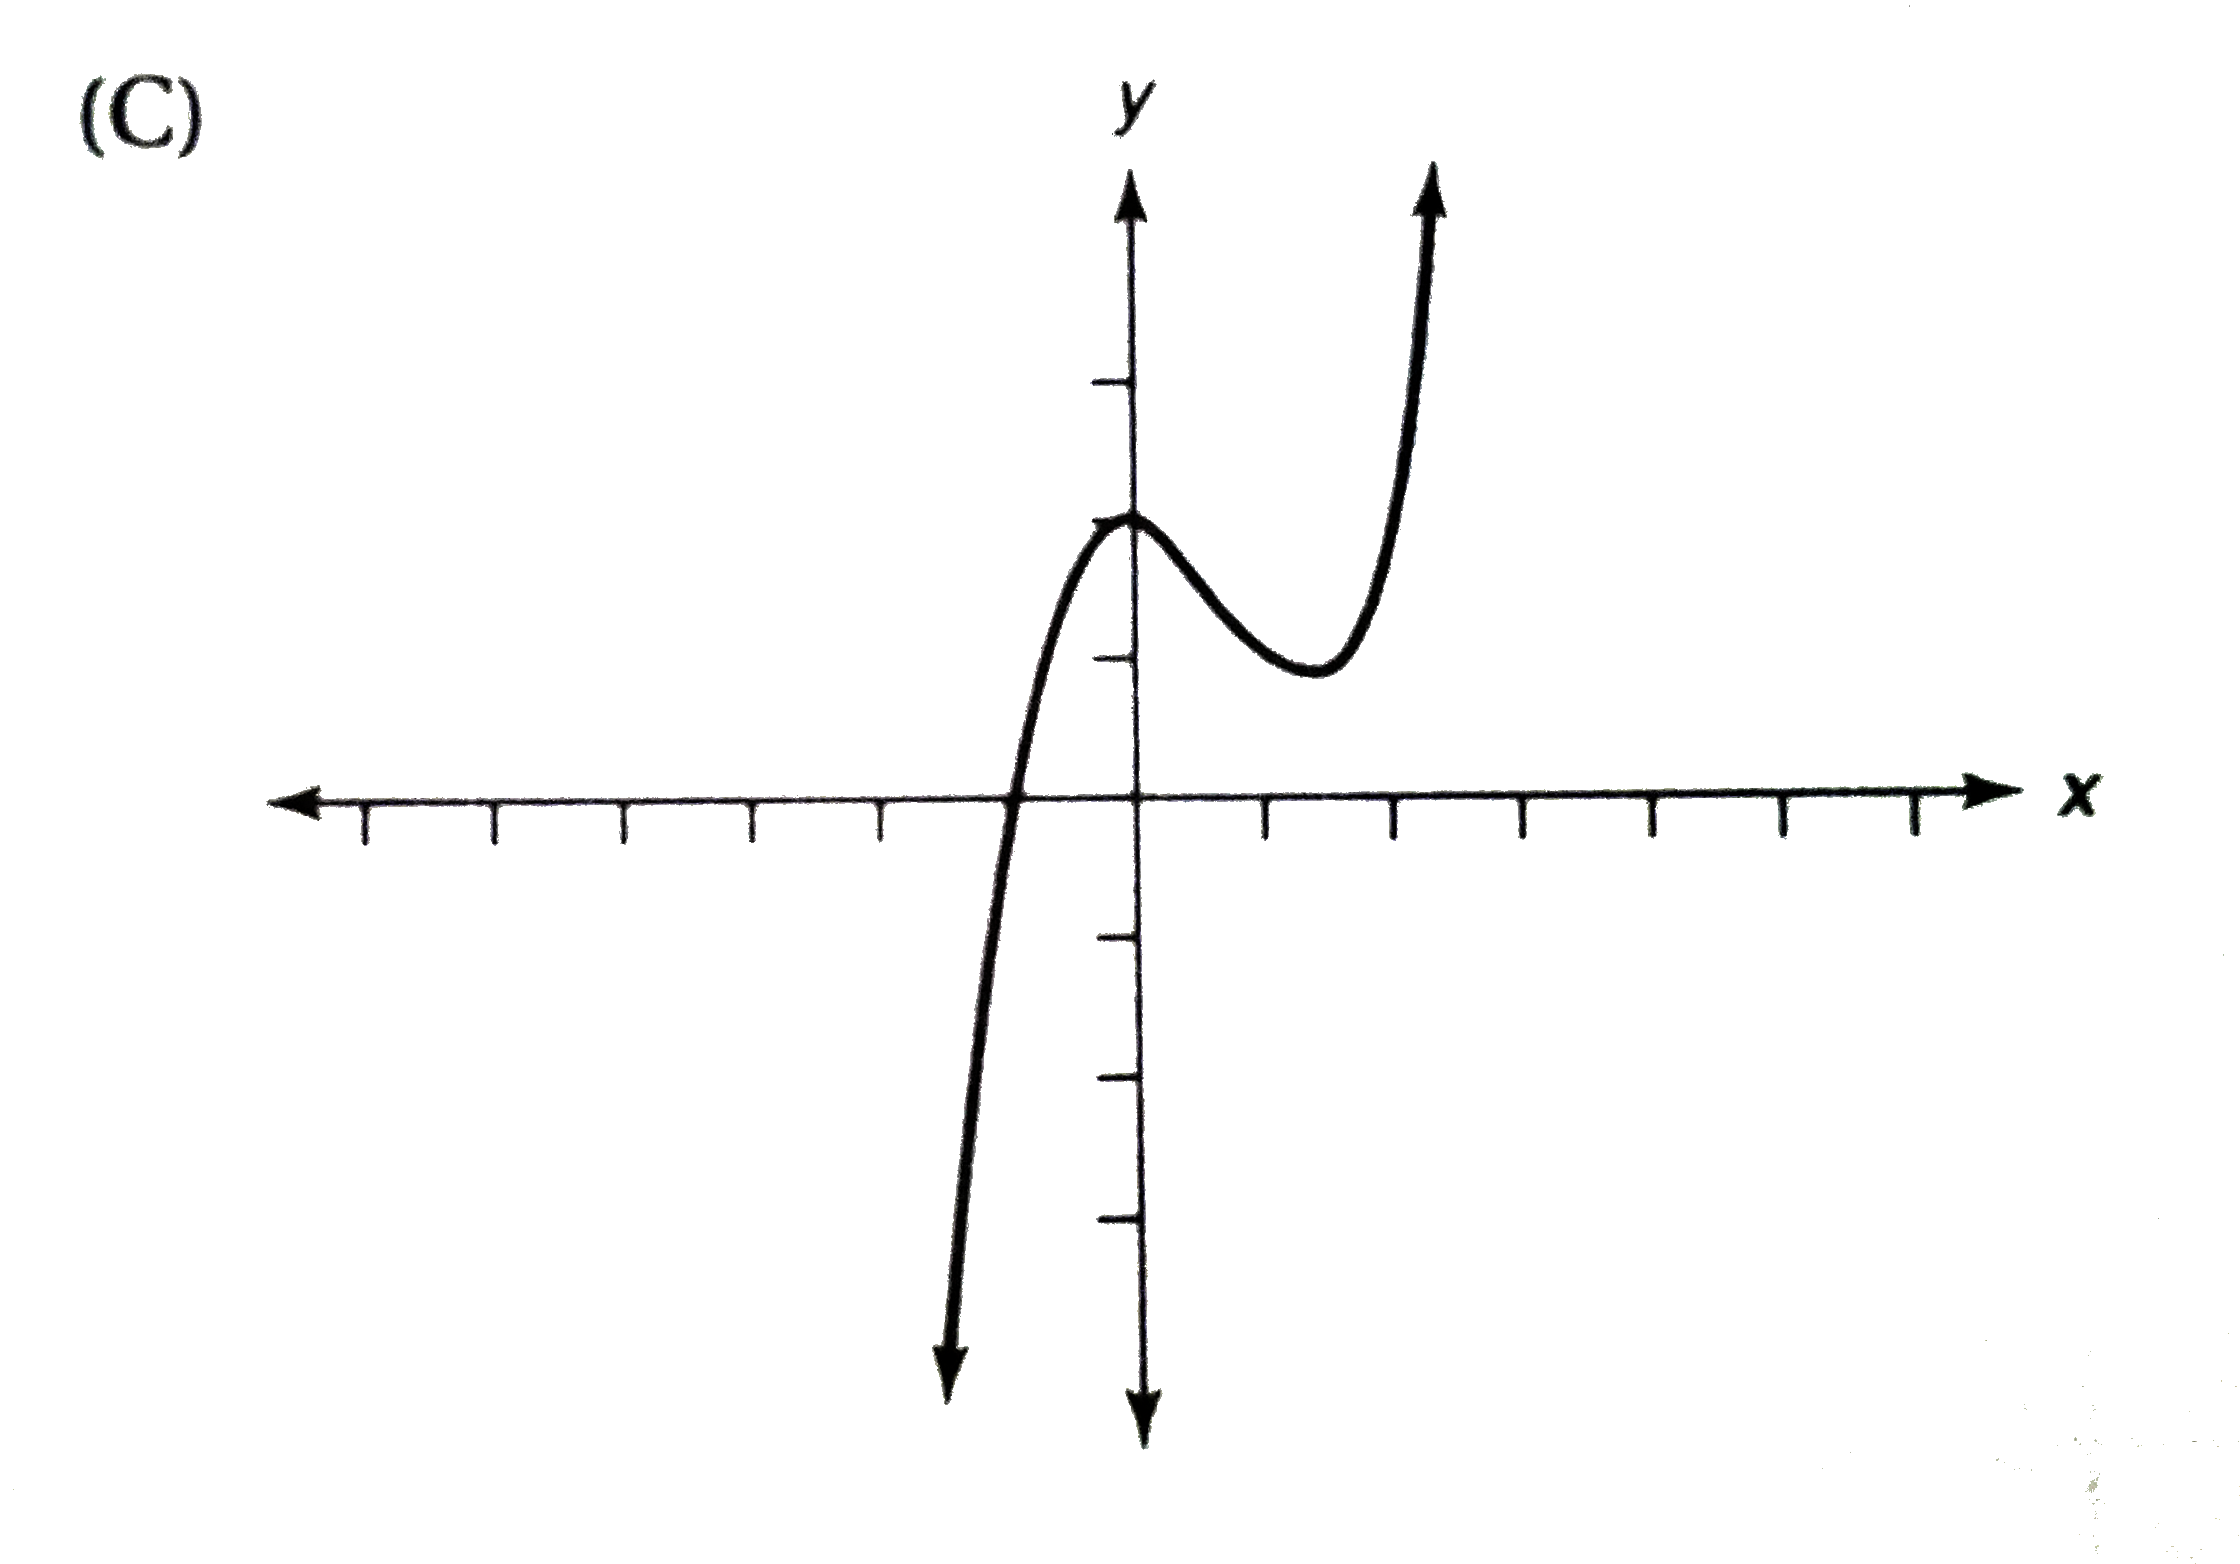
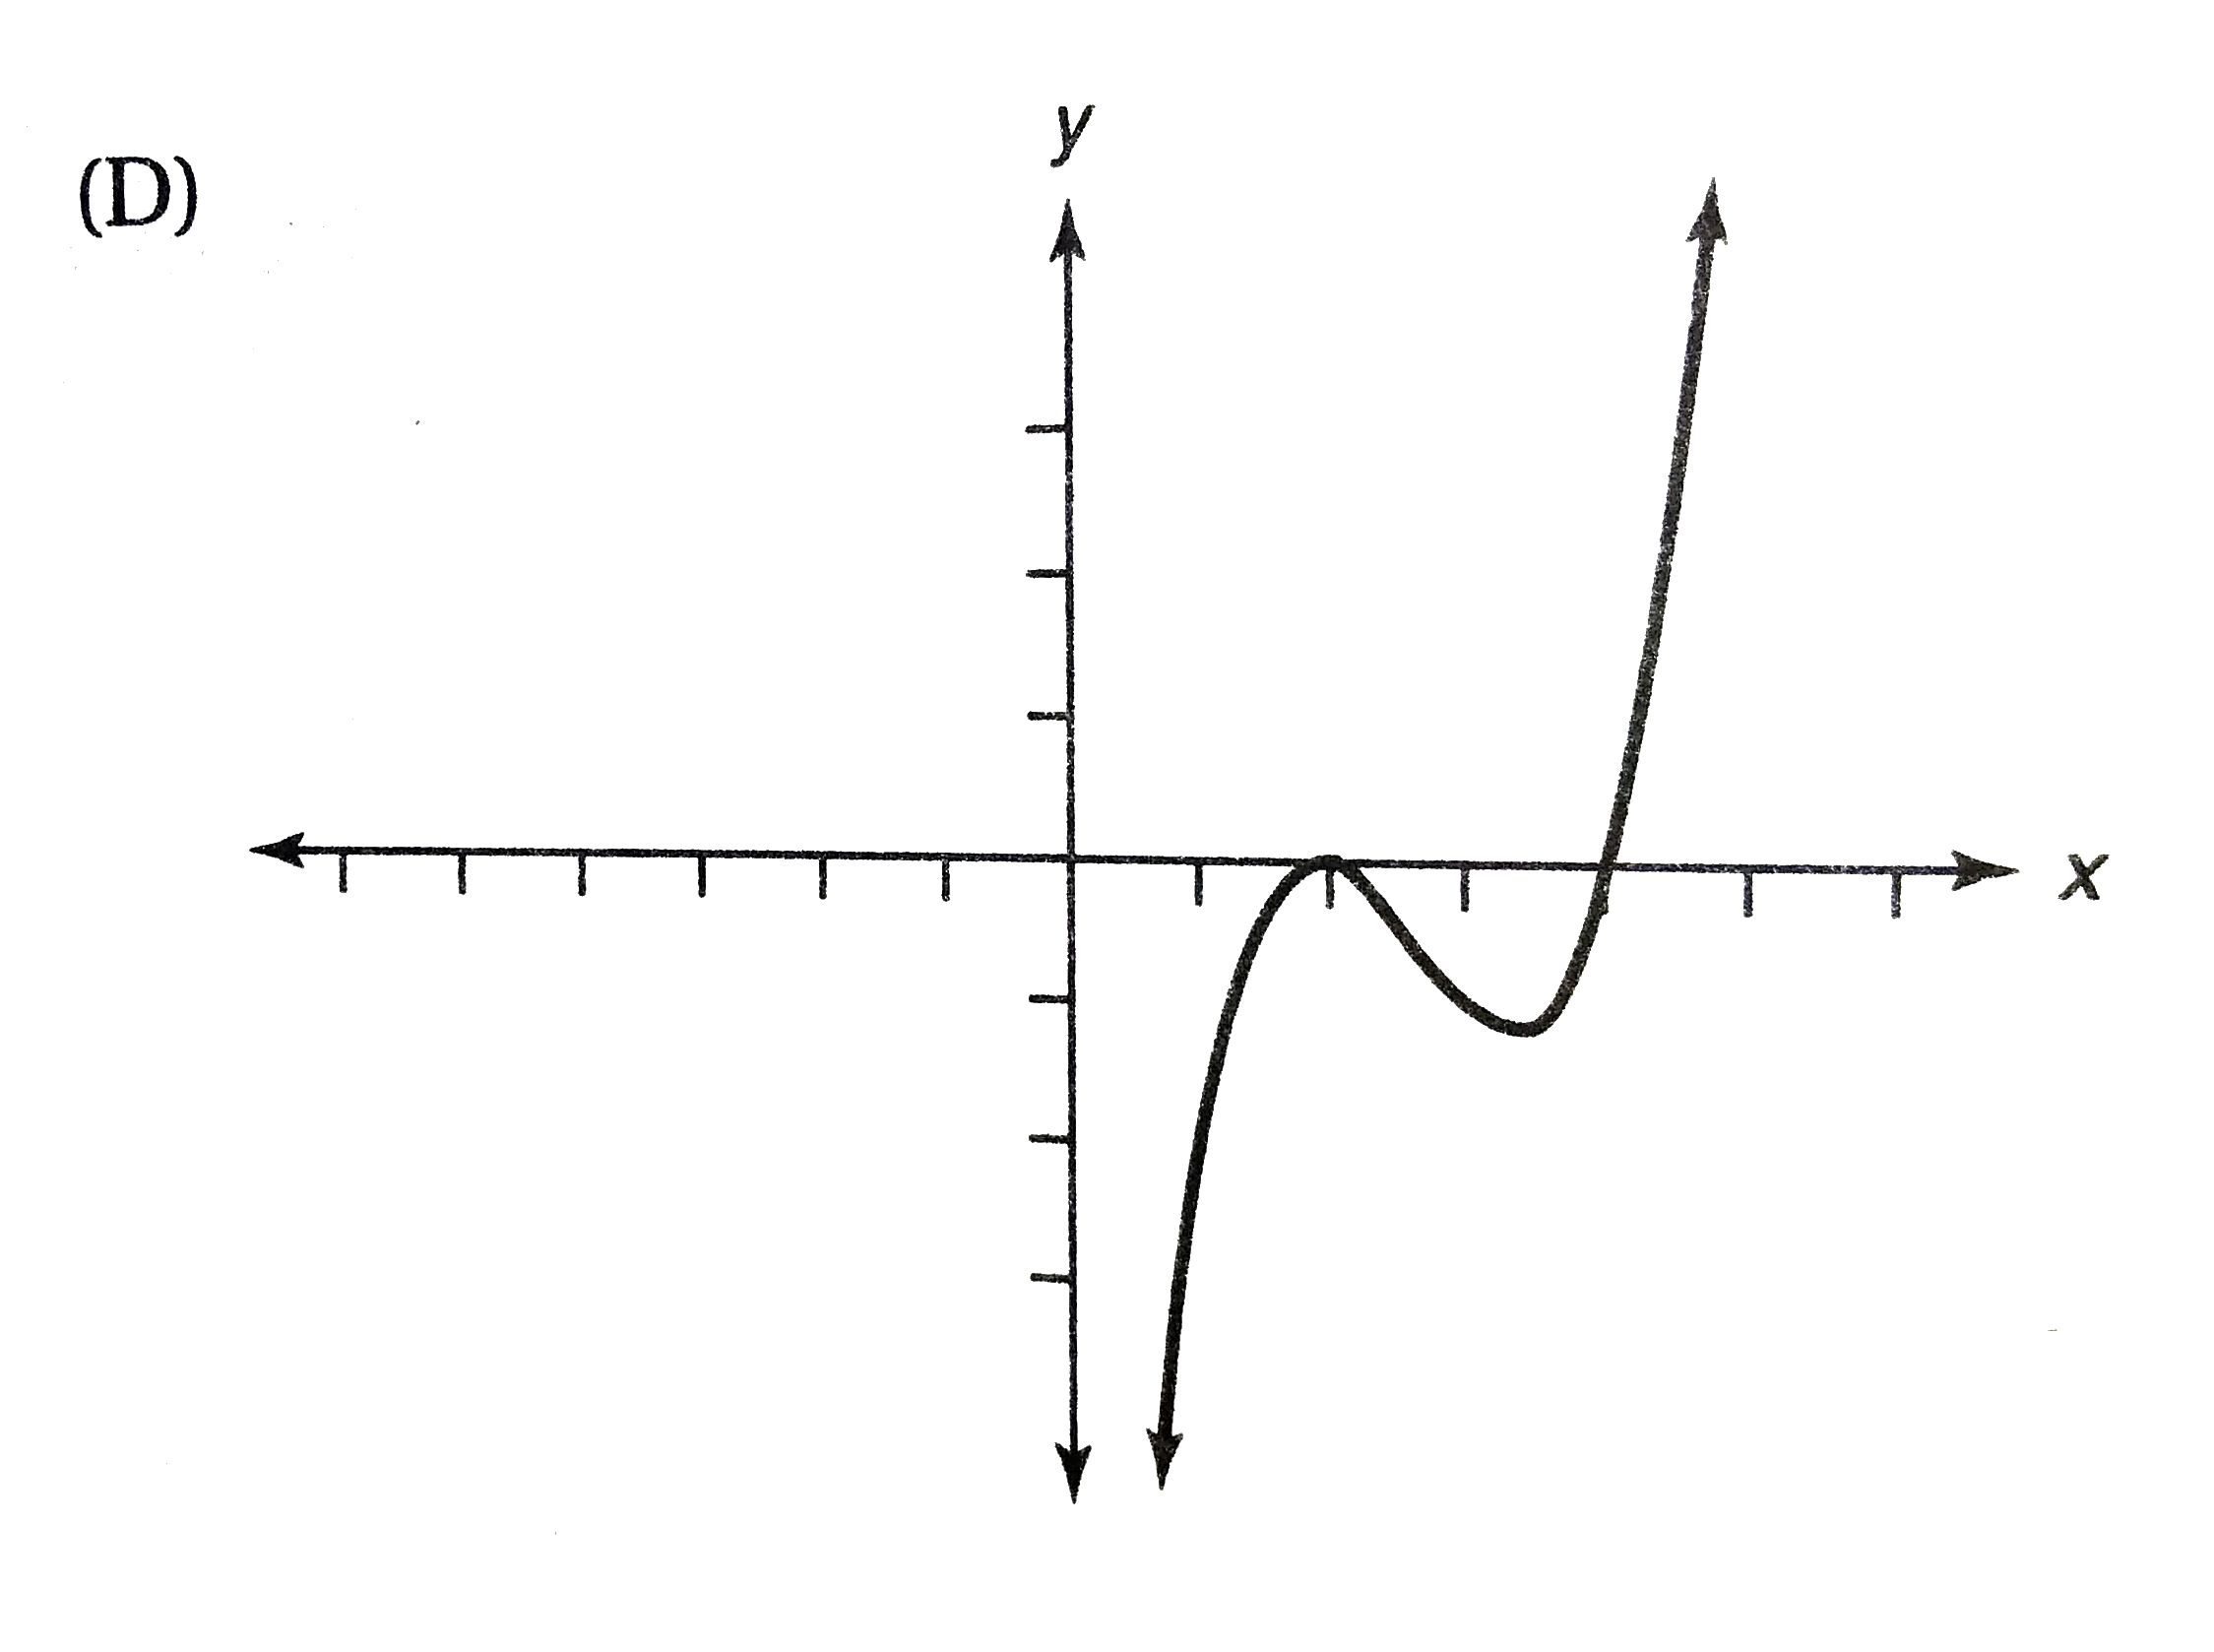
The figure above shows the graph of function f. If g(x)=−f(x), which graph represents function g?
A
B
C
D
Video Solution
Text Solution
The correct Answer is:B
|
Answer
Step by step video, text & image solution for The figure above shows the graph of function f. If g(x)=-f(x), which graph represents function g? by Maths experts to help you in doubts & scoring excellent marks in Class 12 exams.
Updated on:21/07/2023Topper's Solved these Questions
- PASSPORT TO ADVANCED MATHBook:ENGLISH SATChapter:PASSPORT TO ADVANCED MATHExercise:Grib-In
Explore 29 Videos
- PASSPORT TO ADVANCED MATHBook:ENGLISH SATChapter:PASSPORT TO ADVANCED MATHExercise:EXERCISE
Explore 80 Videos
- PASSPORT TO ADVANCED MATHBook:ENGLISH SATChapter:PASSPORT TO ADVANCED MATHExercise:EXERCISE
Explore 80 Videos
- PARAMETRIC EQUATIONS Book:ENGLISH SATChapter:PARAMETRIC EQUATIONS Exercise:EXERCISES
Explore 3 Videos
- PIECEWISE FUNCTIONSBook:ENGLISH SATChapter:PIECEWISE FUNCTIONSExercise:EXERCISES
Explore 8 Videos
Similar Questions
Knowledge Check
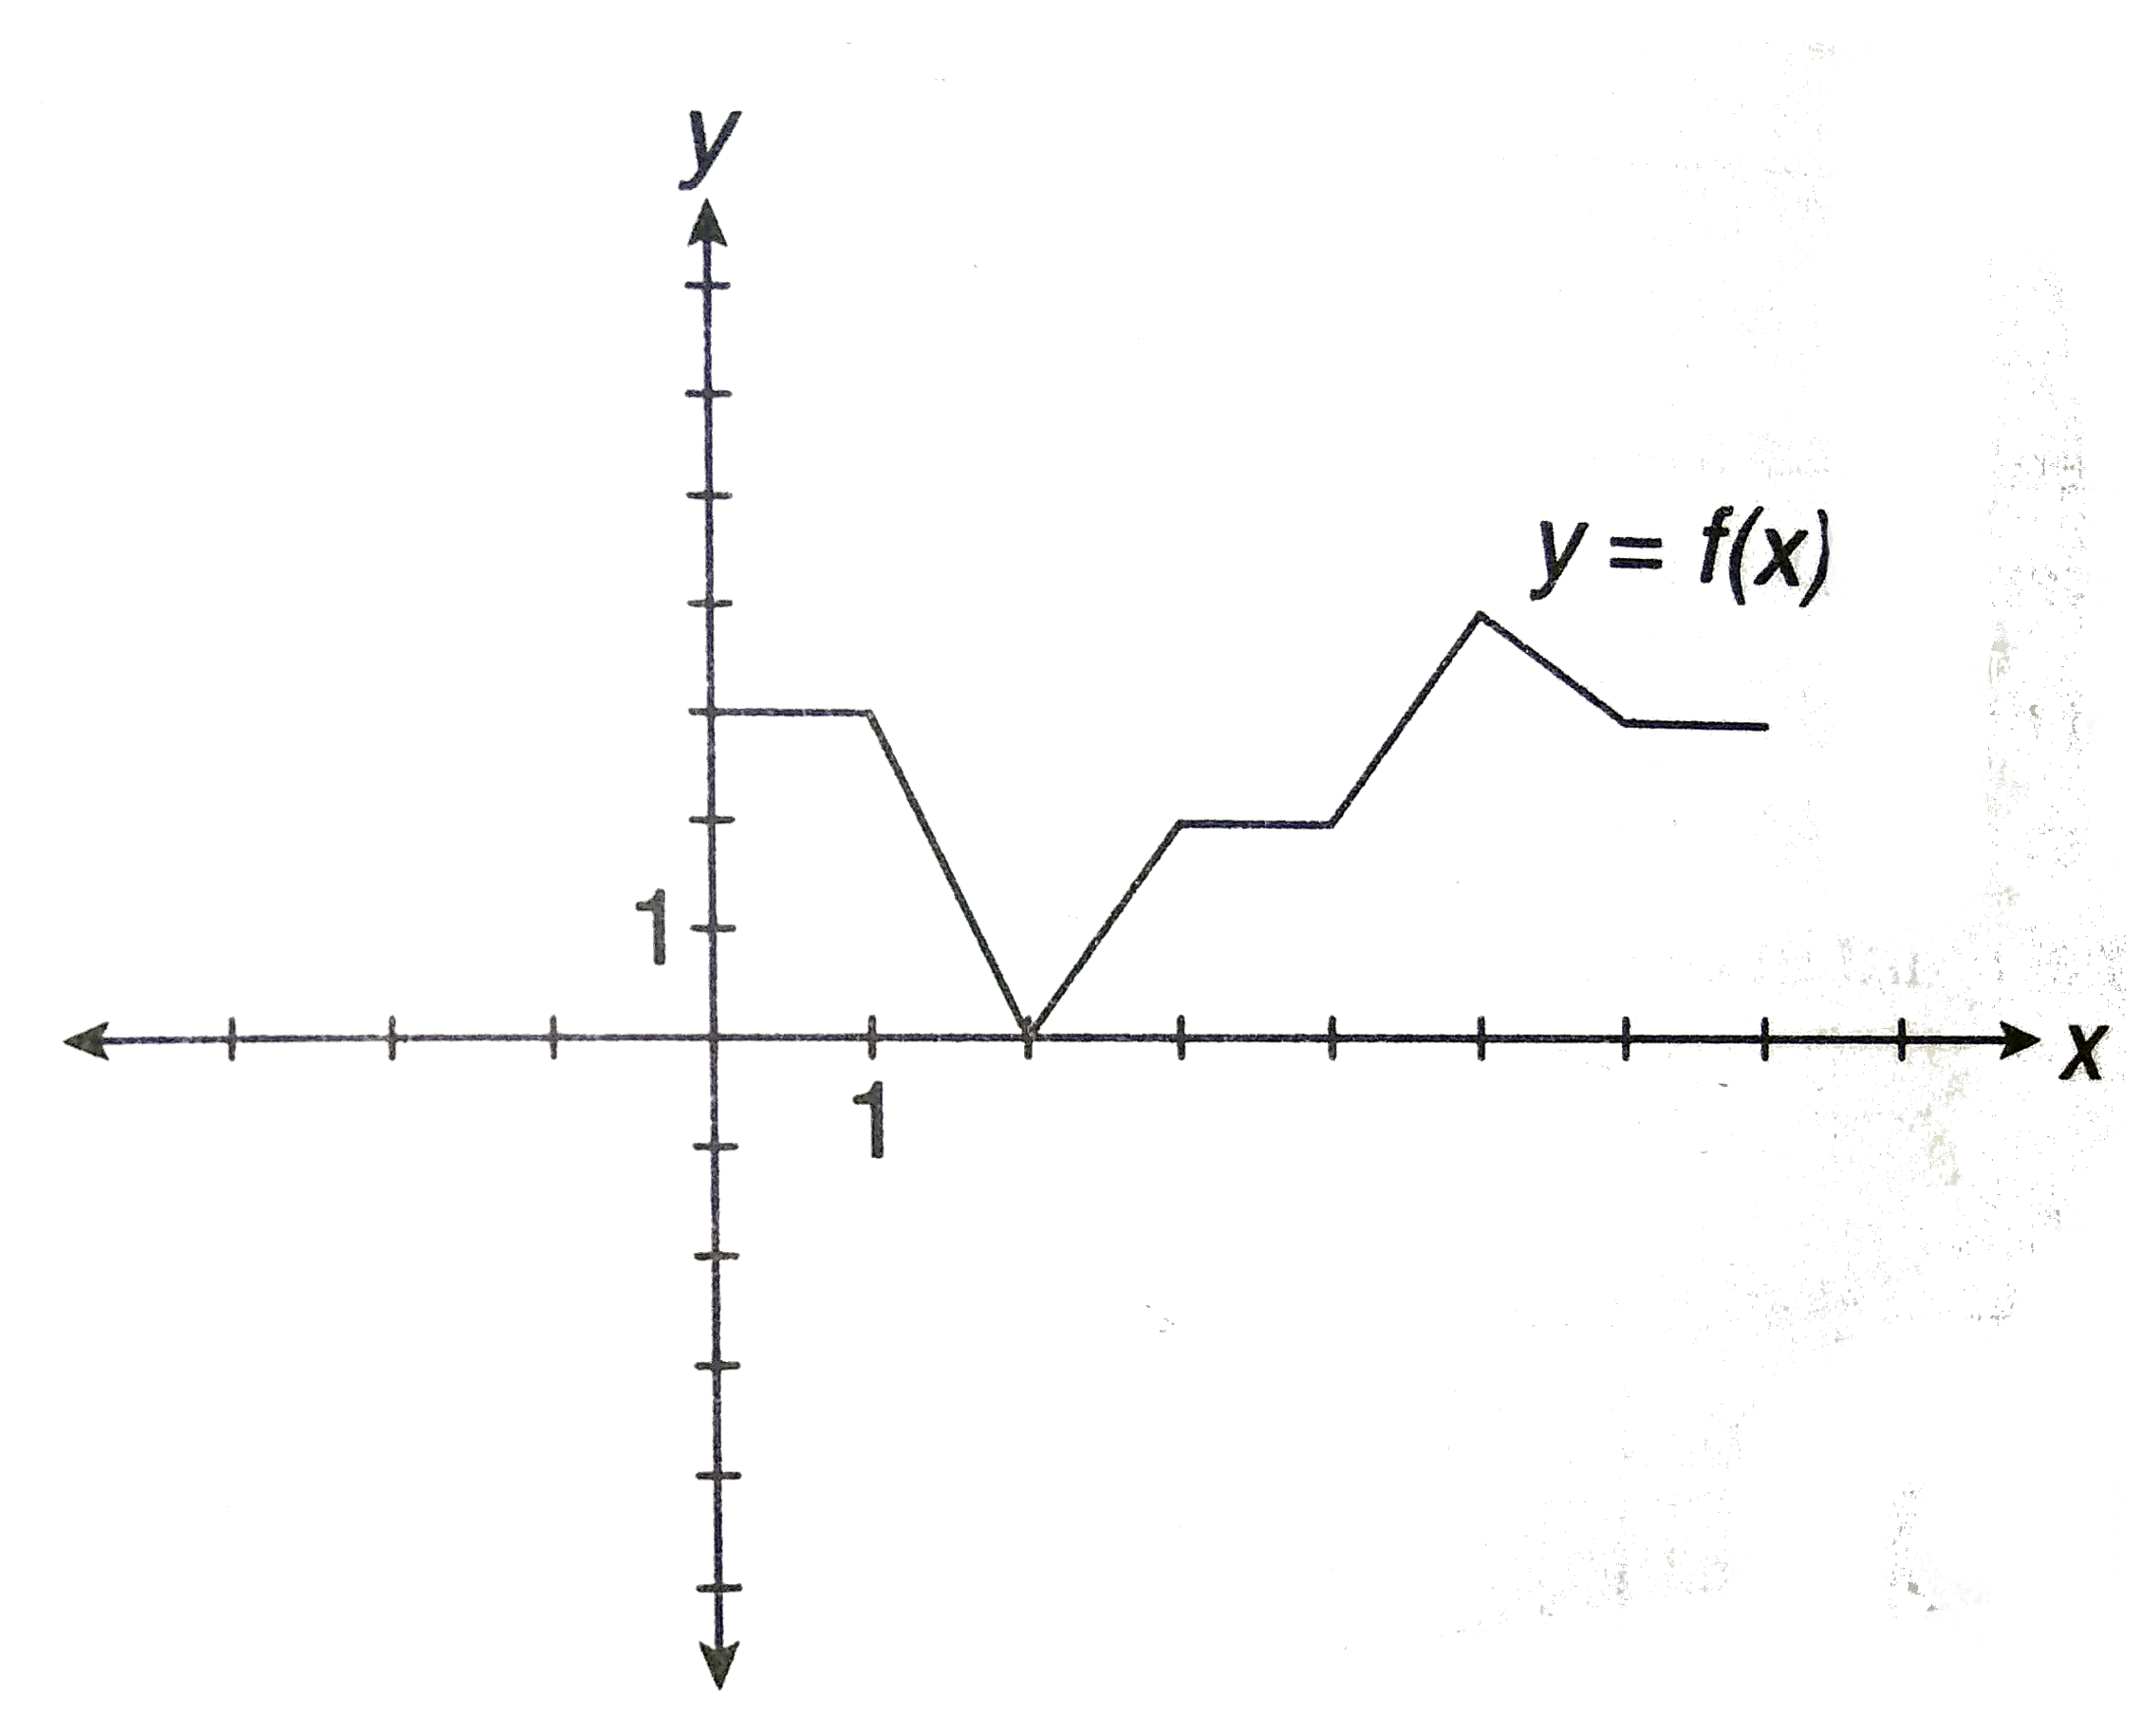
The figure above shows part of the graph of function f. If f(x+6)=f(x) for all values of x, what is the value of f(23)?A0B2C3D4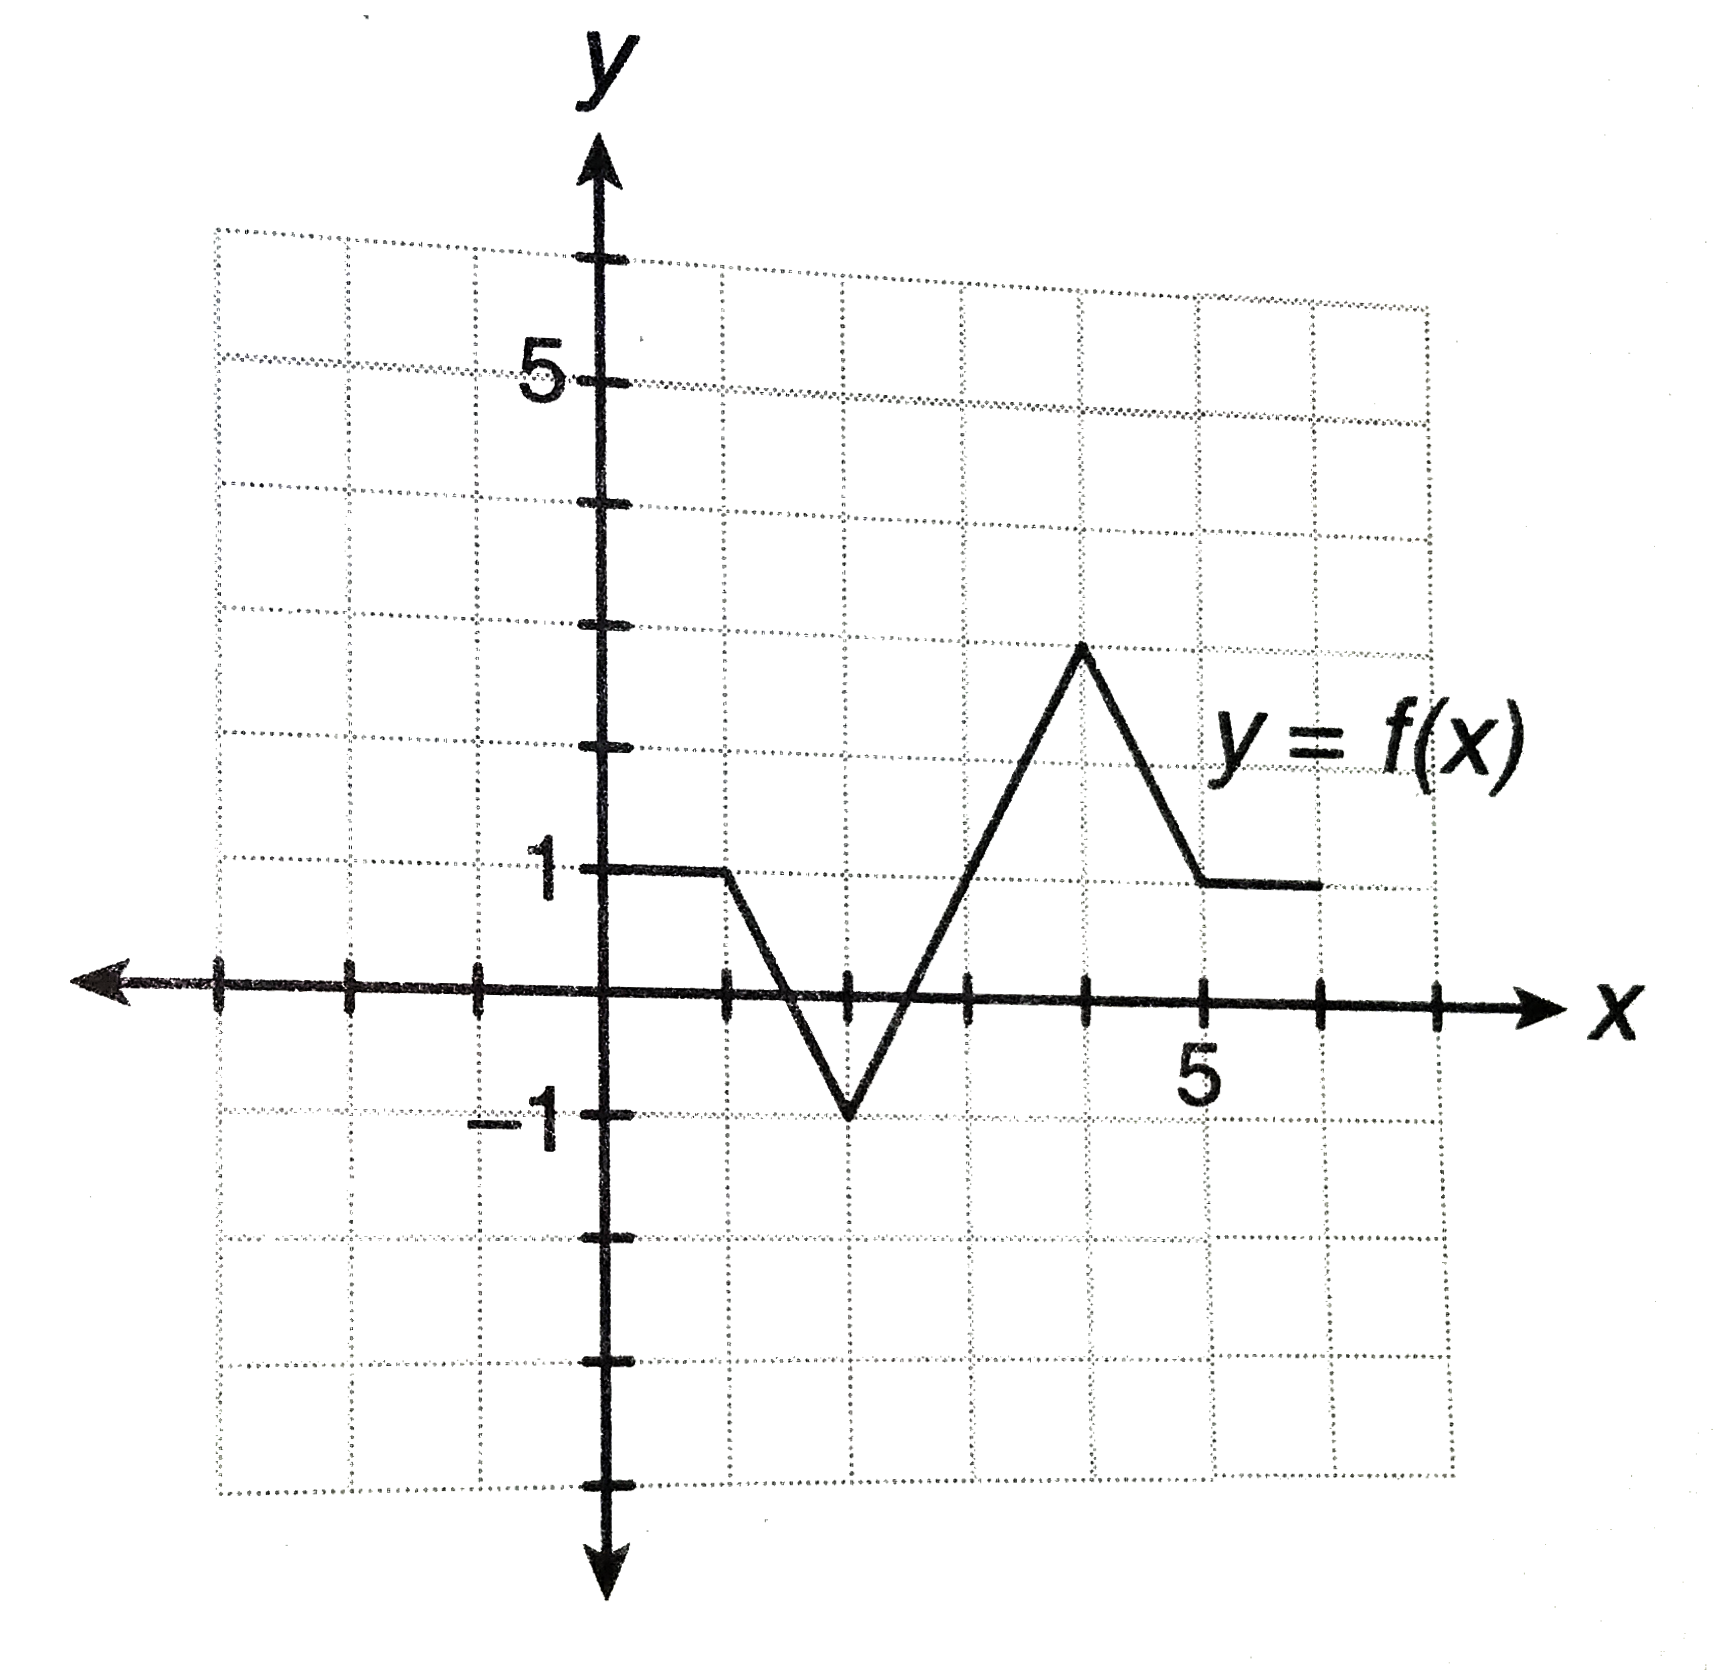
The figure above shows part of the graph of function f. If f(x−5)=f(x) for all values of x, what is the value of f(19)?A−1B0C1D3
Draw the graph of the function f(x)=−x|x|.
View SolutionDraw the graph of the function f(x)=x−√x.
View SolutionDraw the graph of the function: f(x)=log|x|
View SolutionDraw the graph of the function: |f(x)|=tanx
View SolutionDraw the graph of the function: |f(x)|=tanx
View SolutionDraw the graph of the function f(x)=(1x)x
View Solution

