Will the nature of the following graphical presentations for a given mass of gas be the same?
(i) P vs V at a constant temperature
(ii) V vs T at constant pressure.Solution in Bengali
No, they will not be the same.
(i) For a fixed mass of a gas at a givem temperature PV=constant. This relation expresses an equation of rectangular hyperbola. Therefore, P vs V plot for a fixed mass of gas at a given temperature will produce a curve of rectangular hyperbola.
(ii) For a fixed amount of a gas at a constant pressure, V=K×T (K=constant). this relation expreses an equation of a straight line passing through the origin. therefore, V vs T plot for a fixed mass of gas at a constant pressure will give a straight line passing through the origin.
Topper's Solved these Questions
- BOOK - CHHAYA PUBLICATIONCHAPTER - STATES OF MATTER : GASES AND LIQUIDSEXERCISE - QUESTION-ANSWER ZONE FOR BOARD EXAMINATION51videos
STATES OF MATTER : GASES AND LIQUIDS
- BOOK - CHHAYA PUBLICATIONCHAPTER - STATES OF MATTER : GASES AND LIQUIDSEXERCISE - SOLVED WBCHSE SCANNER23videos
STATES OF MATTER : GASES AND LIQUIDS
- BOOK - CHHAYA PUBLICATIONCHAPTER - STATES OF MATTER : GASES AND LIQUIDSEXERCISE - PRACTICE SET10videos
STATES OF MATTER : GASES AND LIQUIDS
- BOOK - CHHAYA PUBLICATIONCHAPTER - SOME BASIC CONCEPTS OF CHEMISTRYEXERCISE - PRACTICE SET13videos
SOME BASIC CONCEPTS OF CHEMISTRY
- BOOK - CHHAYA PUBLICATIONCHAPTER - STRUCTURE OF ATOMEXERCISE - PRACTICE SET15videos
STRUCTURE OF ATOM
Similar Questions
Mention the variables and constant quantities in charles' law.
02:16View SolutionDetermine the value of gas constant R in SI unit.
05:01View SolutionMaximum deviation from ideal gas is expected in case of-
07:19View SolutionWhat do you mean by semimolar NaOH solution?
02:54View SolutionWhat accelerating potential is needed to produce an electron beam with an effective wavelength of 0.090Å-
07:18View SolutionAt low pressure, the graph of PVvs1V for a given amount at a constant temperature for a real gas is:
02:50View SolutionWhat type of curve are obatained when at constant temperature, we plot
(i) P vs 1/V (ii) PV vs P (iii) V vs P07:09View SolutionPvs.V तथा Pvs.1V के ग्राफो की प्रकृति बताइए |
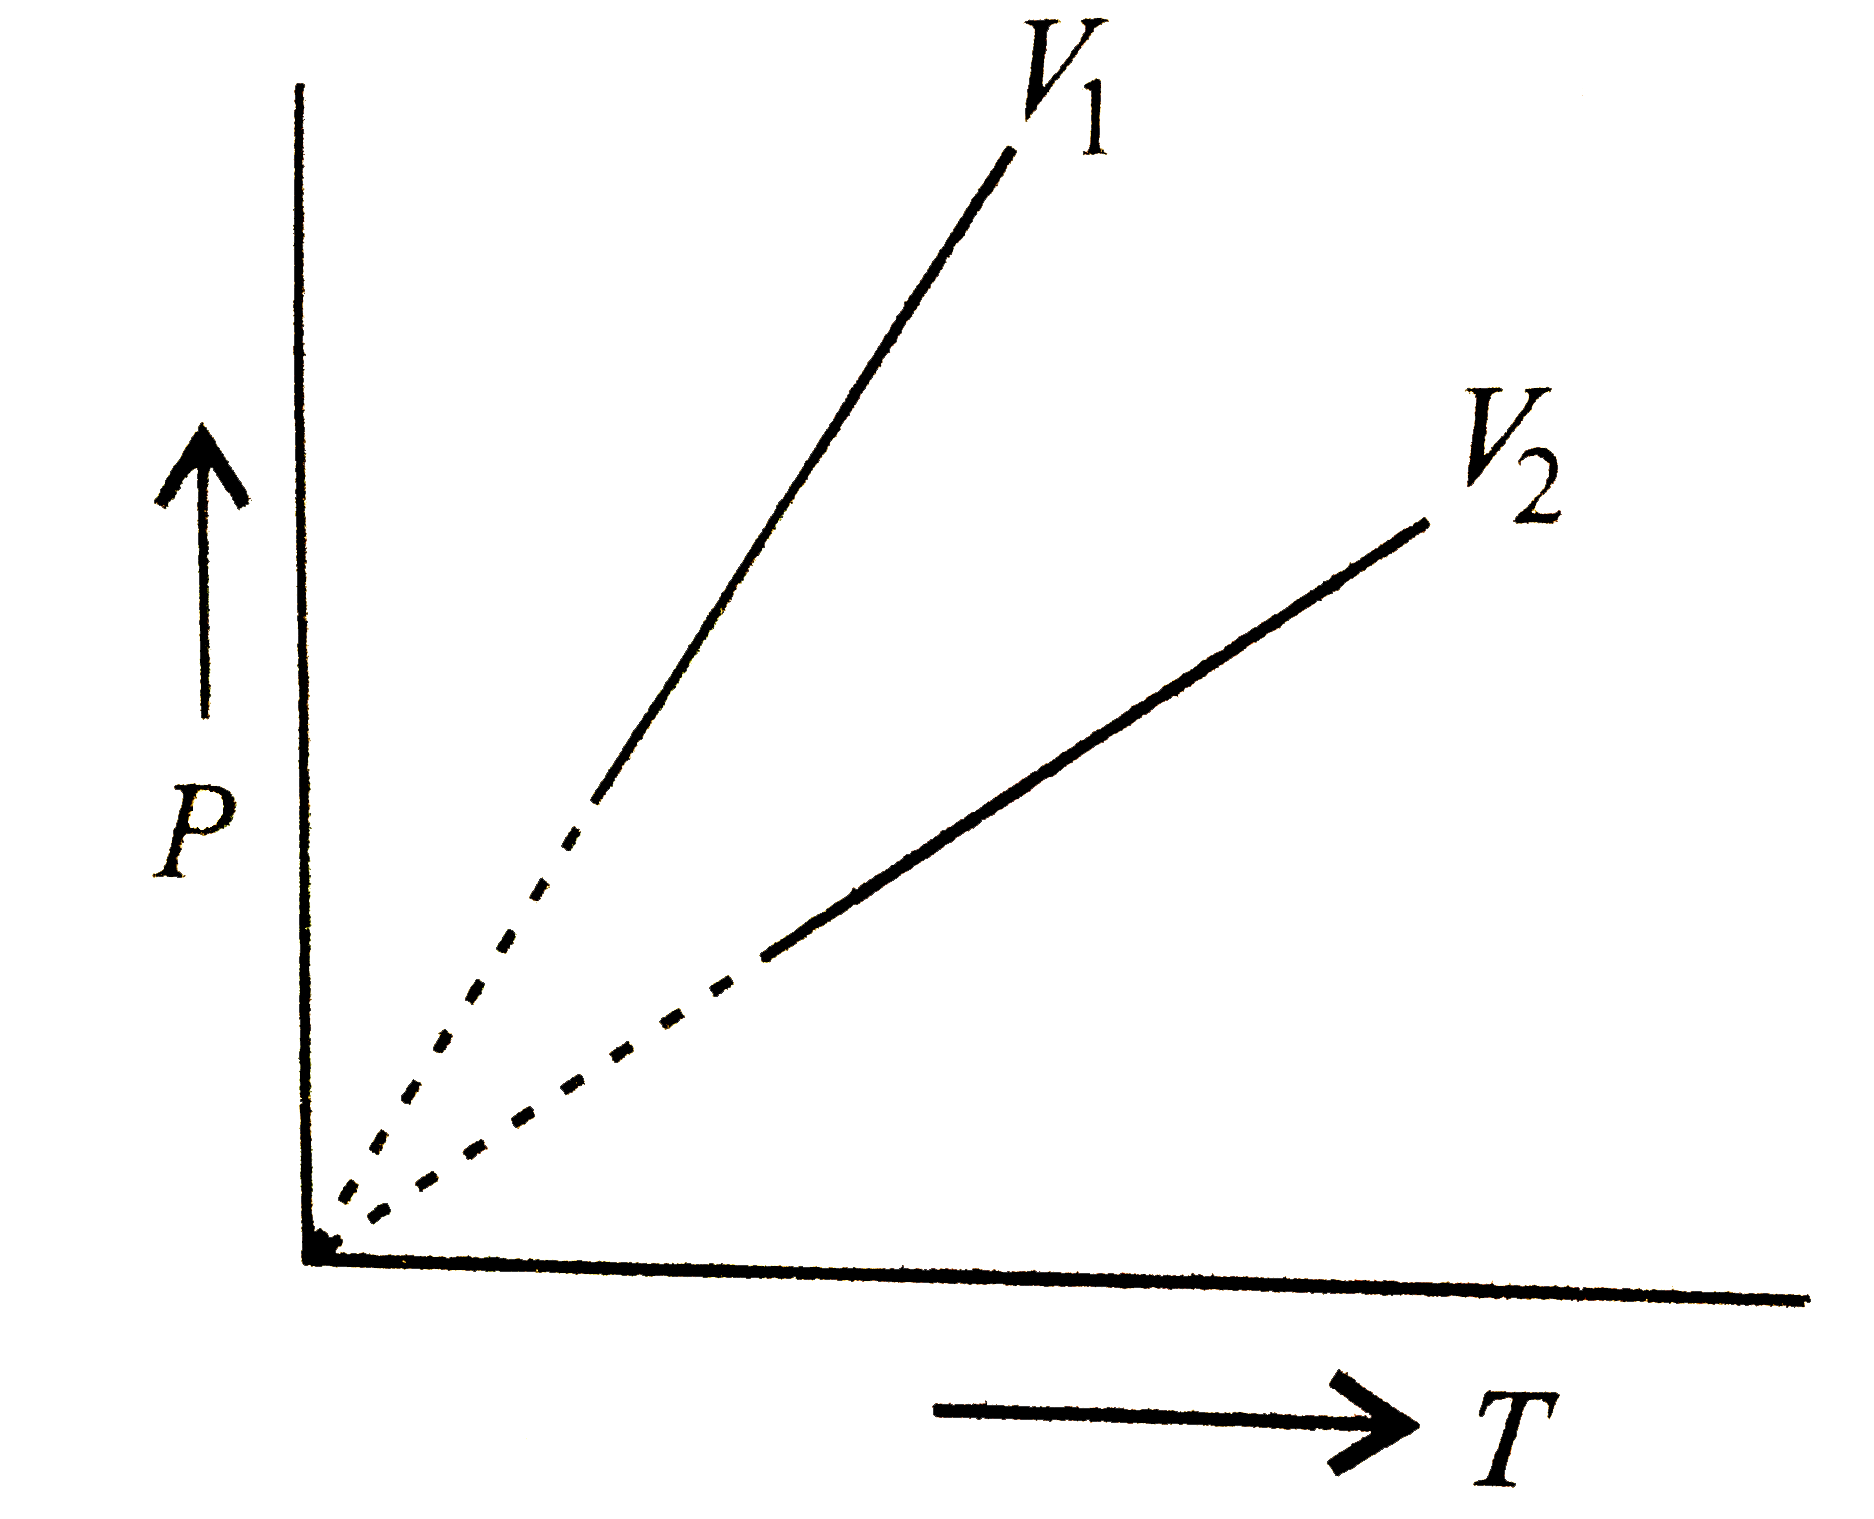
05:32View SolutionA plot of P vs T for a given mass of gas at constant volume is a straight line . P vs T at constant volumes V1 and V2 for an ideal gas are shown below :
Which of the following is correct ?
 08:53View Solution
Plot density vs pressure for a fixed mass of an ideal gas at a constant temperature.
05:10View SolutionAt constant pressure for a given amount of an ideal gas, will the graph obtained by plotting V vs t^(@)C and V vs TK be different ?
00:59View SolutionFor a fixed mass of an ideal gas draw the following graphs:
(i) P/T vs T (volume remaining constant)
(ii) d (density) vs P (temperature remaining constant)03:04View Solutionfor a given mass of an ideal gas at constant temperature draw and explain the graphs (i) PV^(2) vs V (ii) P^(2)V vs V.
03:12View SolutionAt constant pressure for a given amount of an ideal gas, will the graphs obtained by plotting V vs t^(@)C and V vs TK be different?
02:30View Solutionস্থির উষ্ণতায় নির্দিষ্ট ভরের আদর্শ গ্যাসের logP বনাম logV লেখচিত্রটি আঁকো এবং নতির মান নির্দেশ করাে ।
02:54View Solution

