For a fixed mass of an ideal gas draw the following graphs:
(i) P/T vs T (volume remaining constant)
(ii) d (density) vs P (temperature remaining constant) Solution in Bengali
(i) According to Gay-Lussac's law P/T=K (constant) for a gas of fixed mass & volume.
(ii) For an ideal gas density. d=PMRT=constanat × [as  M, R and T are constant.]
Topper's Solved these Questions
- STATES OF MATTER : GASES AND LIQUIDSBook:CHHAYA PUBLICATIONChapter:STATES OF MATTER : GASES AND LIQUIDSExercise:SOLVED NCERT EXERCISE
Explore 23 Videos
- STATES OF MATTER : GASES AND LIQUIDSBook:CHHAYA PUBLICATIONChapter:STATES OF MATTER : GASES AND LIQUIDSExercise:HIGHER ORDER THINKING SKILL (HOTS) QUESTIONS
Explore 20 Videos
- STATES OF MATTER : GASES AND LIQUIDSBook:CHHAYA PUBLICATIONChapter:STATES OF MATTER : GASES AND LIQUIDSExercise:QUESTION-ANSWER ZONE FOR BOARD EXAMINATION
Explore 51 Videos
- SOME BASIC CONCEPTS OF CHEMISTRYBook:CHHAYA PUBLICATIONChapter:SOME BASIC CONCEPTS OF CHEMISTRYExercise:PRACTICE SET
Explore 13 Videos
- STRUCTURE OF ATOMBook:CHHAYA PUBLICATIONChapter:STRUCTURE OF ATOMExercise:PRACTICE SET
Explore 15 Videos
Similar Questions
Find out the minimum pressure required to compress 500 dm3 of aiir at 1 bar to 200 dm3 at 30∘C.
View Solutioncrms=√3RTM=√3PVM. According to this equation, with the increase in pressure or volume, the value of crms will increase. Justify this statement.
View SolutionMention the variables and constant quantities in charles' law.
View SolutionWhat do you mean by semimolar NaOH solution?
View SolutionWhat accelerating potential is needed to produce an electron beam with an effective wavelength of 0.090Å-
View SolutionDraw a graph of log P vs log (1/V) for a fixed amount of a gas at constant temperature.
View SolutionConsider the following statements - (i) At same P, if V vs T graph is draw for sam e mass of the two idea gaes, then the heavier has will have a heighter slope. (ii) Intercept of log V vs T graph should always be posiive. (iii) Graph of V^(2) vs (1)/(T^(2)) for fixes amount of an ideal gas at constant pressure will be a parabola.
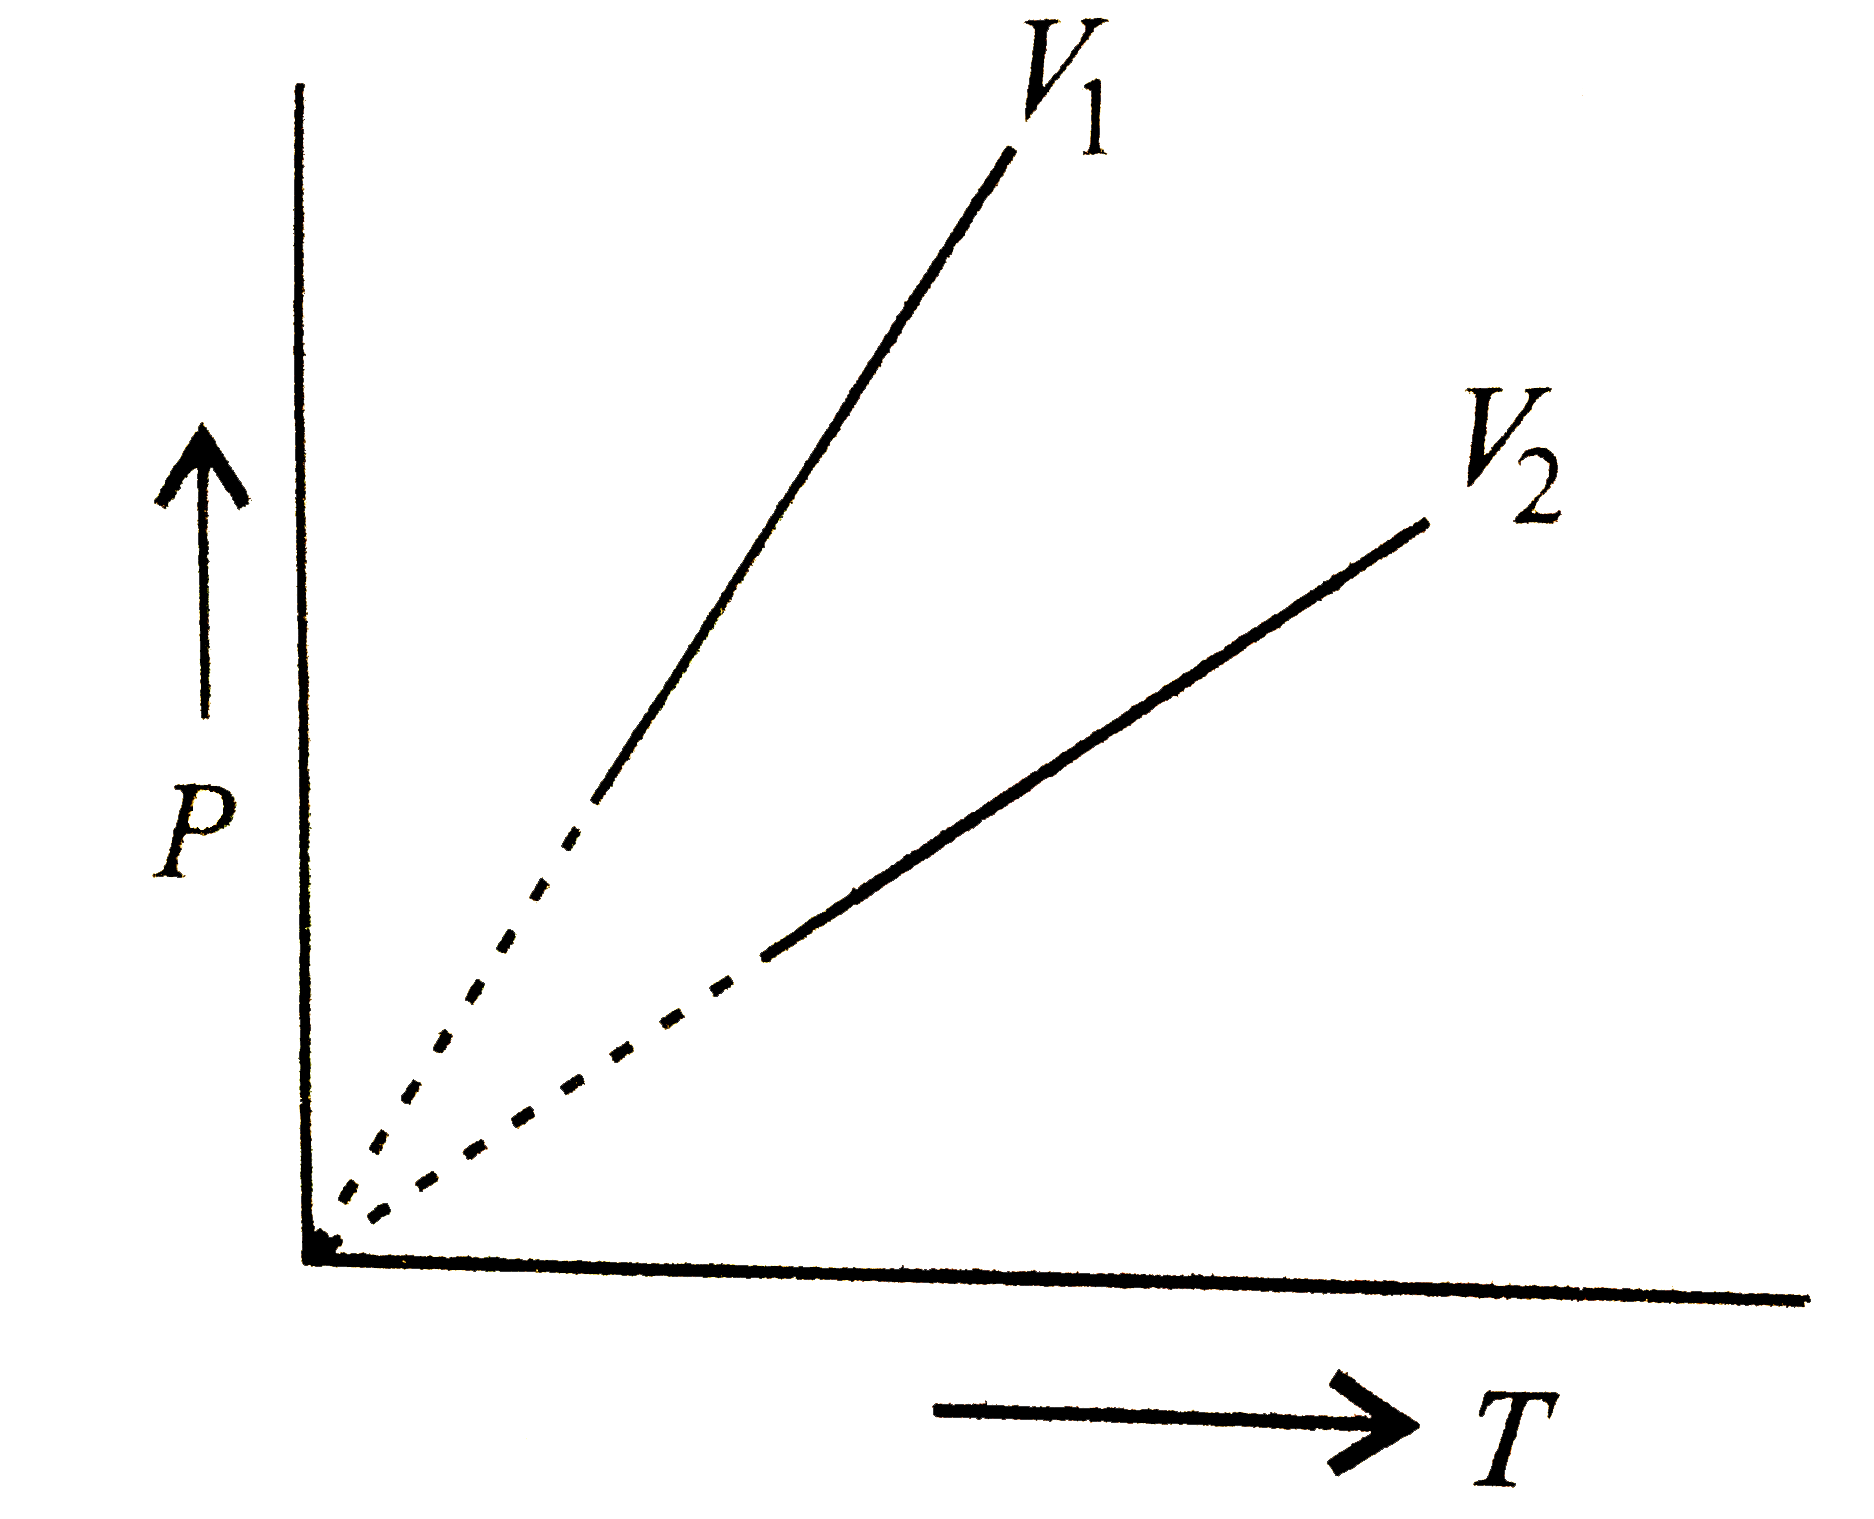
View SolutionA plot of P vs T for a given mass of gas at constant volume is a straight line . P vs T at constant volumes V1 and V2 for an ideal gas are shown below :
Which of the following is correct ?

View SolutionWill the nature of the following graphical presentations for a given mass of gas be the same? (i) P vs V at a constant temperature (ii) V vs T at constant pressure.
View SolutionPlot density vs pressure for a fixed mass of an ideal gas at a constant temperature.
View Solutionfor a given mass of an ideal gas at constant temperature draw and explain the graphs (i) PV^(2) vs V (ii) P^(2)V vs V.
View Solutionস্থির উষ্ণতায় নির্দিষ্ট ভরের আদর্শ গ্যাসের logP বনাম logV লেখচিত্রটি আঁকো এবং নতির মান নির্দেশ করাে ।
View SolutionThe graph of P vs T is a straight line for a given mass of a gas at a fixed volume. Fixed volume for an ideal gas V_(1) "व" V_(2) But P vs T is shown Which of the following is correct ?
View SolutionA plot of P vs T for a given mass of gas at constant volume is a straight line . P vs T at constant volumes V_(1) and V_(2) for an ideal gas are shown below : Which of the following is correct ?
View SolutionDraw a graph between pressure (P) vs volume (1V) at constant temperature.
View Solution

