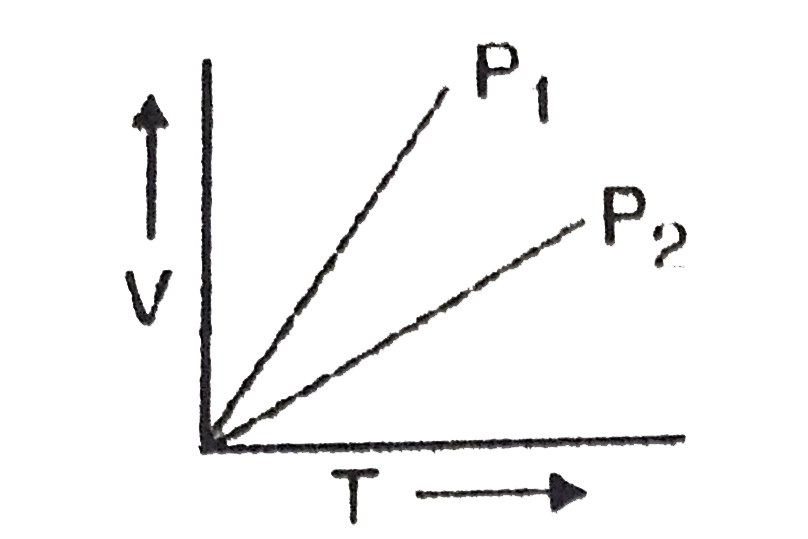
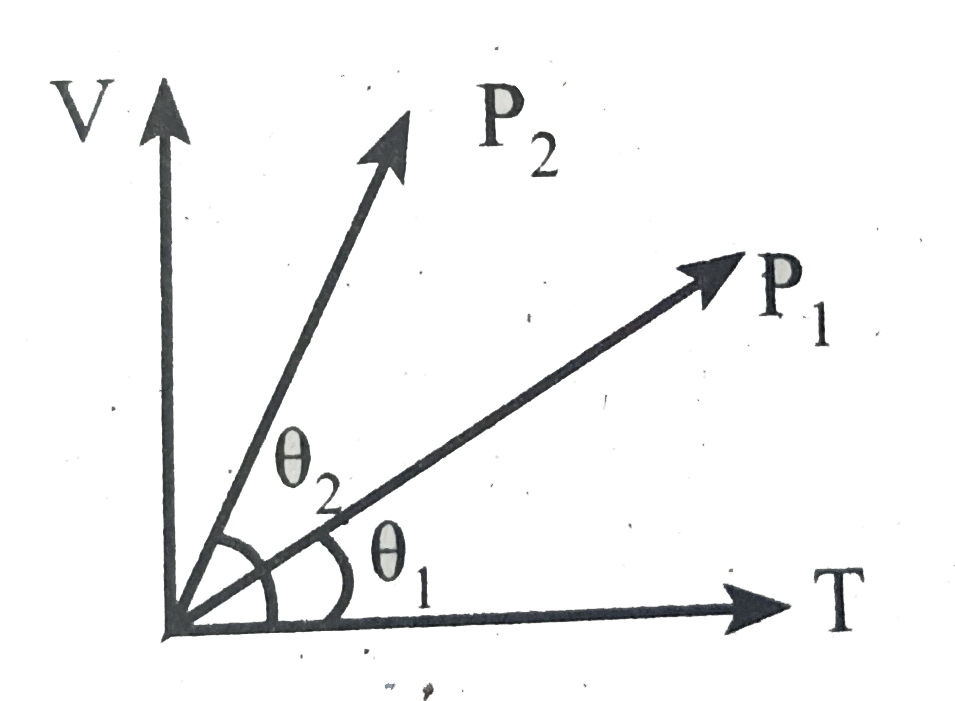
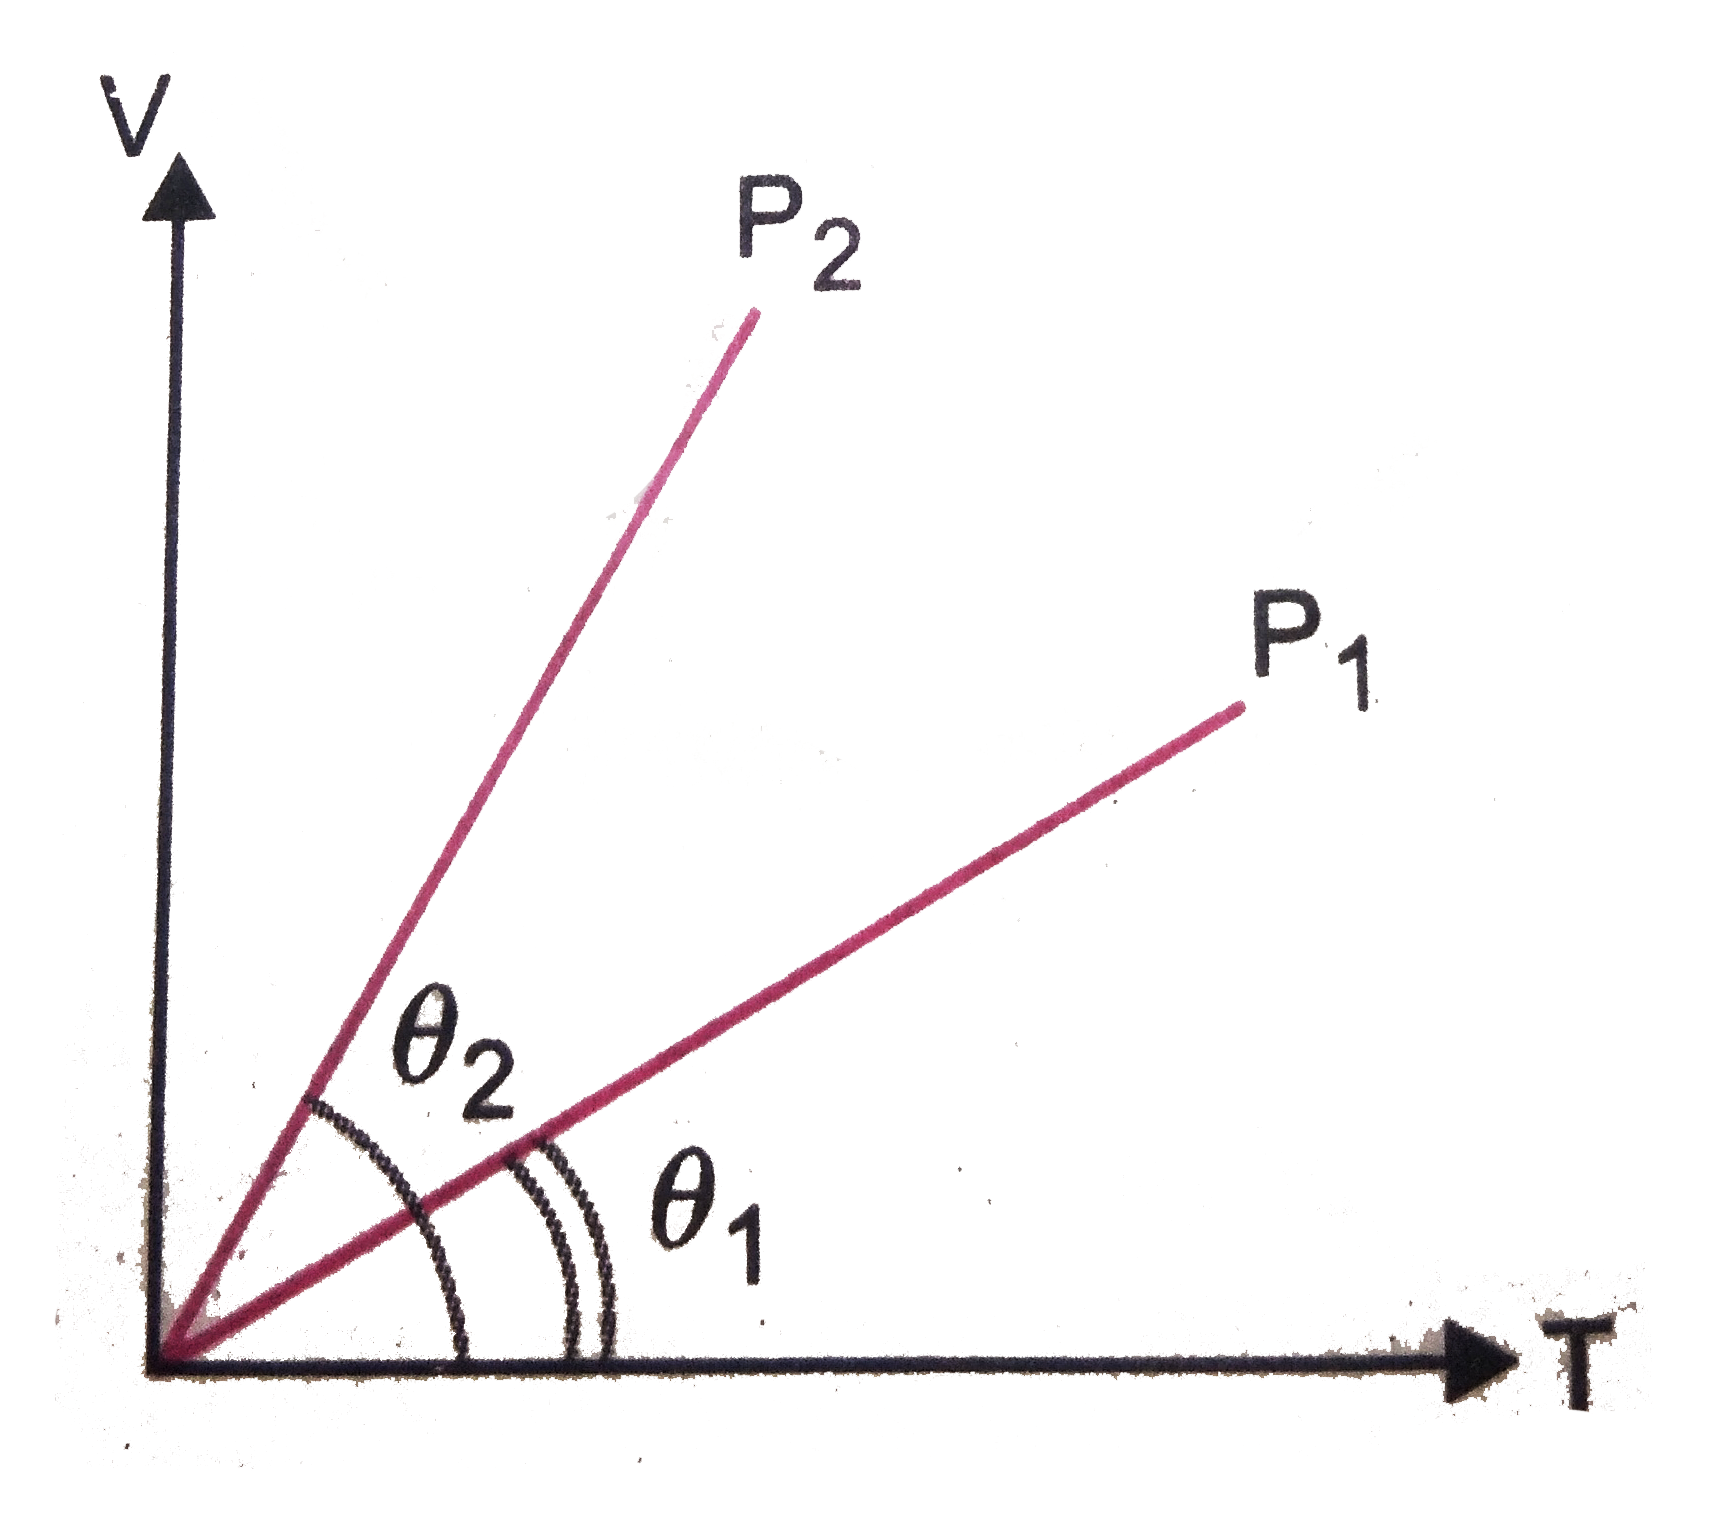
(i) Plotting V vs T for a given mass of an ideal gas at two different fixed pressures P1andP2 gives two straight lines, one of which corresponds to P1 and the other corresponds to P2. If P1 is greater than P2, then which one of thes straight lines will make a larger angle with the T-axis?
(ii) Plotting P vs T for a given mass of an ideal gas at two different fixed volumes V1andV2 gives two straight lines, one of which corresponds to V1 and the other corresponds to V2. if V1 is greater than V2, then which one of these straight lines will make a larger angle with the T-axis?Solution in Bengali
(i) Straight line obtained at pressure P2 will make larger angle with the T-axis.
(ii) The straight line obtained at volume V2 will make larger angle with the T-axis.
Topper's Solved these Questions
- STATES OF MATTER : GASES AND LIQUIDSBOOK - CHHAYA PUBLICATIONCHAPTER - STATES OF MATTER : GASES AND LIQUIDSEXERCISE - QUESTION-ANSWER ZONE FOR BOARD EXAMINATION
51 Videos
- STATES OF MATTER : GASES AND LIQUIDSBOOK - CHHAYA PUBLICATIONCHAPTER - STATES OF MATTER : GASES AND LIQUIDSEXERCISE - SOLVED WBCHSE SCANNER
23 Videos
- STATES OF MATTER : GASES AND LIQUIDSBOOK - CHHAYA PUBLICATIONCHAPTER - STATES OF MATTER : GASES AND LIQUIDSEXERCISE - PRACTICE SET
10 Videos
- SOME BASIC CONCEPTS OF CHEMISTRYBOOK - CHHAYA PUBLICATIONCHAPTER - SOME BASIC CONCEPTS OF CHEMISTRYEXERCISE - PRACTICE SET
13 Videos
- STRUCTURE OF ATOMBOOK - CHHAYA PUBLICATIONCHAPTER - STRUCTURE OF ATOMEXERCISE - PRACTICE SET
15 Videos
Similar Questions
Mention the variables and constant quantities in charles' law.
View SolutionDetermine the value of gas constant R in SI unit.
View SolutionMaximum deviation from ideal gas is expected in case of-
View SolutionWhat do you mean by semimolar NaOH solution?
View SolutionWhat accelerating potential is needed to produce an electron beam with an effective wavelength of 0.090Å-
View SolutionV vs T curves at different pressures P_(1) and P_(2) for an ideal gas are shown below: Which one of the following is correct?
View SolutionFigure shows the volume versus temperature graph for the same mass of a gas (assumed ideal) corresponding to two different pressure P_(1) and P_(2) . Then
View SolutionIn the given (V-T) diagram, what is the relation between pressure P_(1) and P_(2) ?
View SolutionFor an ideal gas V - T curves at constant pressure P_(1) & P_(2) are shown in figure, from the figure
View SolutionV vs T curves at constant pressure P1 and P2 for an ideal gas are shown below

Which is correct ?
View SolutionIn the given (V-T) diagram , what is the relation between P1andP2 ?

View SolutionIn the given (V-T) diagram, what is the relation between pressures P_(1) and P_(2) ?
View SolutionFor an ideal gas V−T curves at constant pressure P1 & P2 are shown in figure, from the figure
_E01_061_Q01.png)
View SolutionIn the given (V-T) diagram, what is the relation between pressure P_(1) and P_(2) ?
View SolutionIn the given (V-T) diagram, what is the relation between pressure P1andP2 ?

View Solution