A body moves from rest with a constant acceleration. Which one of the following graphs represents the variation of its kinetic energy K with the distance travelled x?


The correct Answer is:C
Step by step video, text & image solution for A body moves from rest with a constant acceleration. Which one of the following graphs represents the variation of its kinetic energy K with the distance travelled x? by Physics experts to help you in doubts & scoring excellent marks in Class 11 exams.
Updated on:21/07/2023Topper's Solved these Questions
Similar Questions
Which one of the following given graphs represents the variation of rate constant (k) with temperature (t) for an endothermic reaction ?
View SolutionWhich one of the following given graphs represents the variation of rate constant (k) with temperature (f) for an endothermic reaction ?
View Solution
Knowledge Check
A body moves from rest with a constant ac- celeration. Which of the following graphs represents the variation of its kinetic energy (E) with distance travelled (x)?
A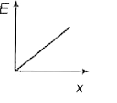 B
B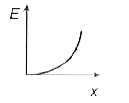 C
C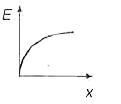 D
D
A body starting from the the rest moves along a straight line with constant acceleration. Which one of the following graphs represents the variation of speed(v) and distance(s)?
A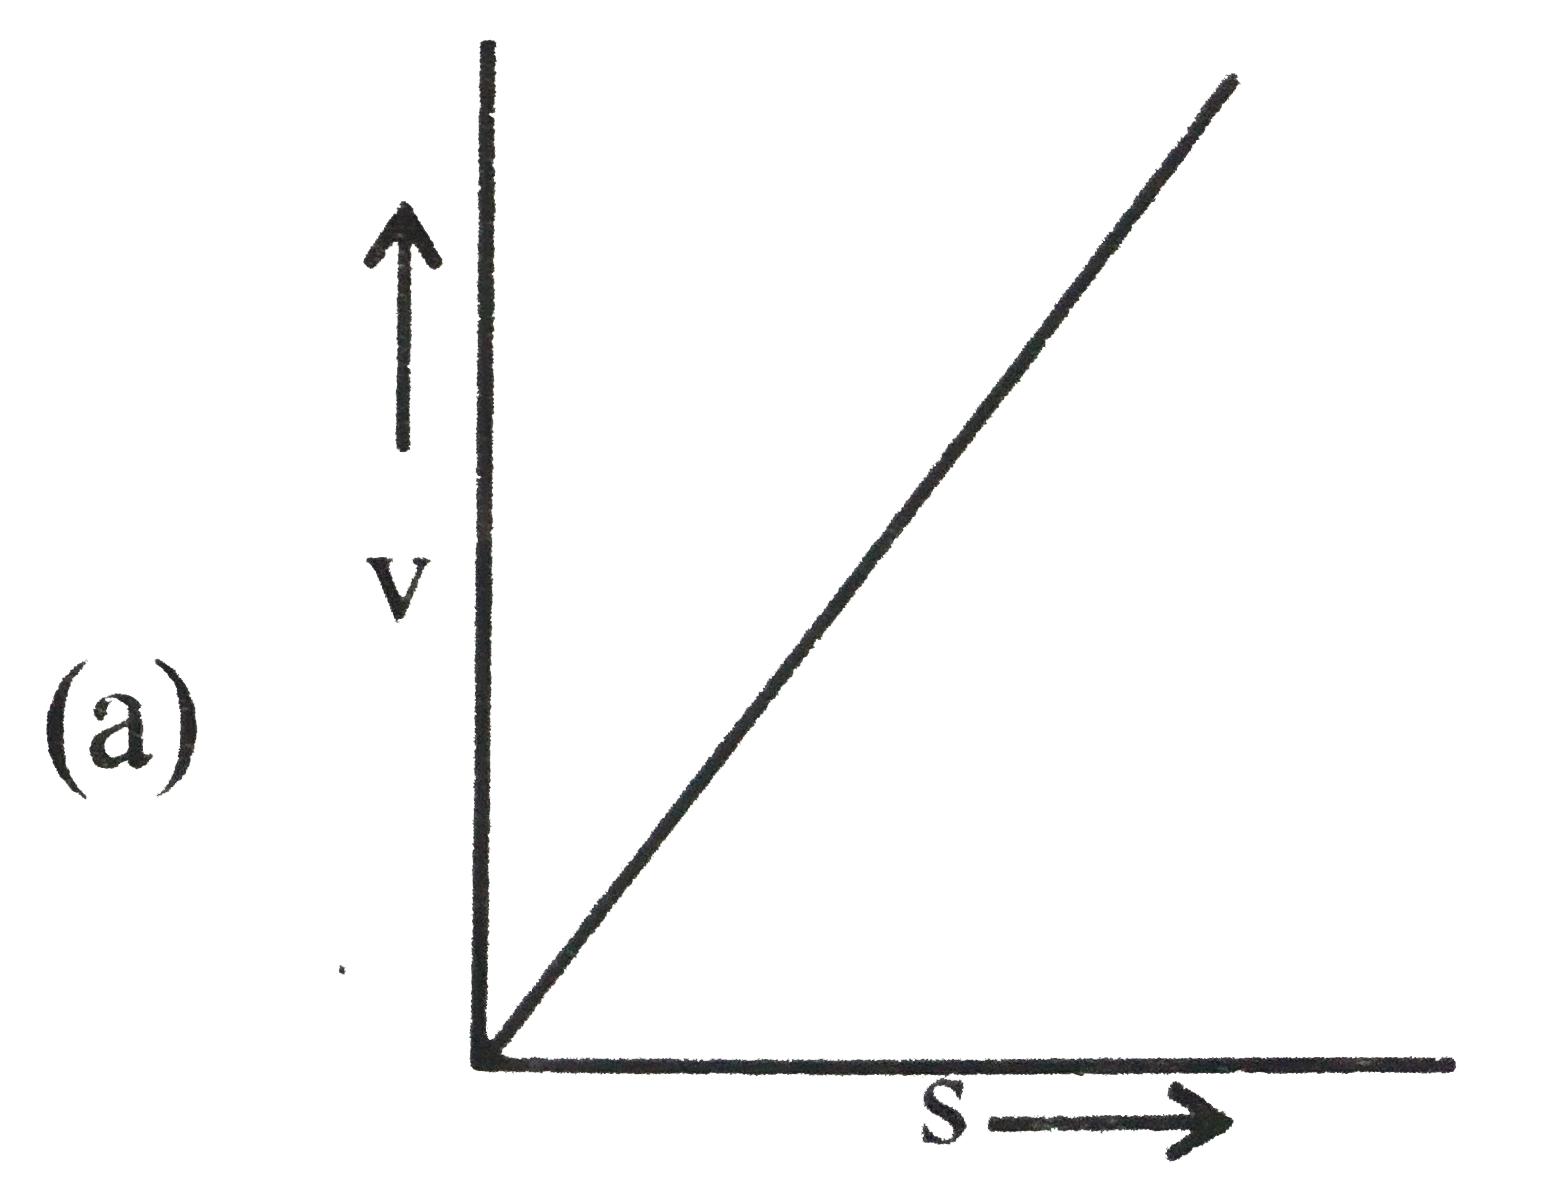 B
B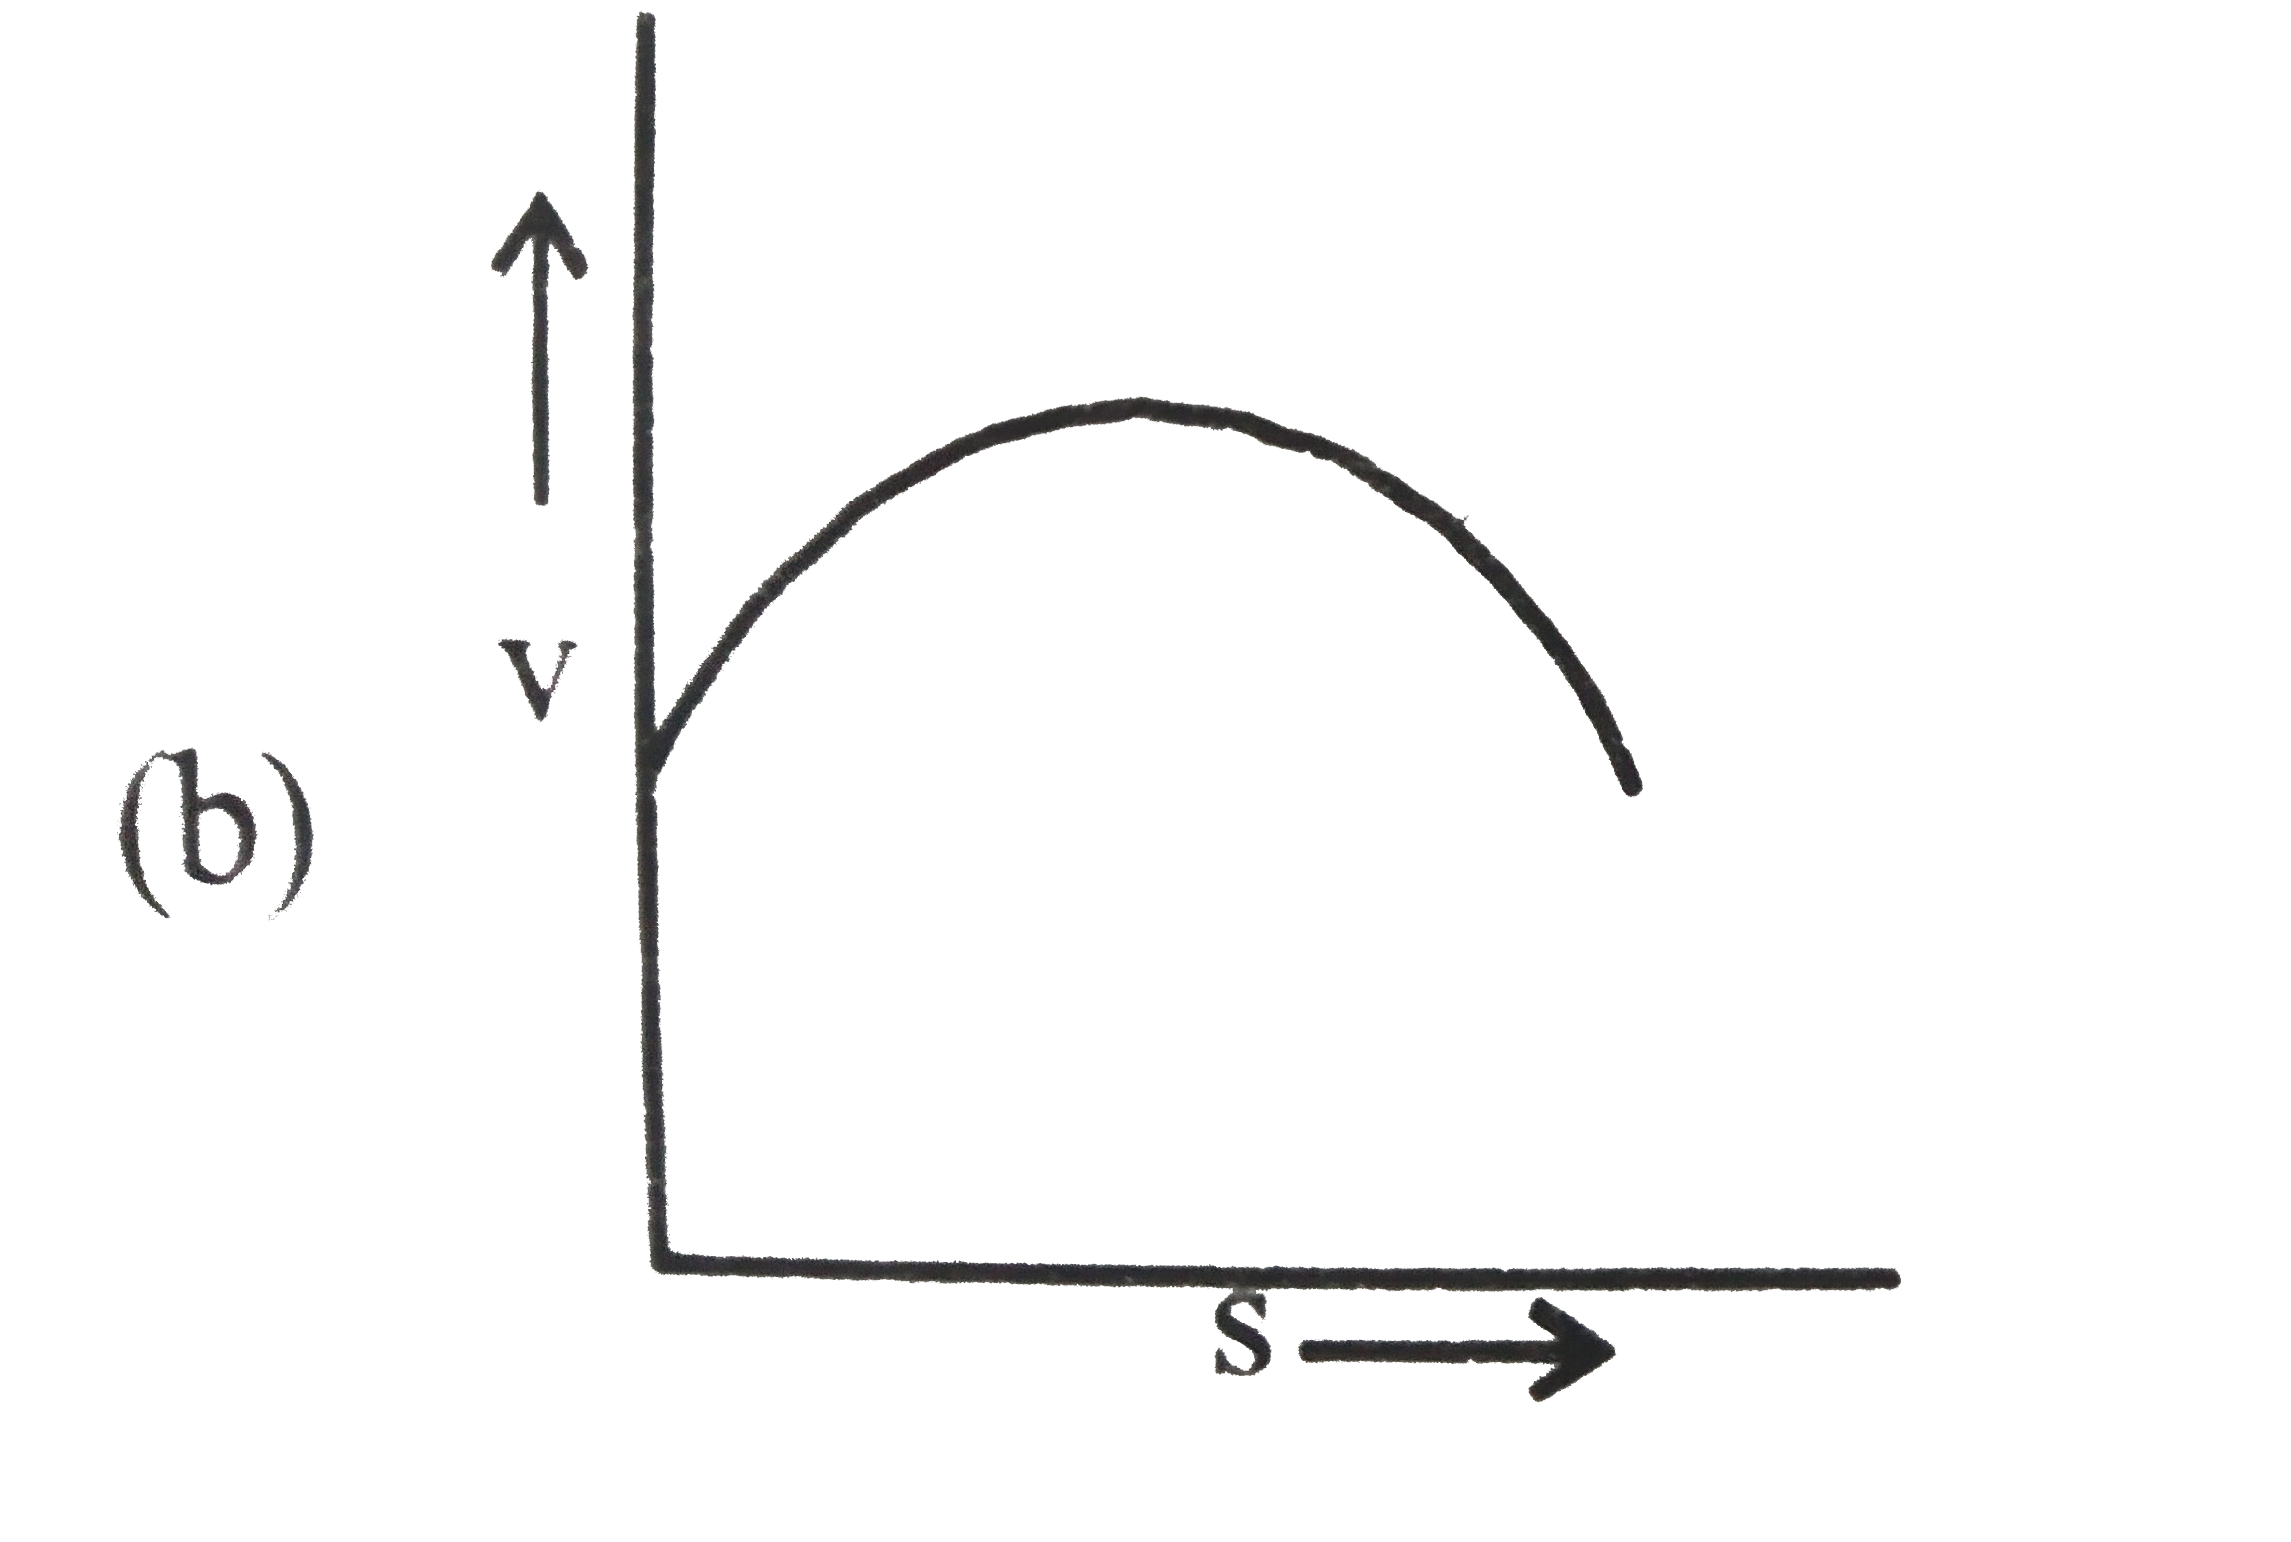 C
C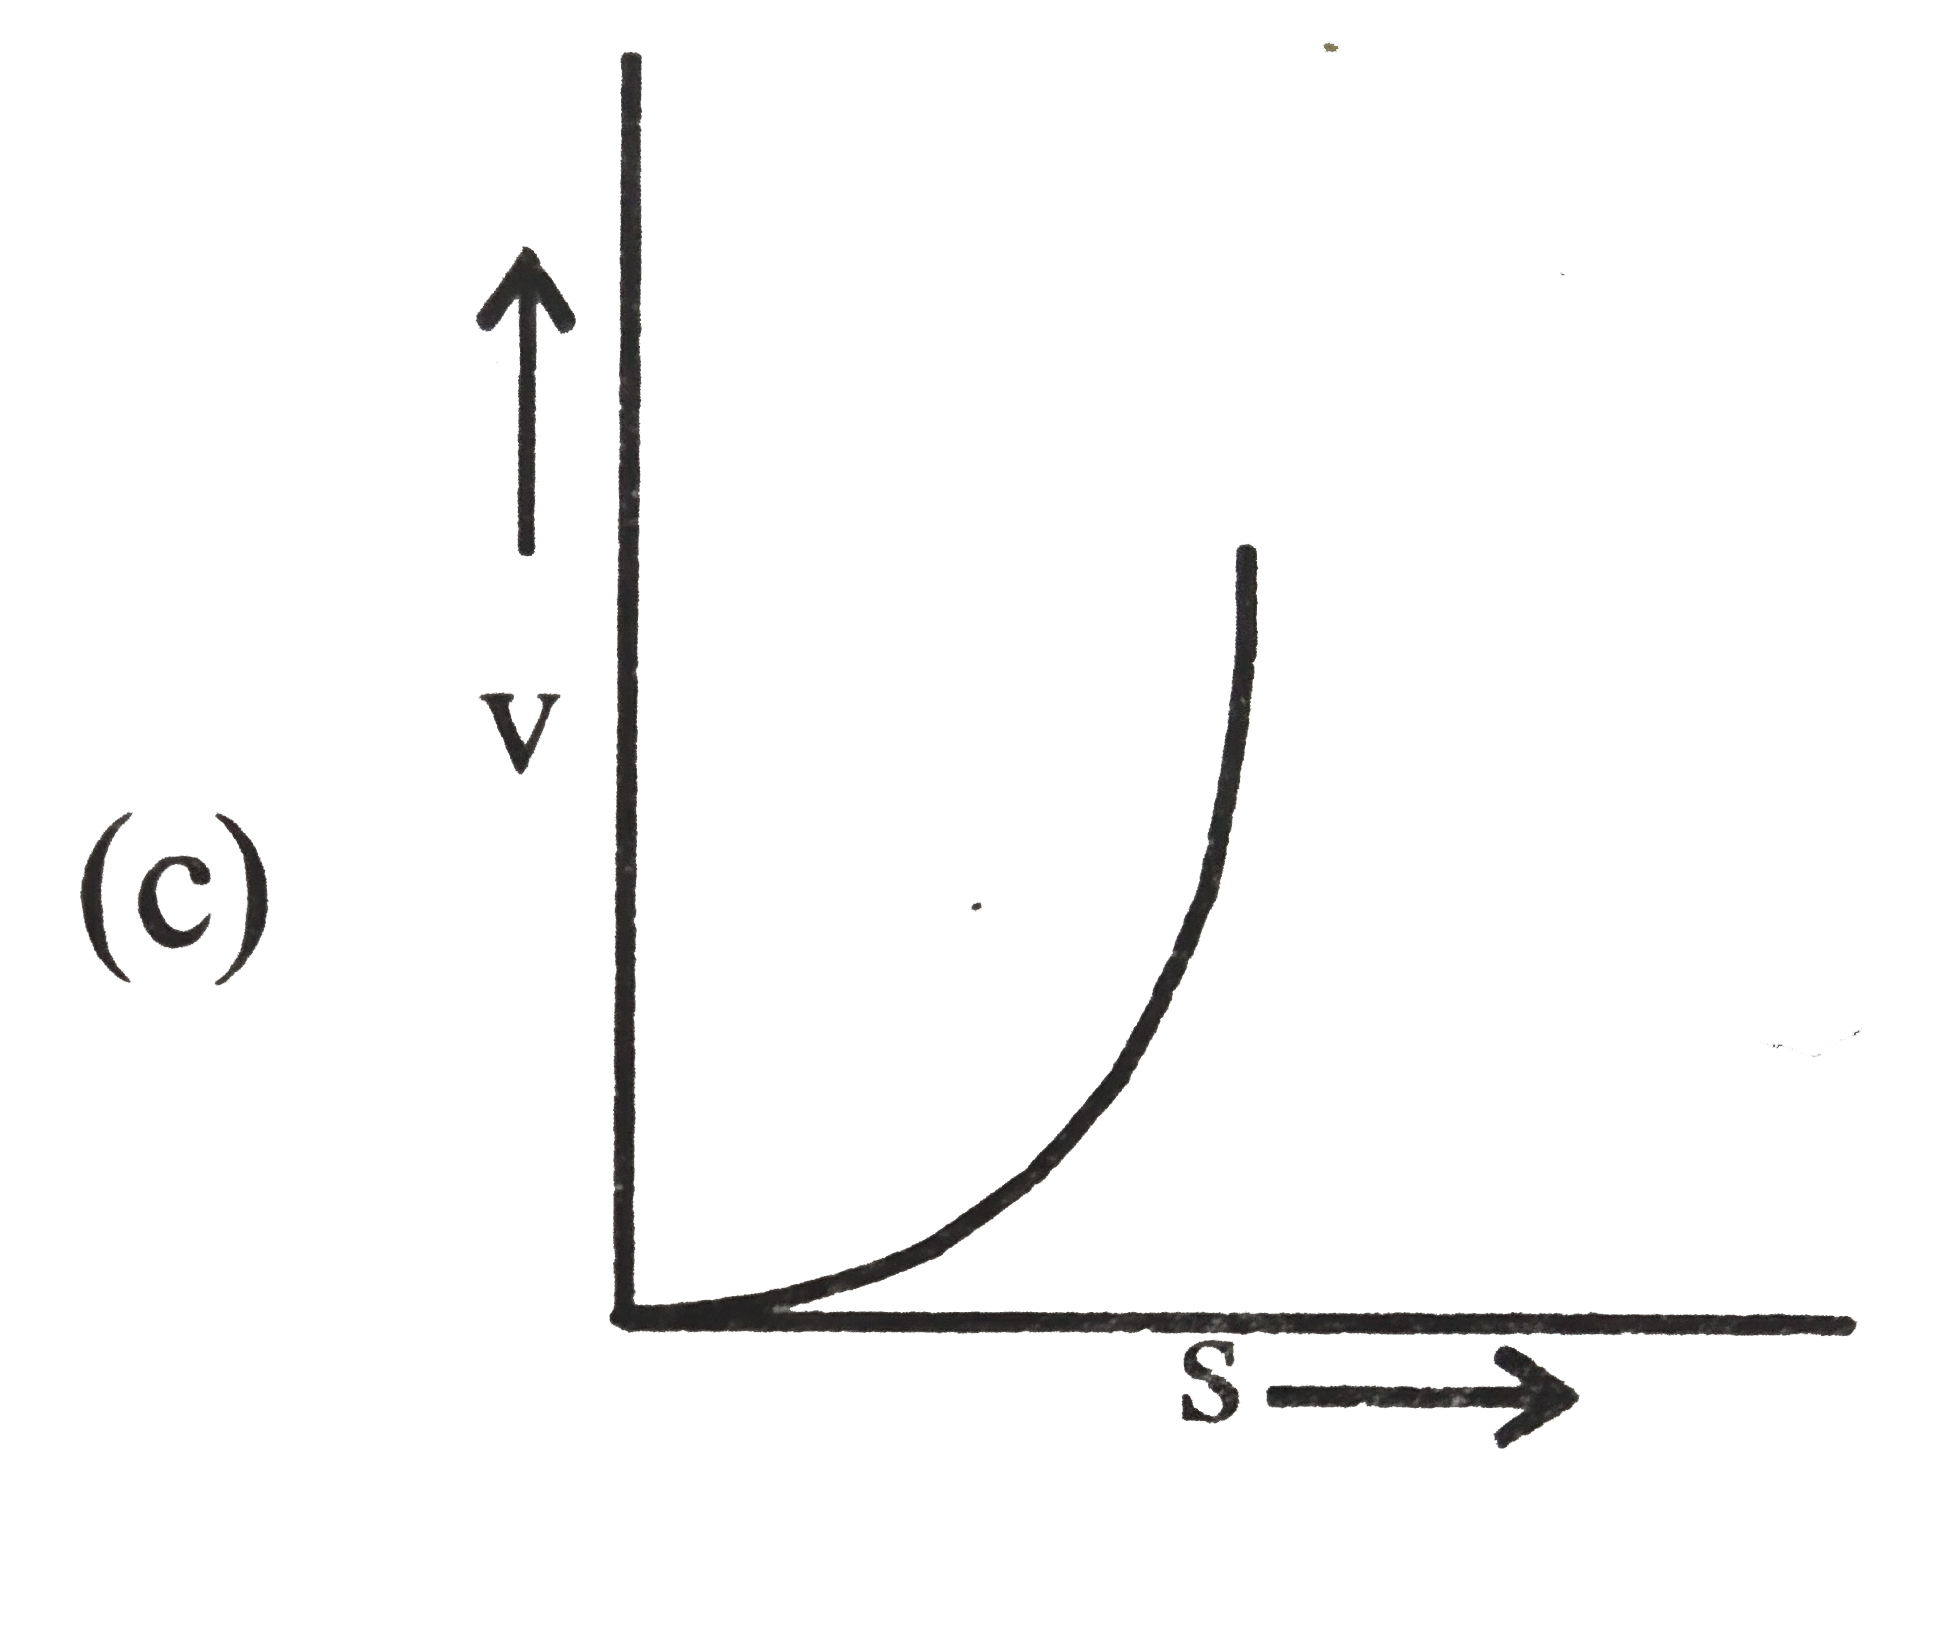 D
D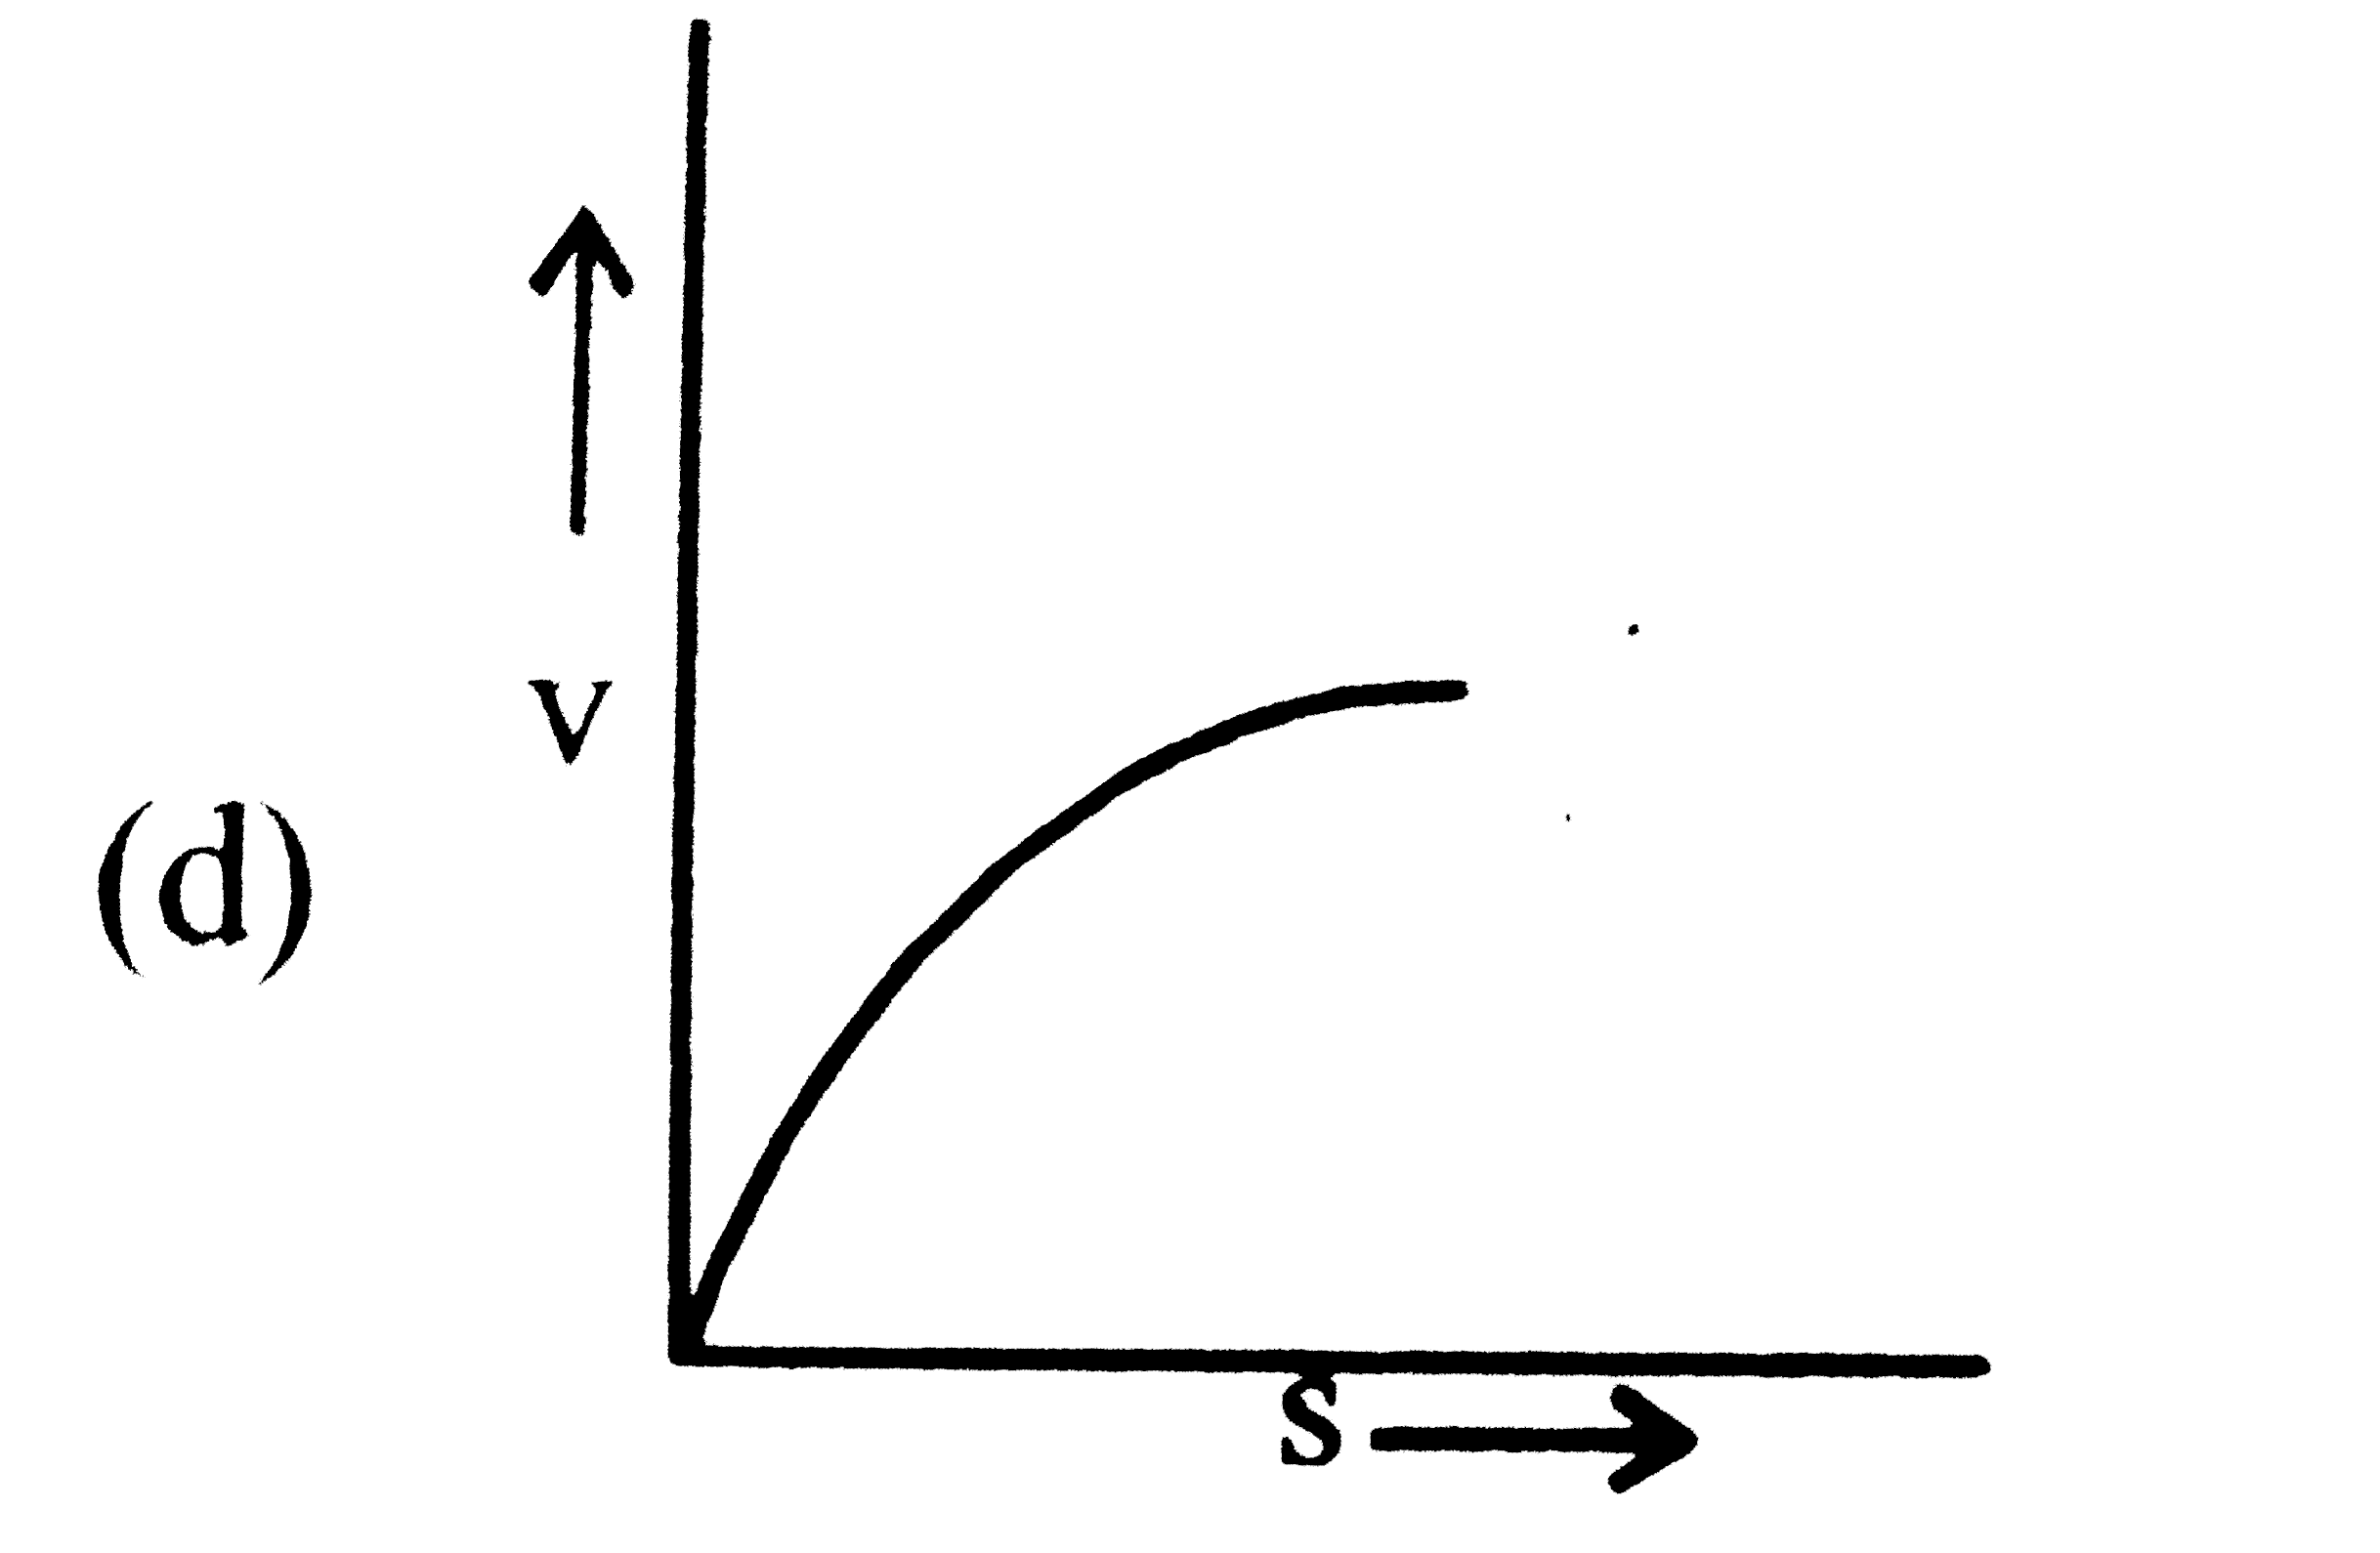
A body starting from the rest moves along a straight line with constant acceleration .Which one of the following graphs represent the variation of speed (v) and distance (s) ?
A B
B C
C D
D
Which one of the following graphs represents the variation of electric field with distance r from the centre of a charged spherical conductor of radius R?
View SolutionWhich of the following graphs best represents the variation of acceleration 'a' with displacement x?
View SolutionThe potential energy U(x) of a particle moving along x−axis is shown in figure. Which one of the following graphs represents the variation of kinetic energy of this particel if its total mechanical enery is E0
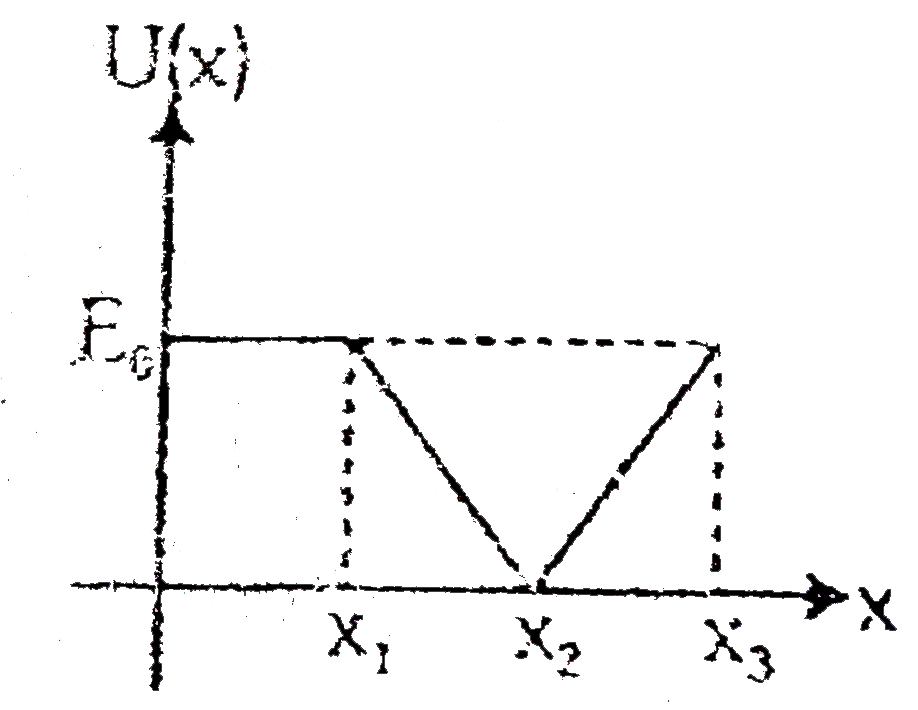
View SolutionWhich of the following graphs represents the graphical relation between momentum (p) and kinetic energy (K) for a body in motion?
View SolutionLiquid oxygen at 50K is heated to 300K at constant pressure of 1atm. The rate of heating is constant. Which of the following graphs represents the variation of temperature with time?
View Solution

