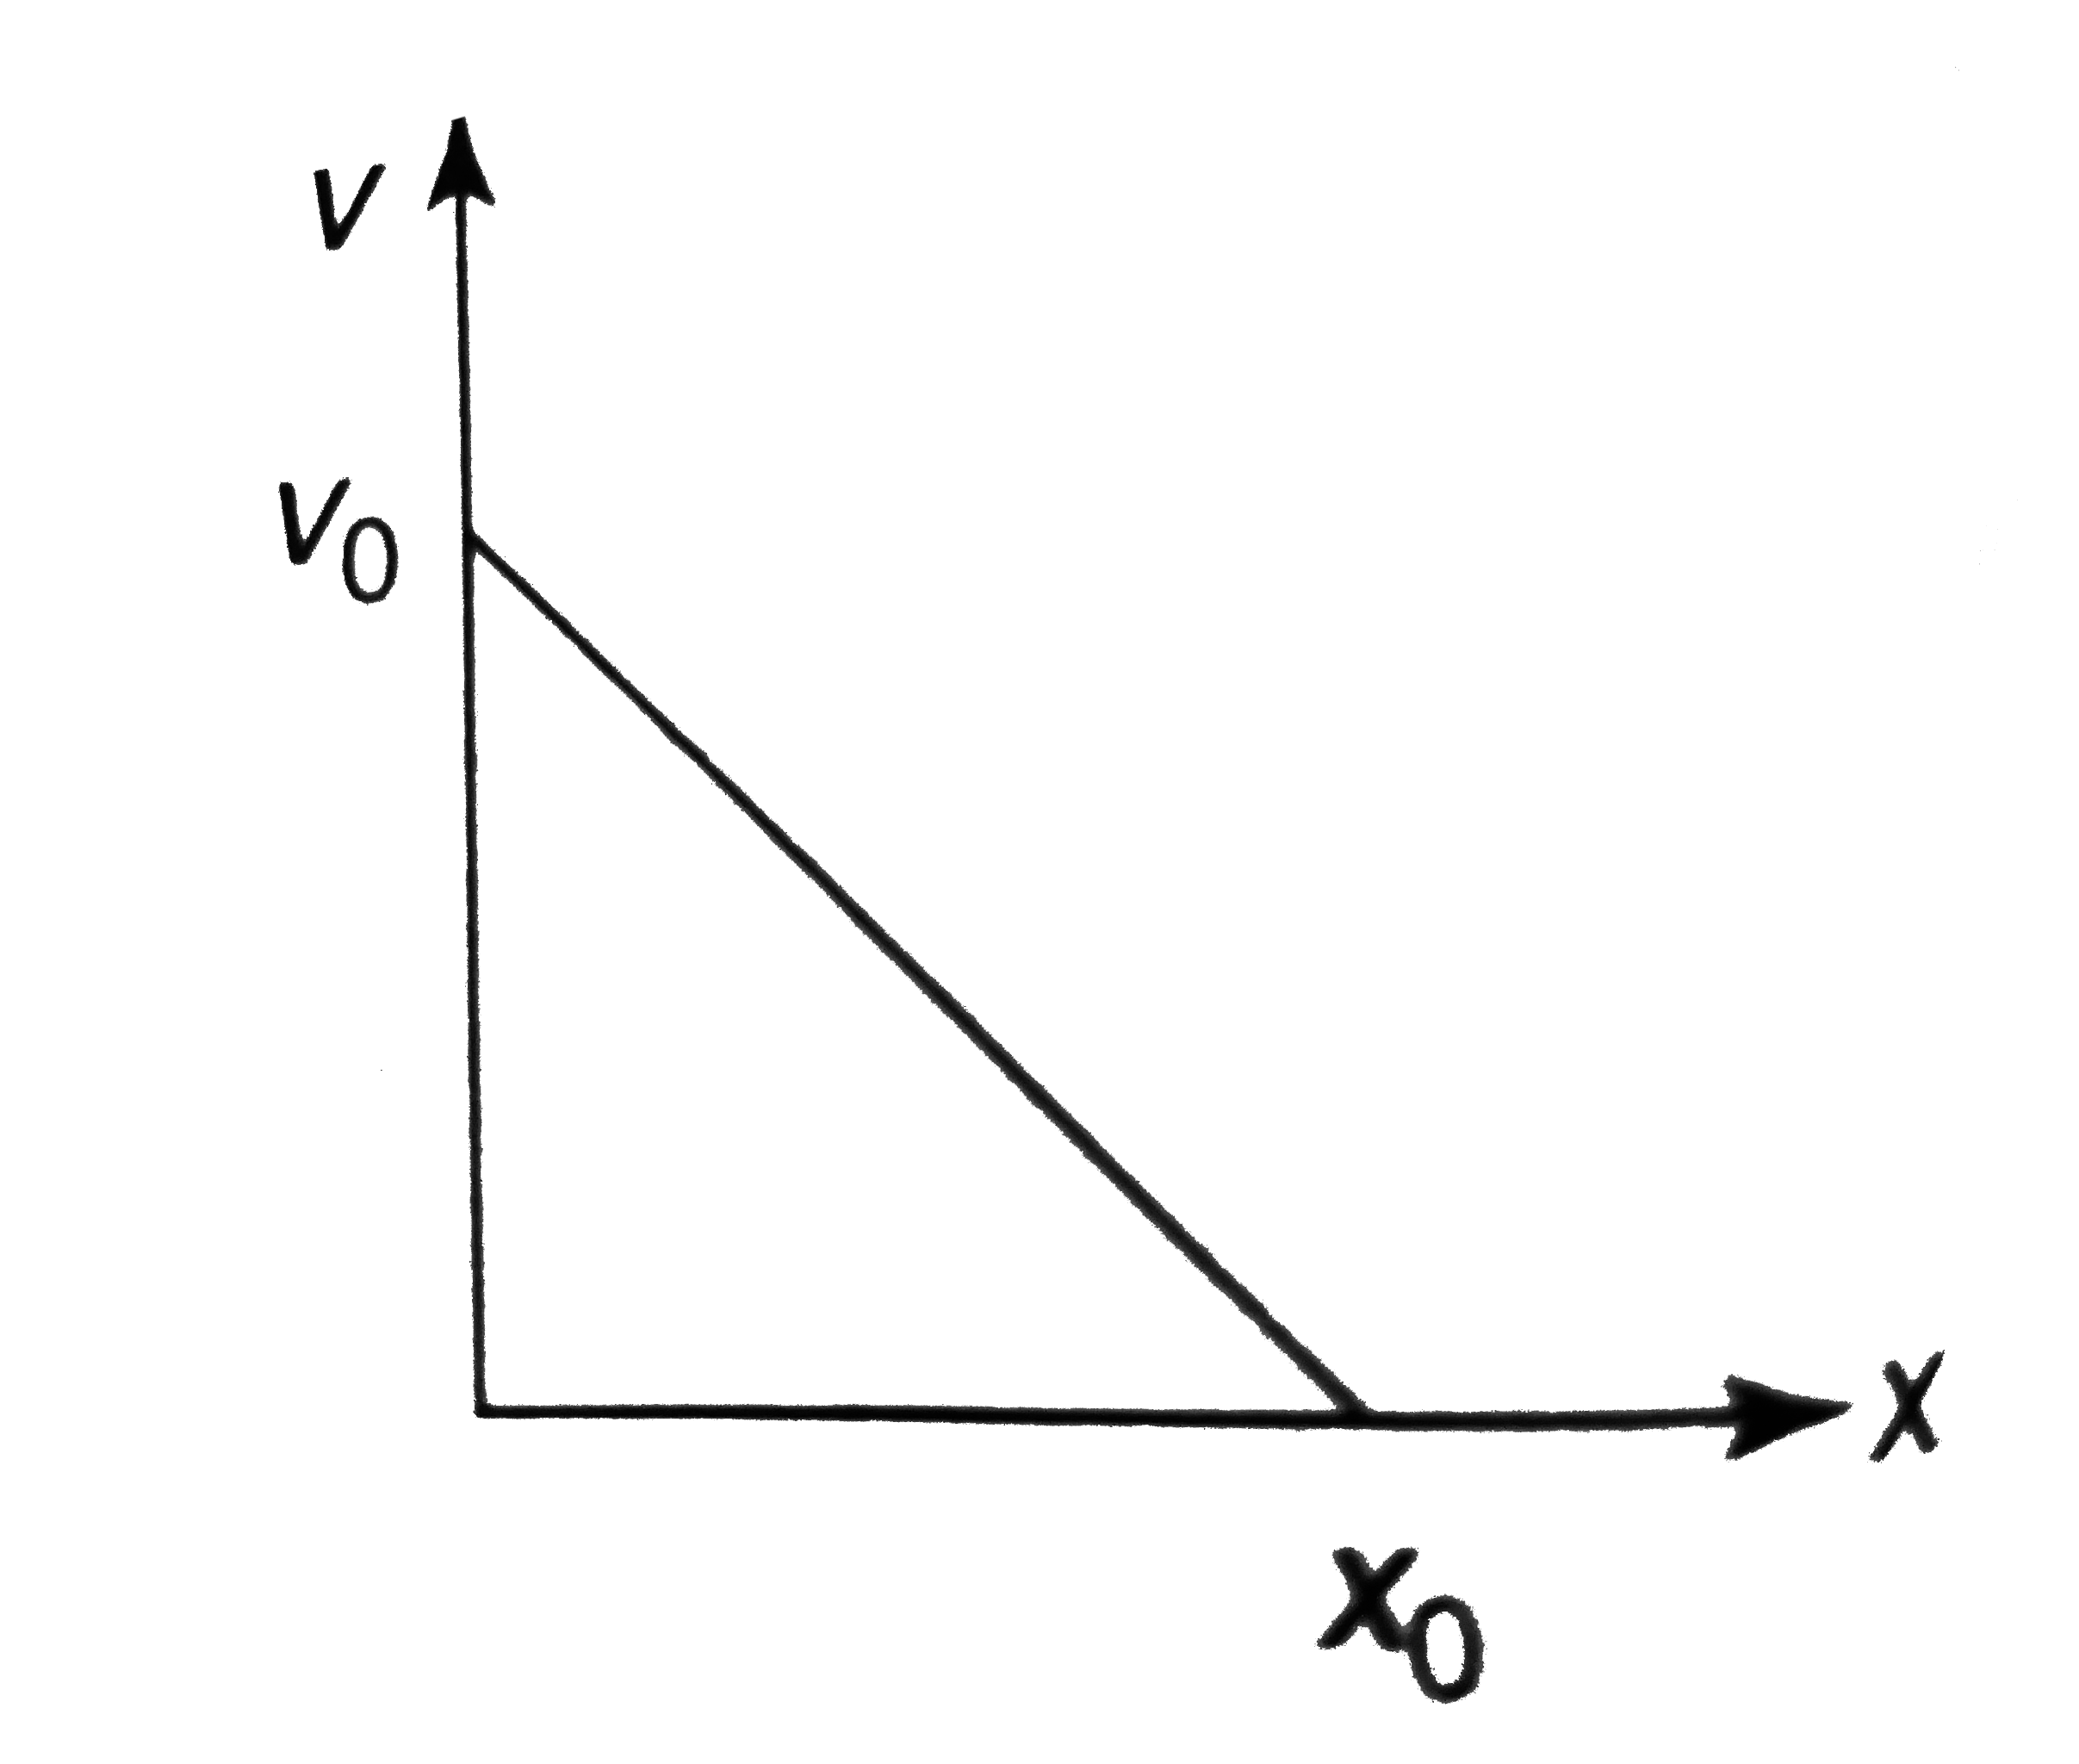
The given graph shows the variation of velocity with displacement. Which one of the graphs given below correctly represents the variation of acceleration with displacement ?


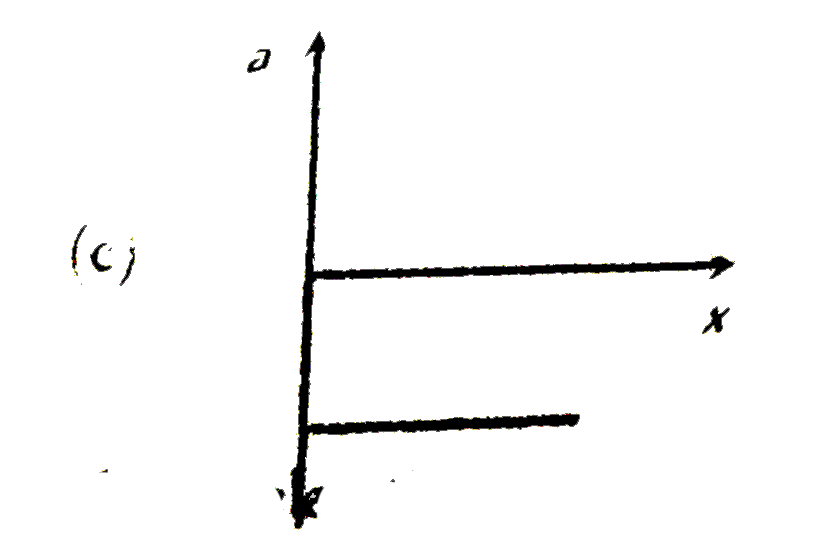

The correct Answer is:A
Step by step video, text & image solution for The given graph shows the variation of velocity with displacement. Which one of the graphs given below correctly represents the variation of acceleration with displacement ? by Physics experts to help you in doubts & scoring excellent marks in Class 11 exams.
Updated on:21/07/2023Topper's Solved these Questions
- MOTION IN ONE DIMENSIONBook:ERRORLESS Chapter:MOTION IN ONE DIMENSIONExercise:Graphical Questions
Explore 23 Videos
- MOTION IN ONE DIMENSIONBook:ERRORLESS Chapter:MOTION IN ONE DIMENSIONExercise:Assertion & Reason
Explore 30 Videos
- MOTION IN ONE DIMENSIONBook:ERRORLESS Chapter:MOTION IN ONE DIMENSIONExercise:Motion Under Gravity
Explore 81 Videos
- GRAVITATIONBook:ERRORLESS Chapter:GRAVITATIONExercise:SET
Explore 27 Videos
- MOTION IN TWO DIMENSIONBook:ERRORLESS Chapter:MOTION IN TWO DIMENSIONExercise:Exercise
Explore 319 Videos
Similar Questions
Knowledge Check
Which of the following graphs best represents the variation of acceleration 'a' with displacement x?
A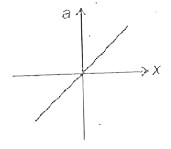 B
B C
C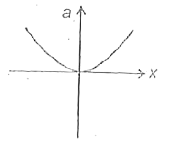 D
D
The velocity -displacement graph of a particle is as shown in the figure. Which of the following graphs correctly represents the variation of acceleration with displacement?
 A
A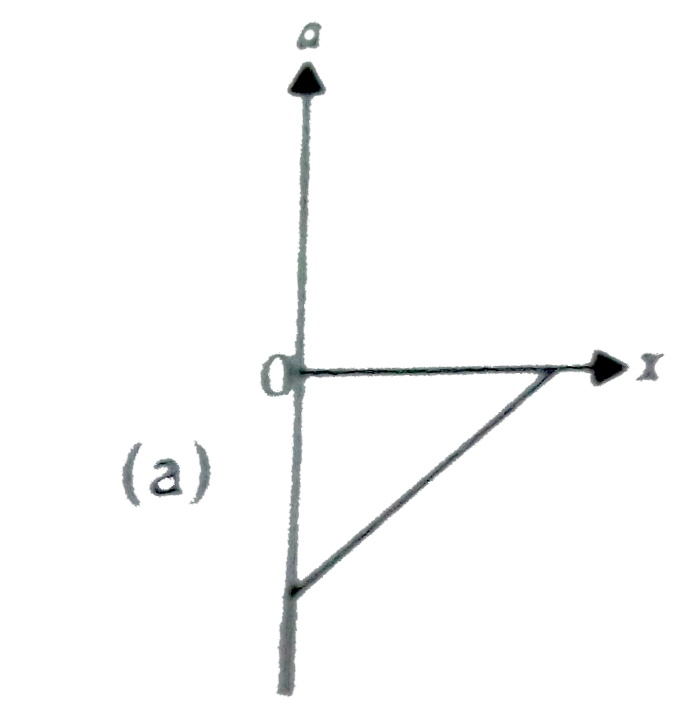 B
B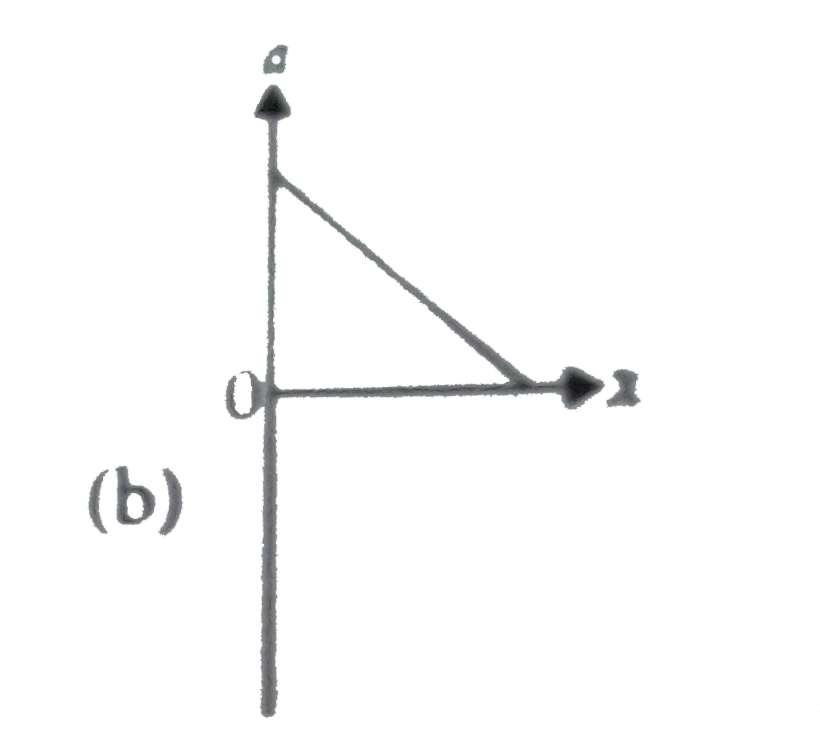 C
C D
D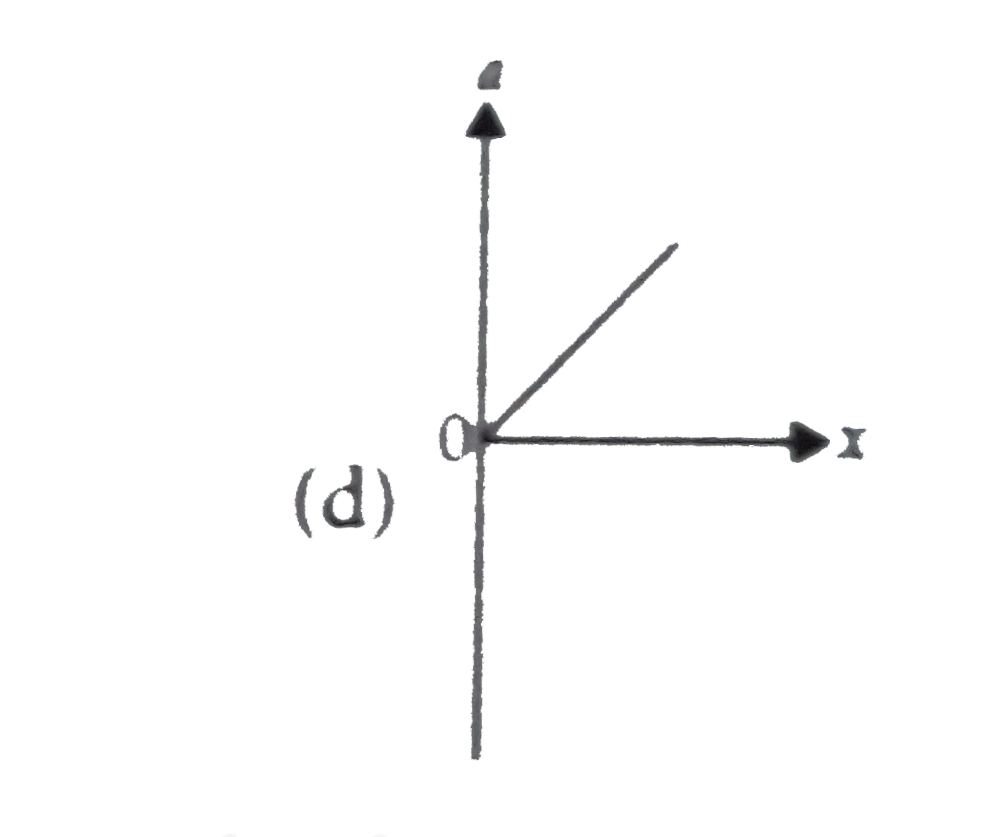
The graph shown the variation with times t of the velocity v of an object . Which one of the following graphs best represents the variation of acceleration a of the object with time t?
 A
A B
B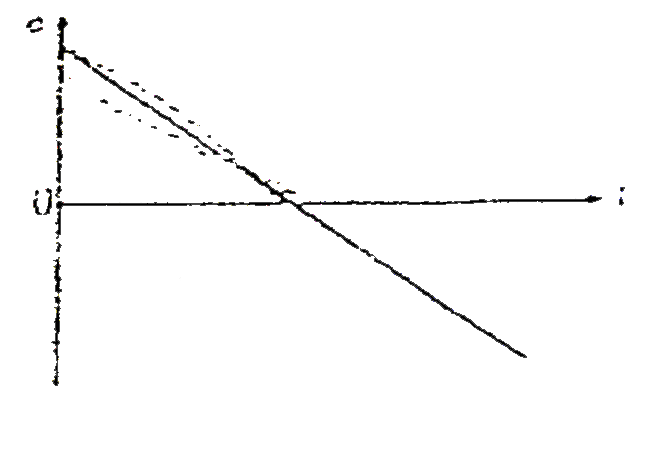 C
C D
D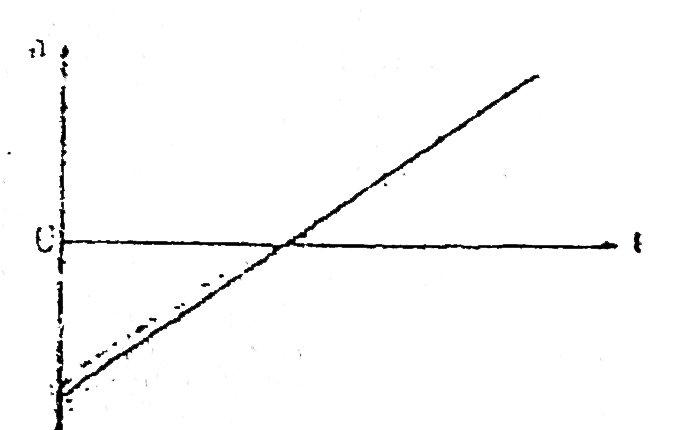
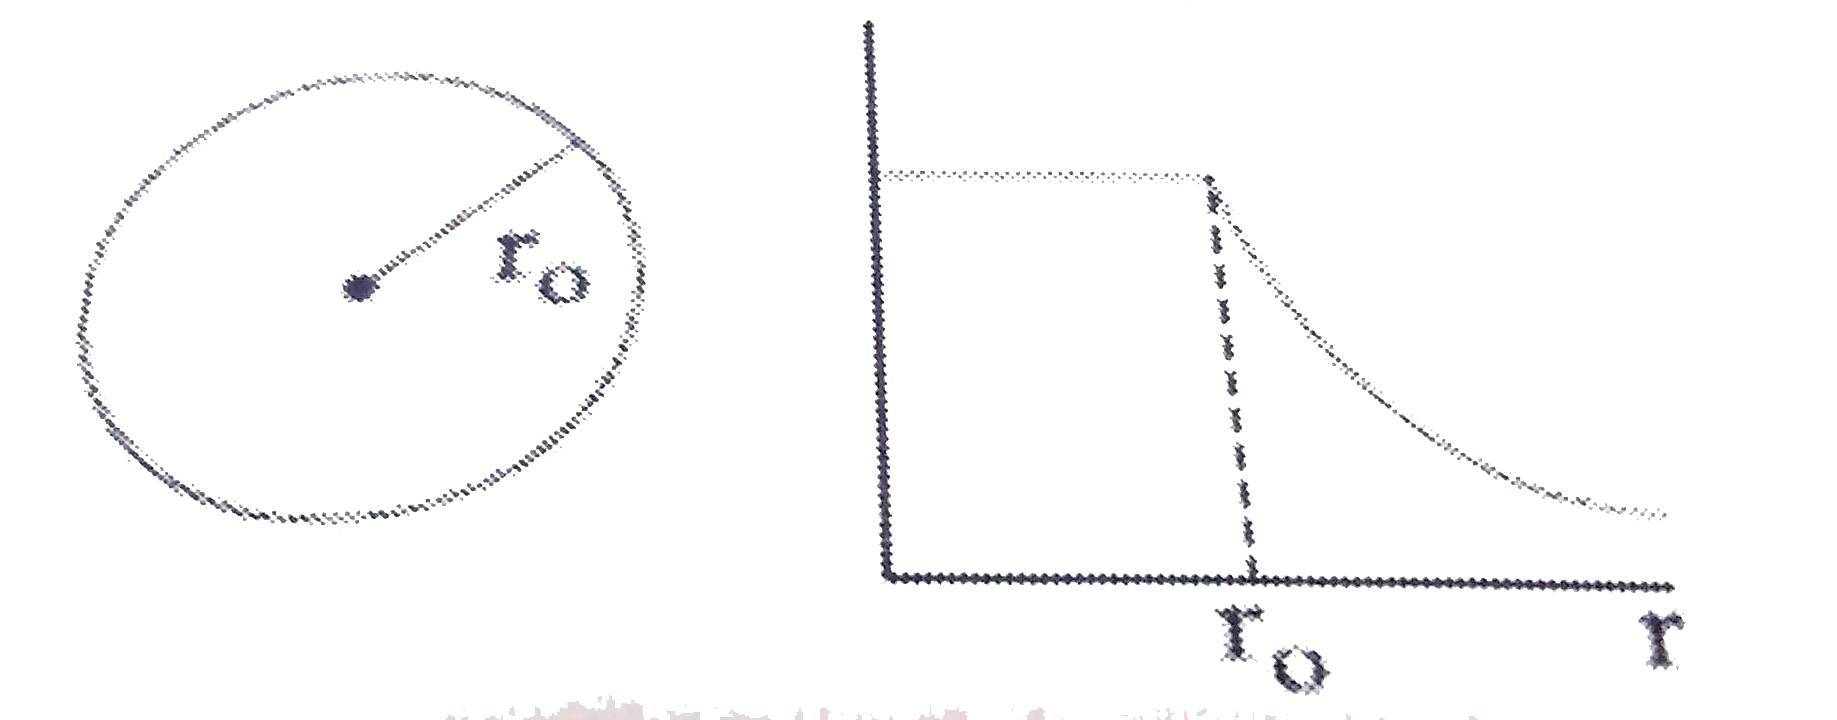
The given graph shows variation (with distance r form center) of :
View Solution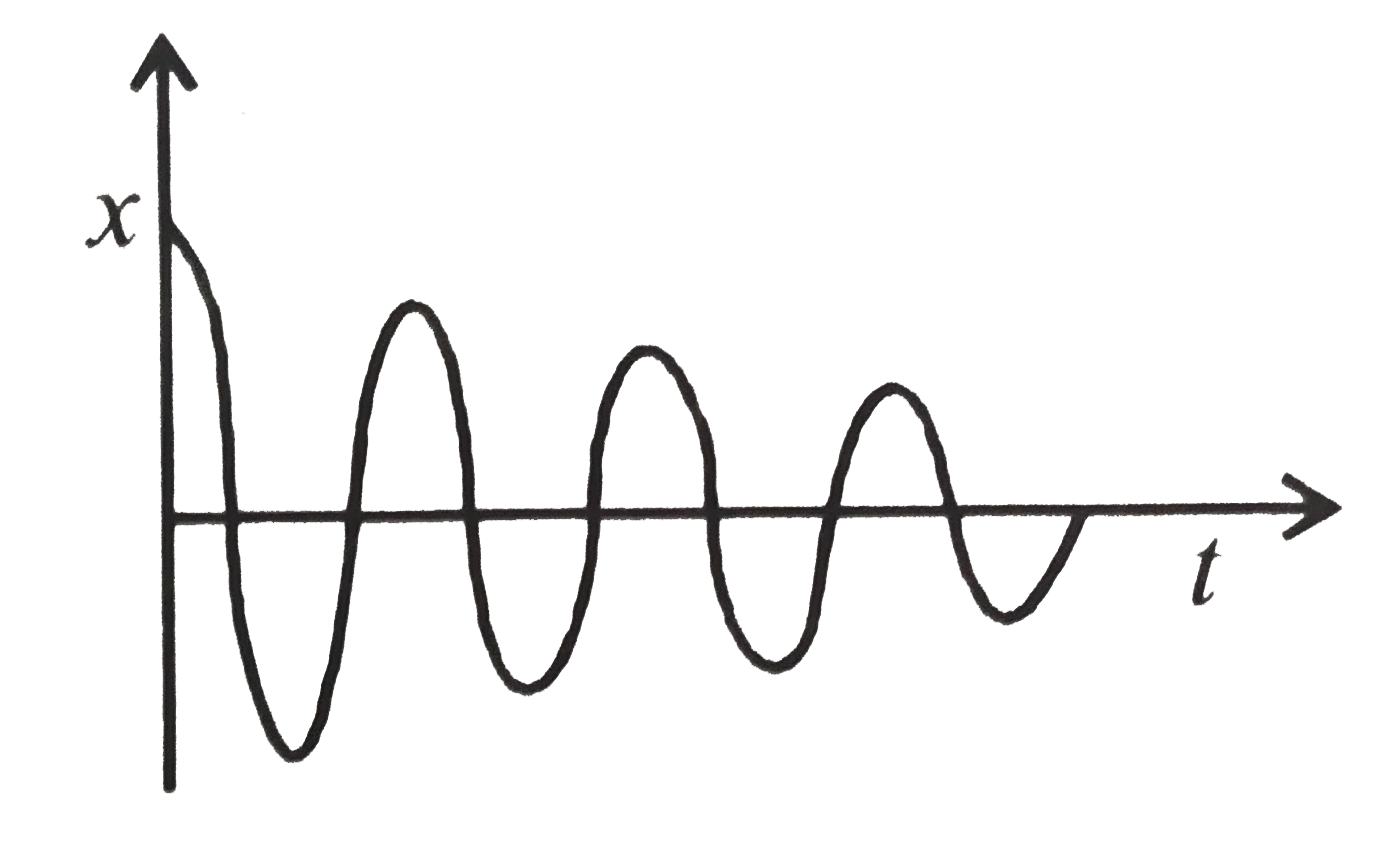
The displacement (x)-time (t) graph given above approximately represents the motion of a
View SolutionWhich of following graphs correctly represents the variation of particle momentum with de-Broglie wavelength?
View SolutionGraph between velocity and displacement is shown in the following figure:
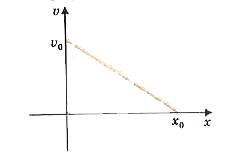
Which of the following graphes represents the correct variation of acceleration with displacement
View SolutionWhich of the following graphs correctly represents the variation of particle momentum with associated de Broglie wavelength?
View Solution


