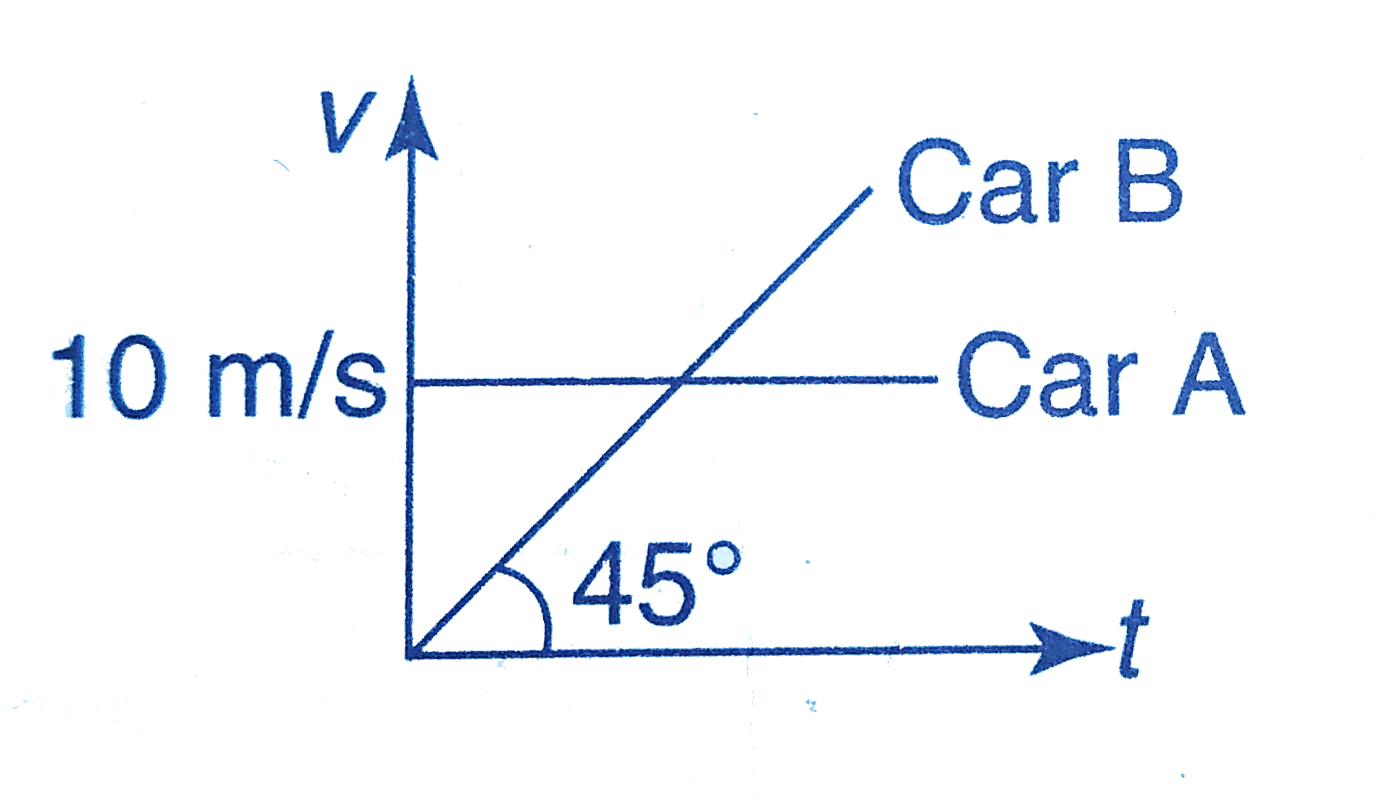
Initially car A is 10.5m ahead of car B. Both start moving at time t=0 in the same direction along a straight line. The velocity-time graph of two cars is shown in figure. The time when the car B will catch the car A, will be.
t−21 sec
t=2√5 sec
20 sec
None of these
The correct Answer is:A
SB=SA+10.5
t22=10t+10.5
t2=20t+21
t2−20t−21=0
t=21 sec
Topper's Solved these Questions
- KINEMATICSBook:ALLENChapter:KINEMATICSExercise:EXERCISE-02
Explore 57 Videos
- KINEMATICSBook:ALLENChapter:KINEMATICSExercise:EXERCISE-03
Explore 6 Videos
- KINEMATICSBook:ALLENChapter:KINEMATICSExercise:Integer Type Question
Explore 3 Videos
- ERROR AND MEASUREMENTBook:ALLENChapter:ERROR AND MEASUREMENTExercise:Part-2(Exercise-2)(B)
Explore 22 Videos
- KINEMATICS (MOTION ALONG A STRAIGHT LINE AND MOTION IN A PLANE)Book:ALLENChapter:KINEMATICS (MOTION ALONG A STRAIGHT LINE AND MOTION IN A PLANE)Exercise:BEGINNER S BOX-7
Explore 8 Videos
Similar Questions
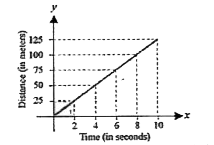
The distance versus time graph of a car is shown in the given figure.
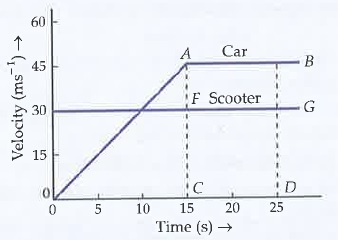
View SolutionAs soon as a car just starts from rest in a certain direction, a scooter moving with a uniform speed overtakes the car. Their velocity-time graphs are shown in Fig. 3.66. Calculate the time when the car will catch up the scooter.
View Solution
Knowledge Check
The velocity time graph of the motion of a car is given here.
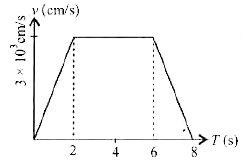 AThe distance travelled by the car in the first six seconds is 150 m.BThe deceleration of the car during the last two seconds are −15ms2.CThe distance travelled by the car in the first six second is 220 m.DThe deceleration of the car during the last two second is −20ms2
Figure shows position-time graph of two cars A and B.
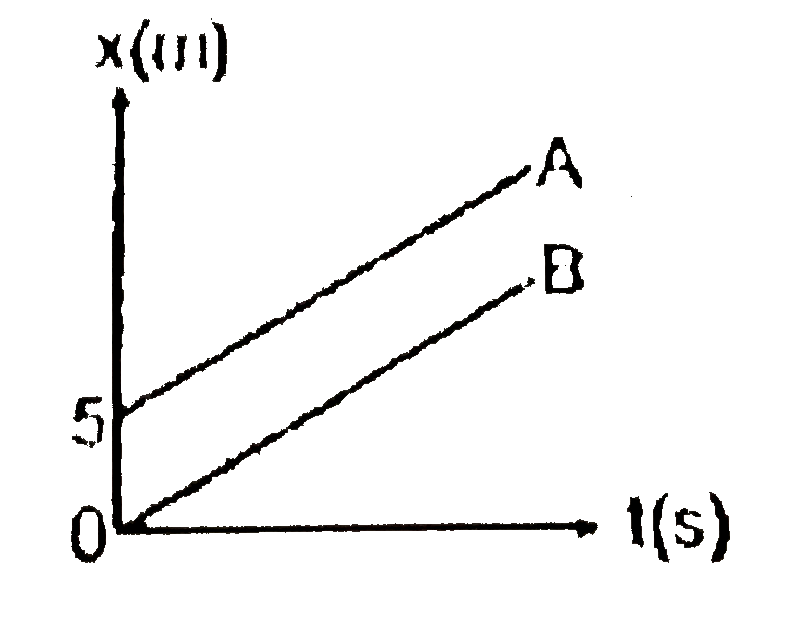 ACar A is faster than car B.BCar B is faster than car A.CBoth cars are moving with same velocity.DBoth cars have positive acceleration.
Velocity-time graph for a car is semicircle as shown here. Which of the following is correct:
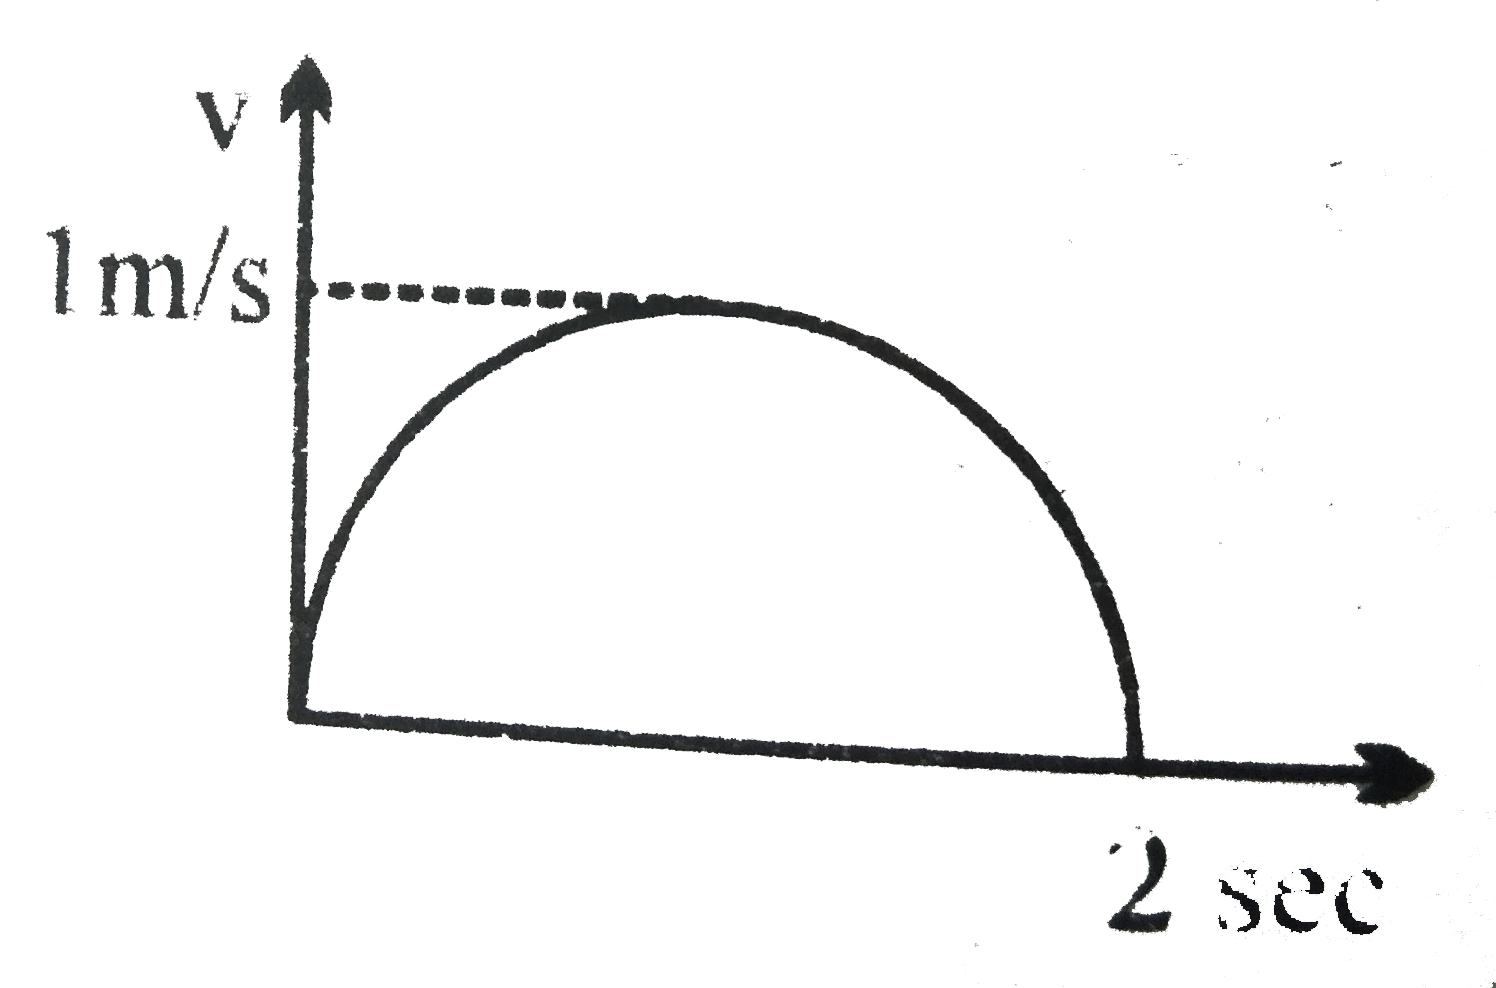 ACar must move in circular path.BAcceleration of car is never zero.CMean spped of the aprticel is π/4m/s.DThe car makes a turn once during its motion.
Two cars A and B start from a same point at same instant of time and move in same direction. The variation of their respective velocities with time is indicated in the graph as shown in the figure. The time after their motion starts, when the cars cross each other is?
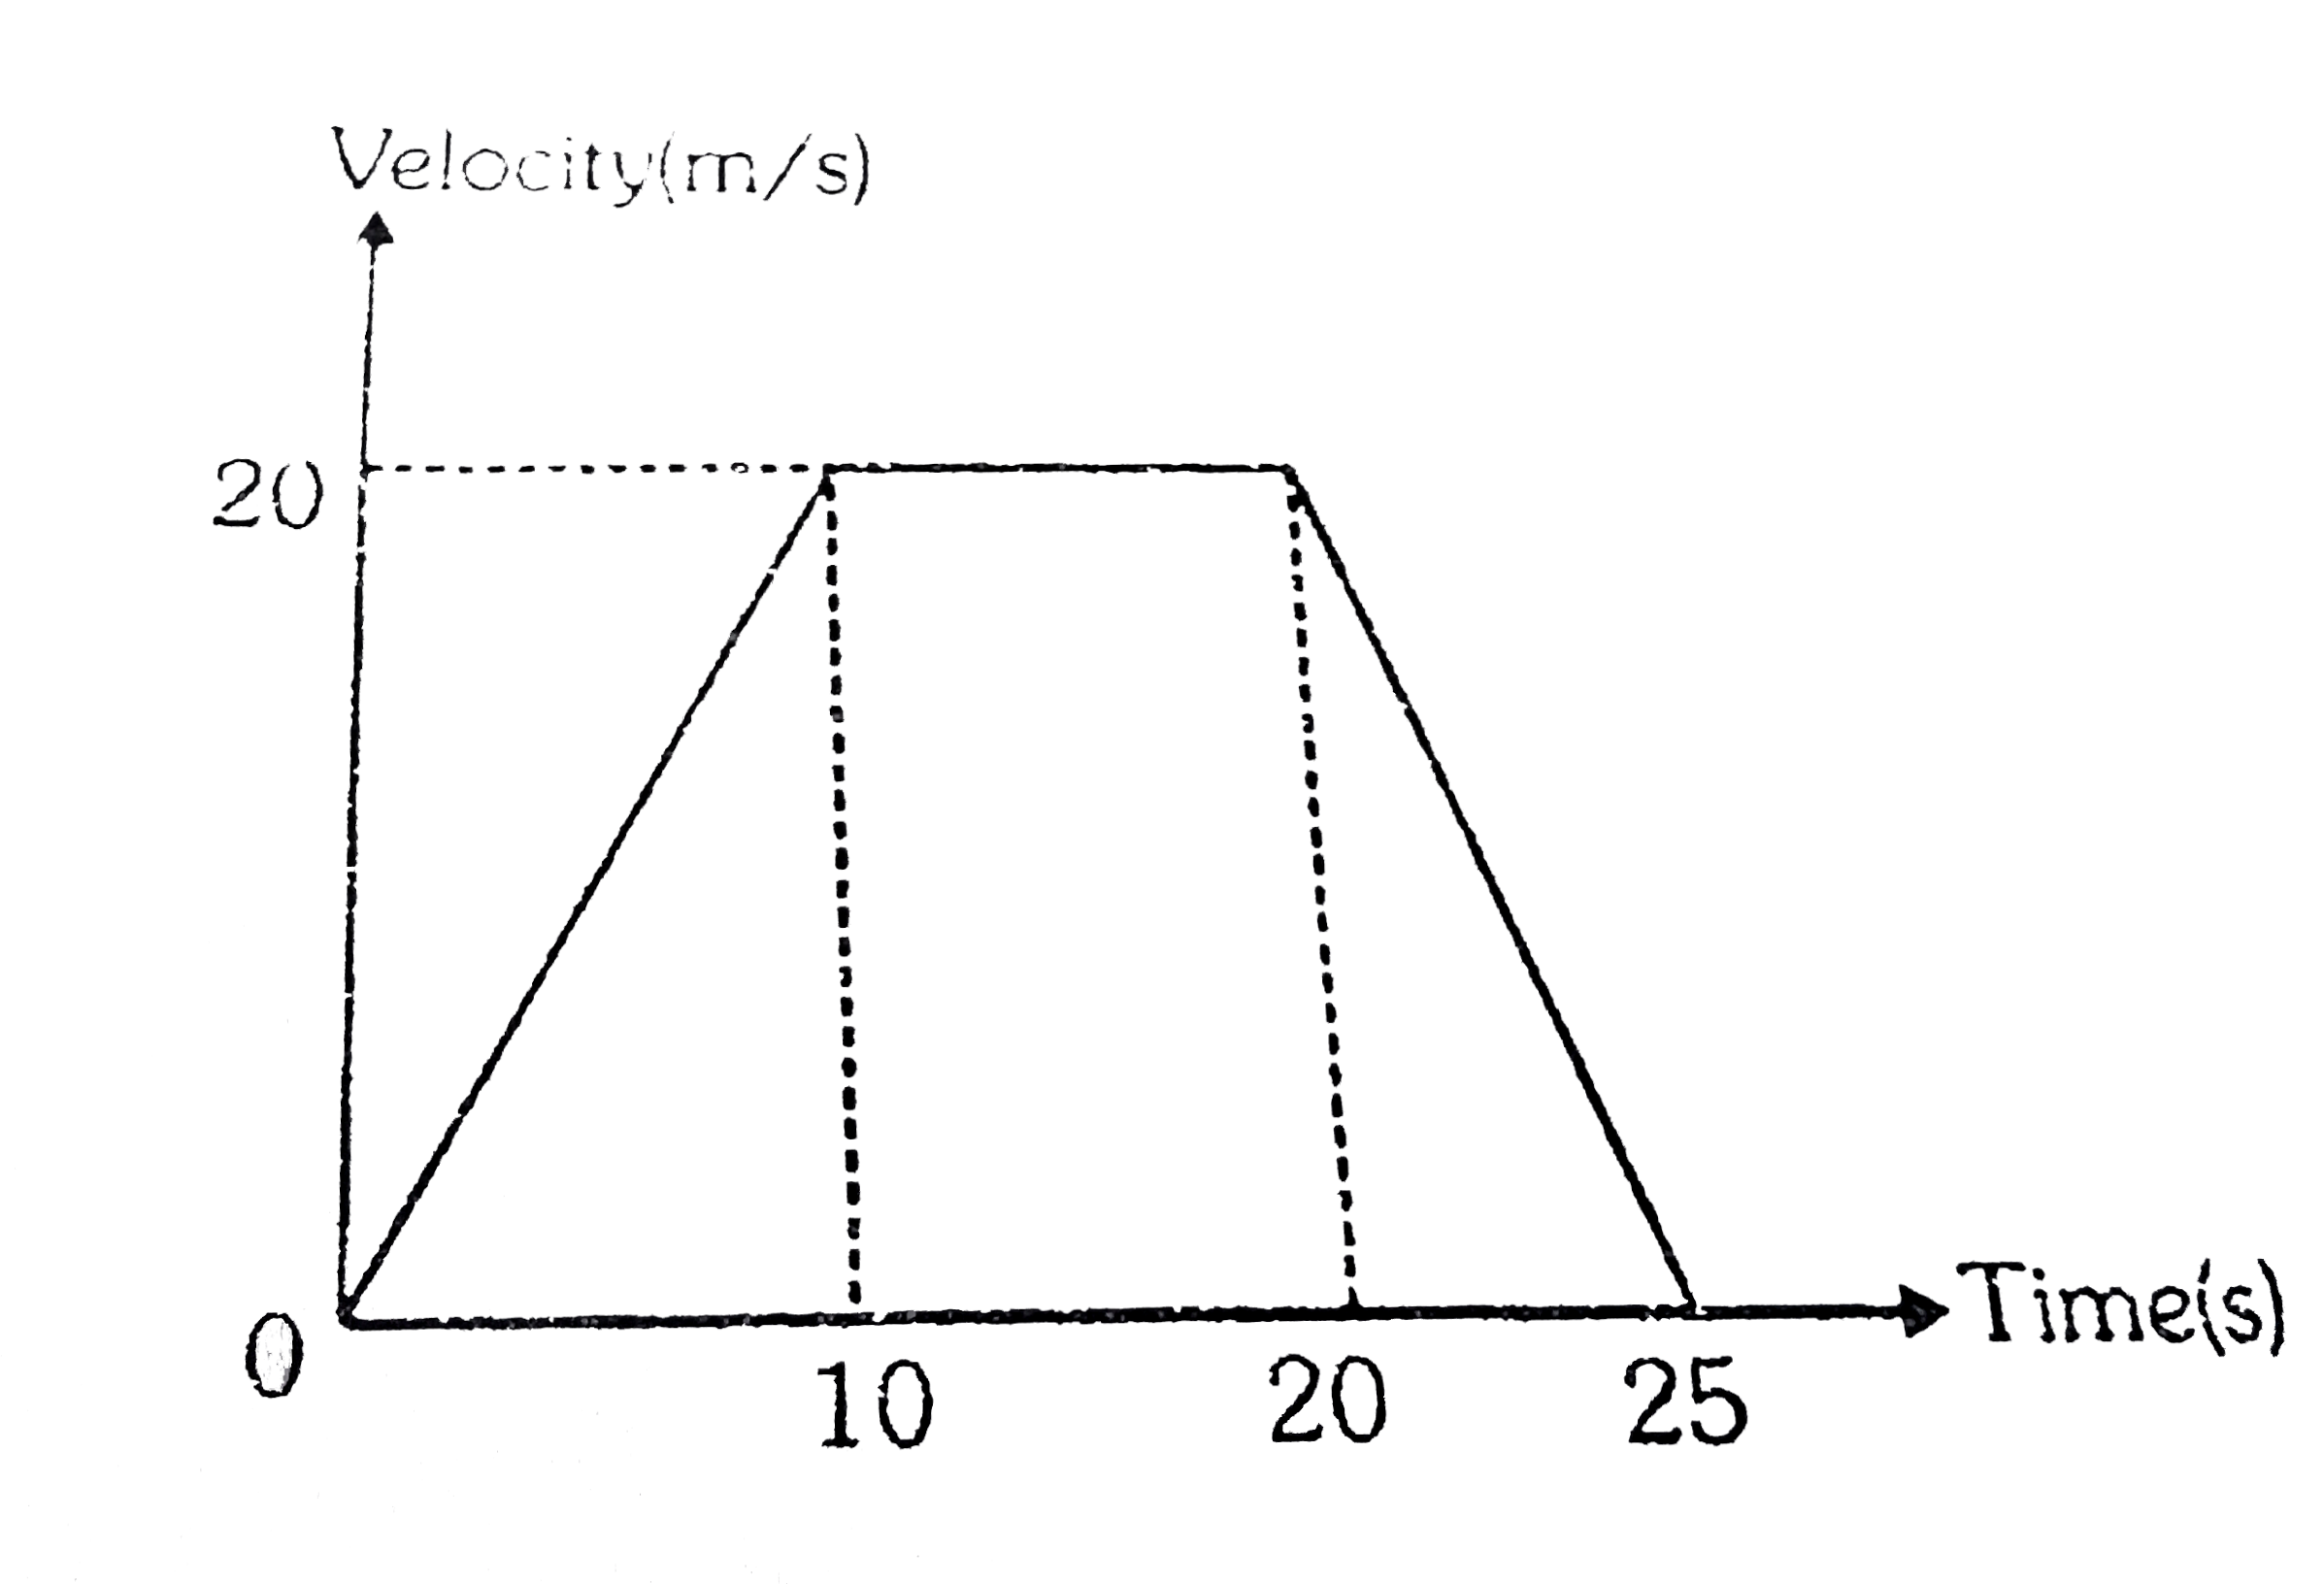
View SolutionThe velocity-time graph of a car moving along a straight road is shown in figure. The average velocity of the car in first 25 seconds is
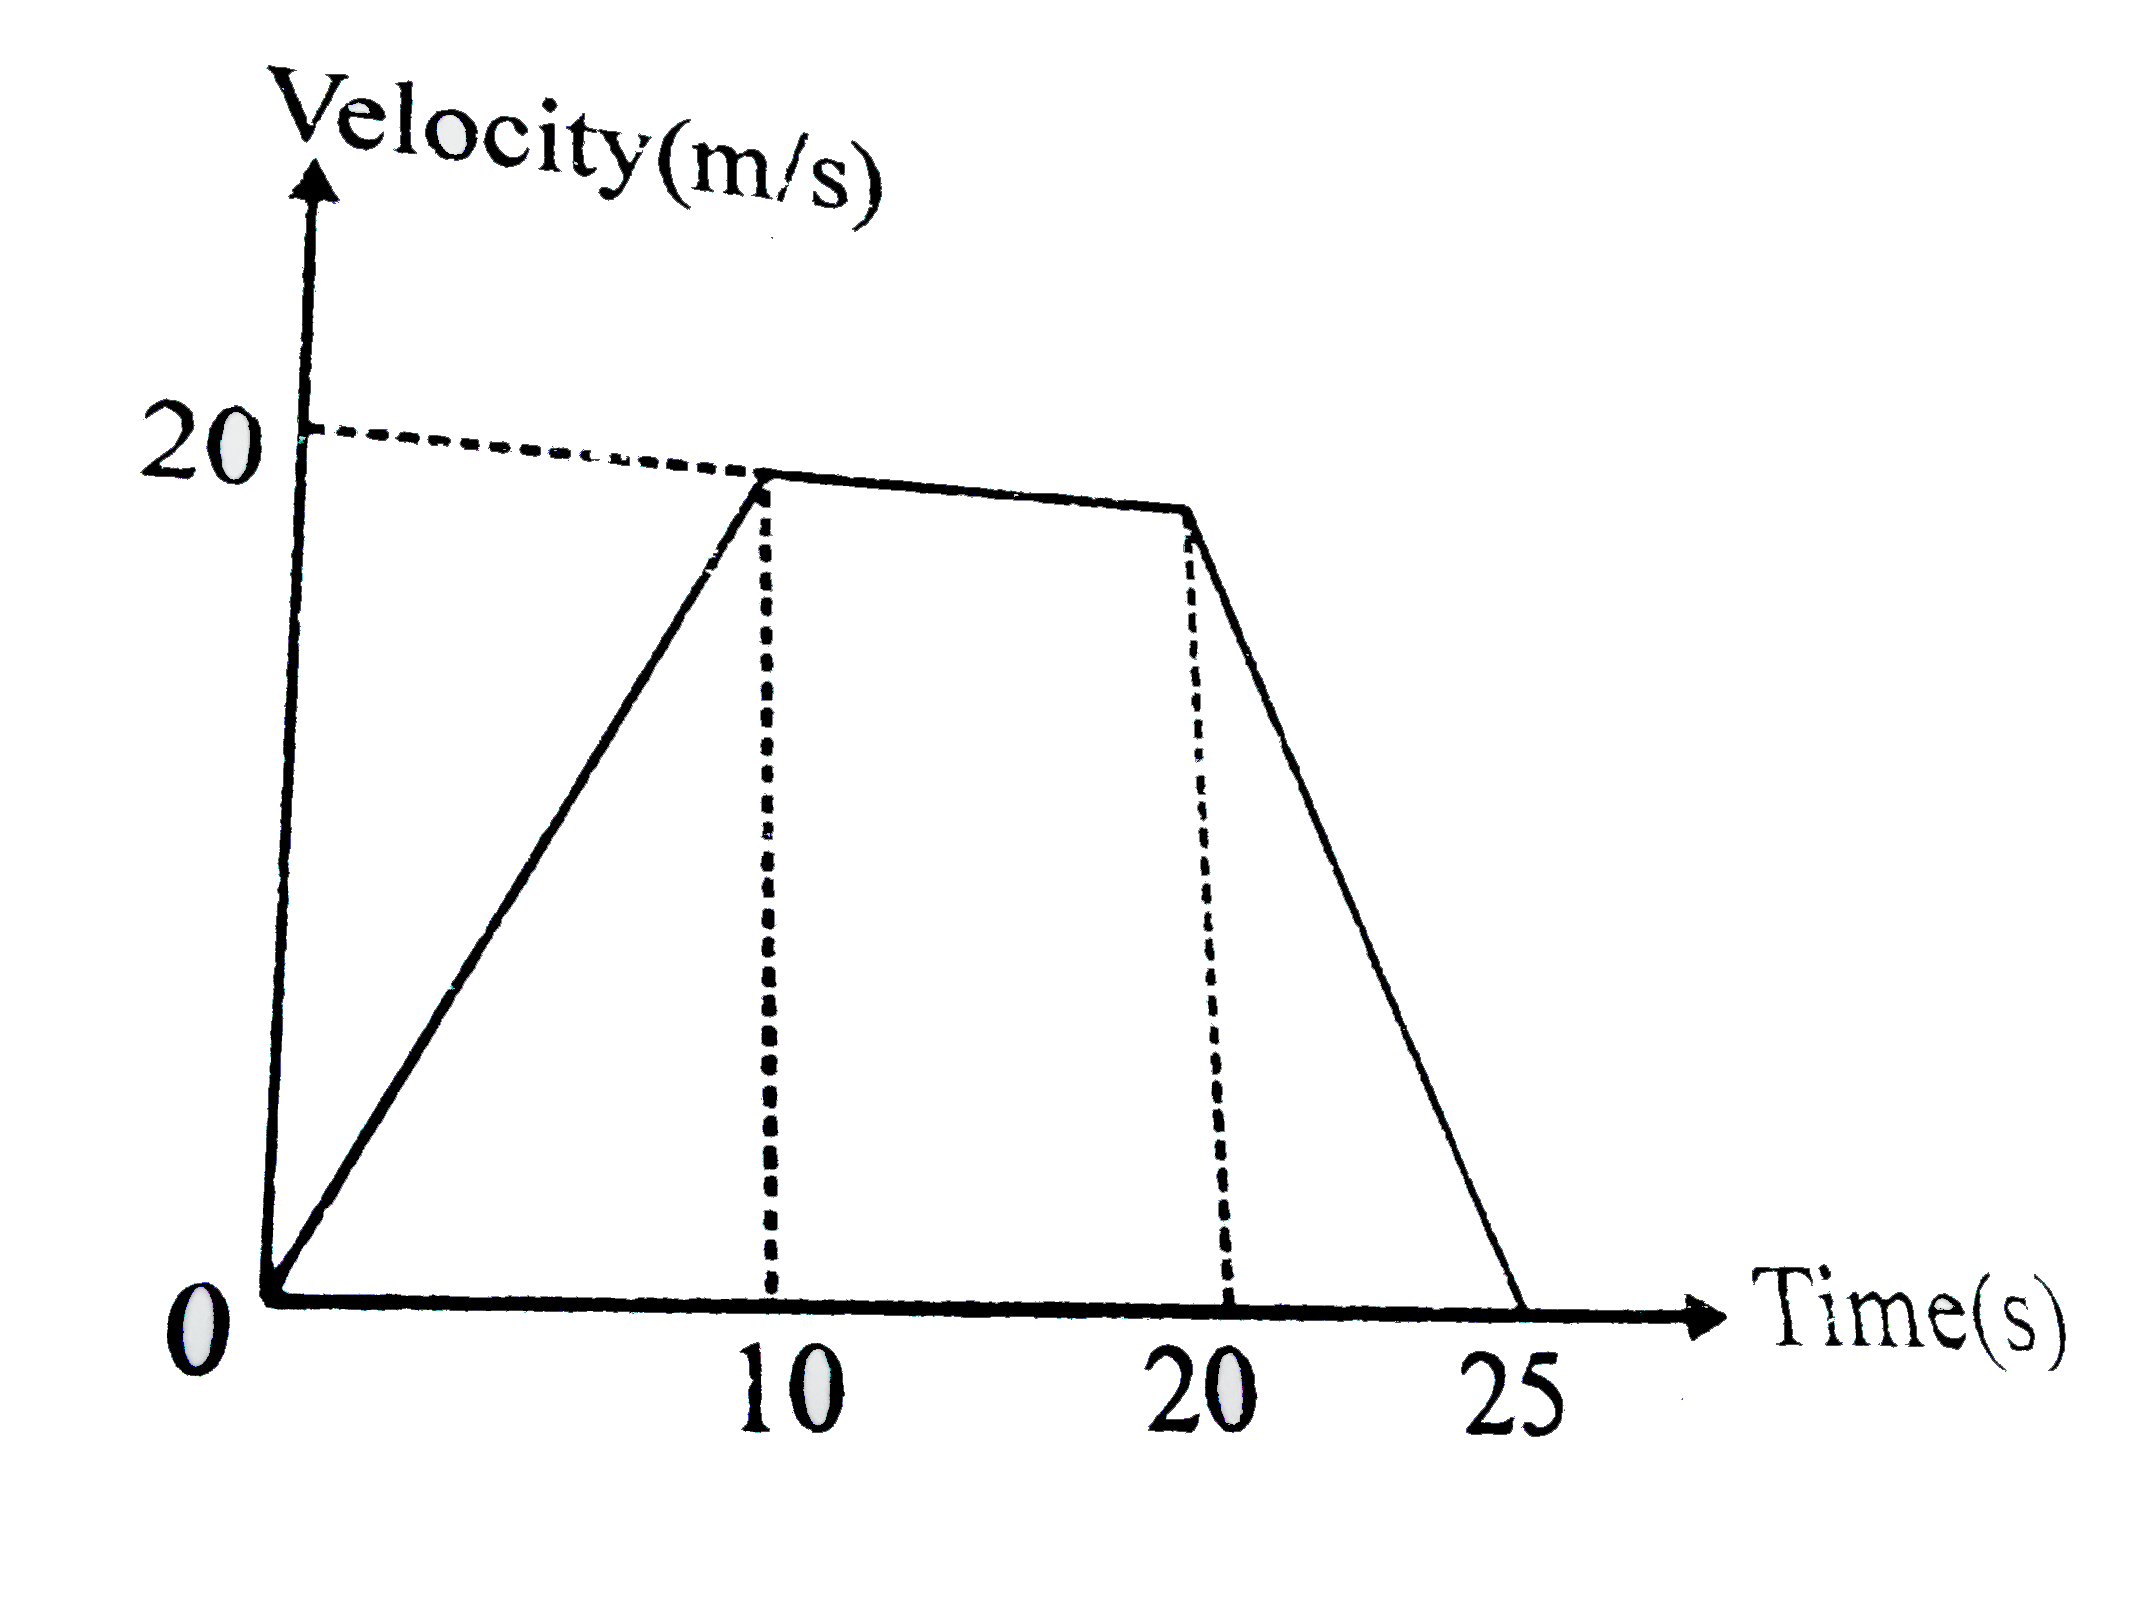
View SolutionThe velocity-time graph of a car moving along a straight road is shown in figure. The average velocity of the car is first 25 seconds is
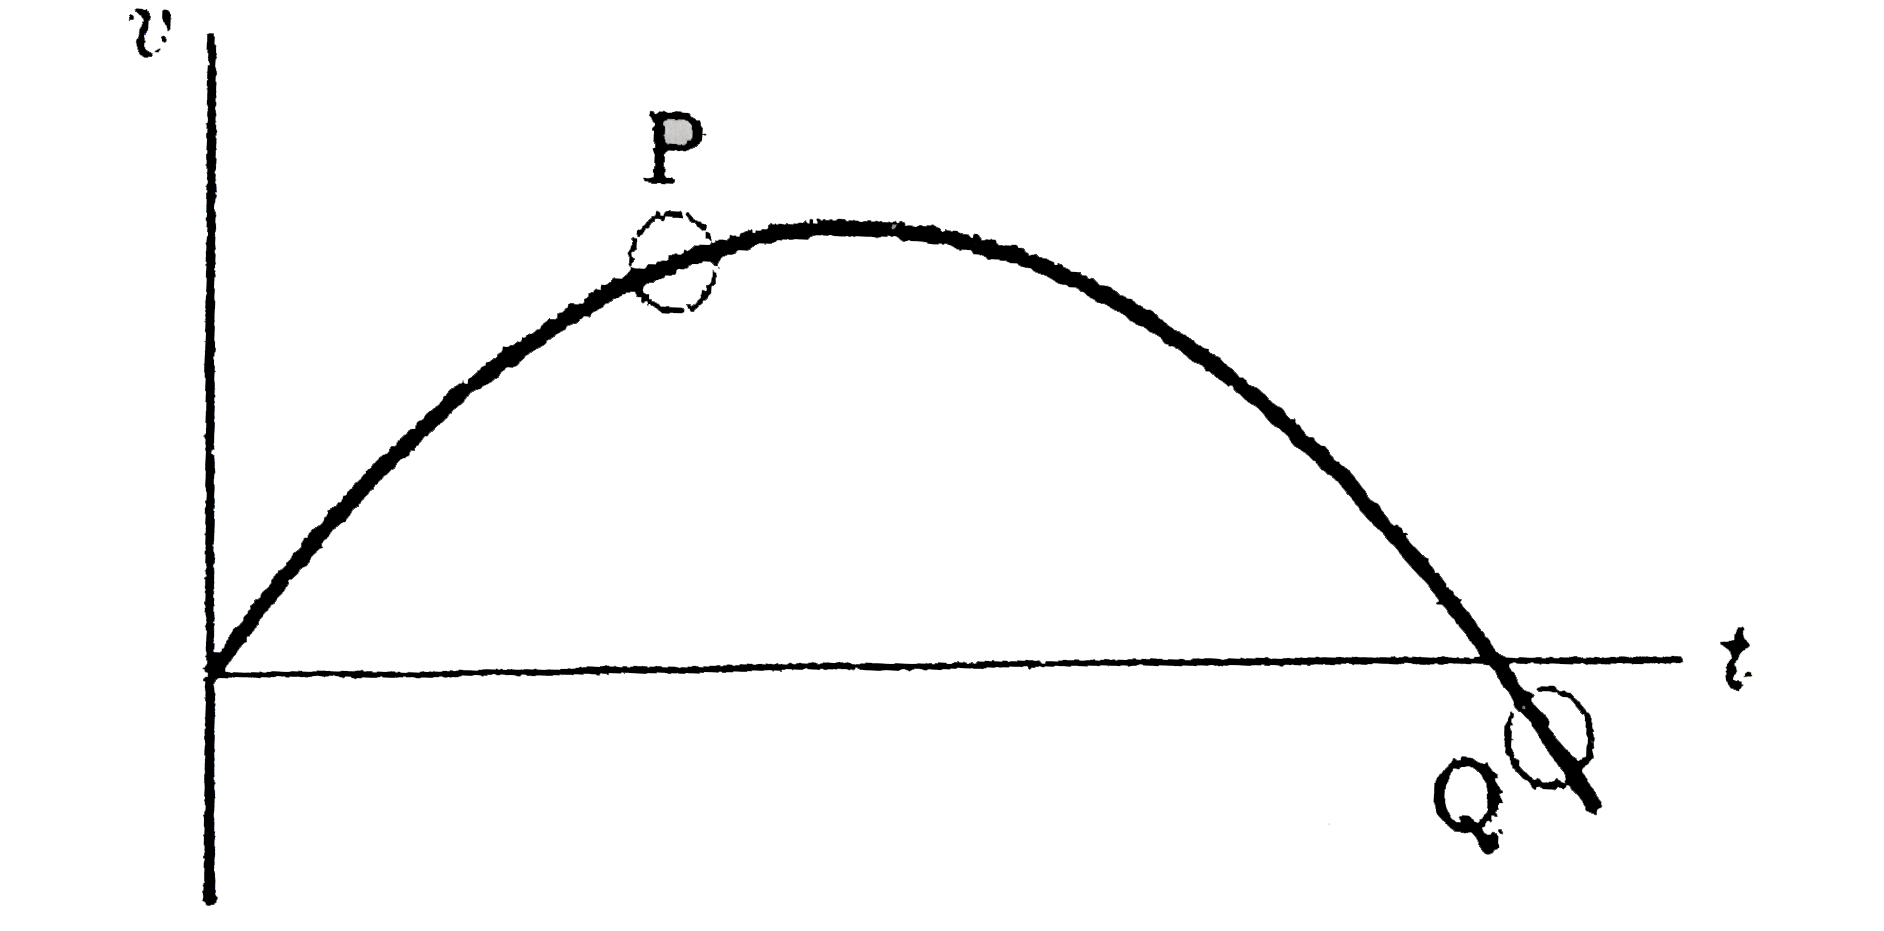
View SolutionThe diagram shows a velocity-time graph for a car moving in a straight line. At point Q the car must be
View SolutionA car of mass 1000 kg is moving with a velocity of 10 m s−1. If the velocity-time graph for this car is a horizontal line parallel to the time axis, then the velocity of car at the end of 25 s will be :
View Solution

