Refer to the given graph representing interplay of different hormones (A-D) during menstrual cycle in women and answer the question that follow.
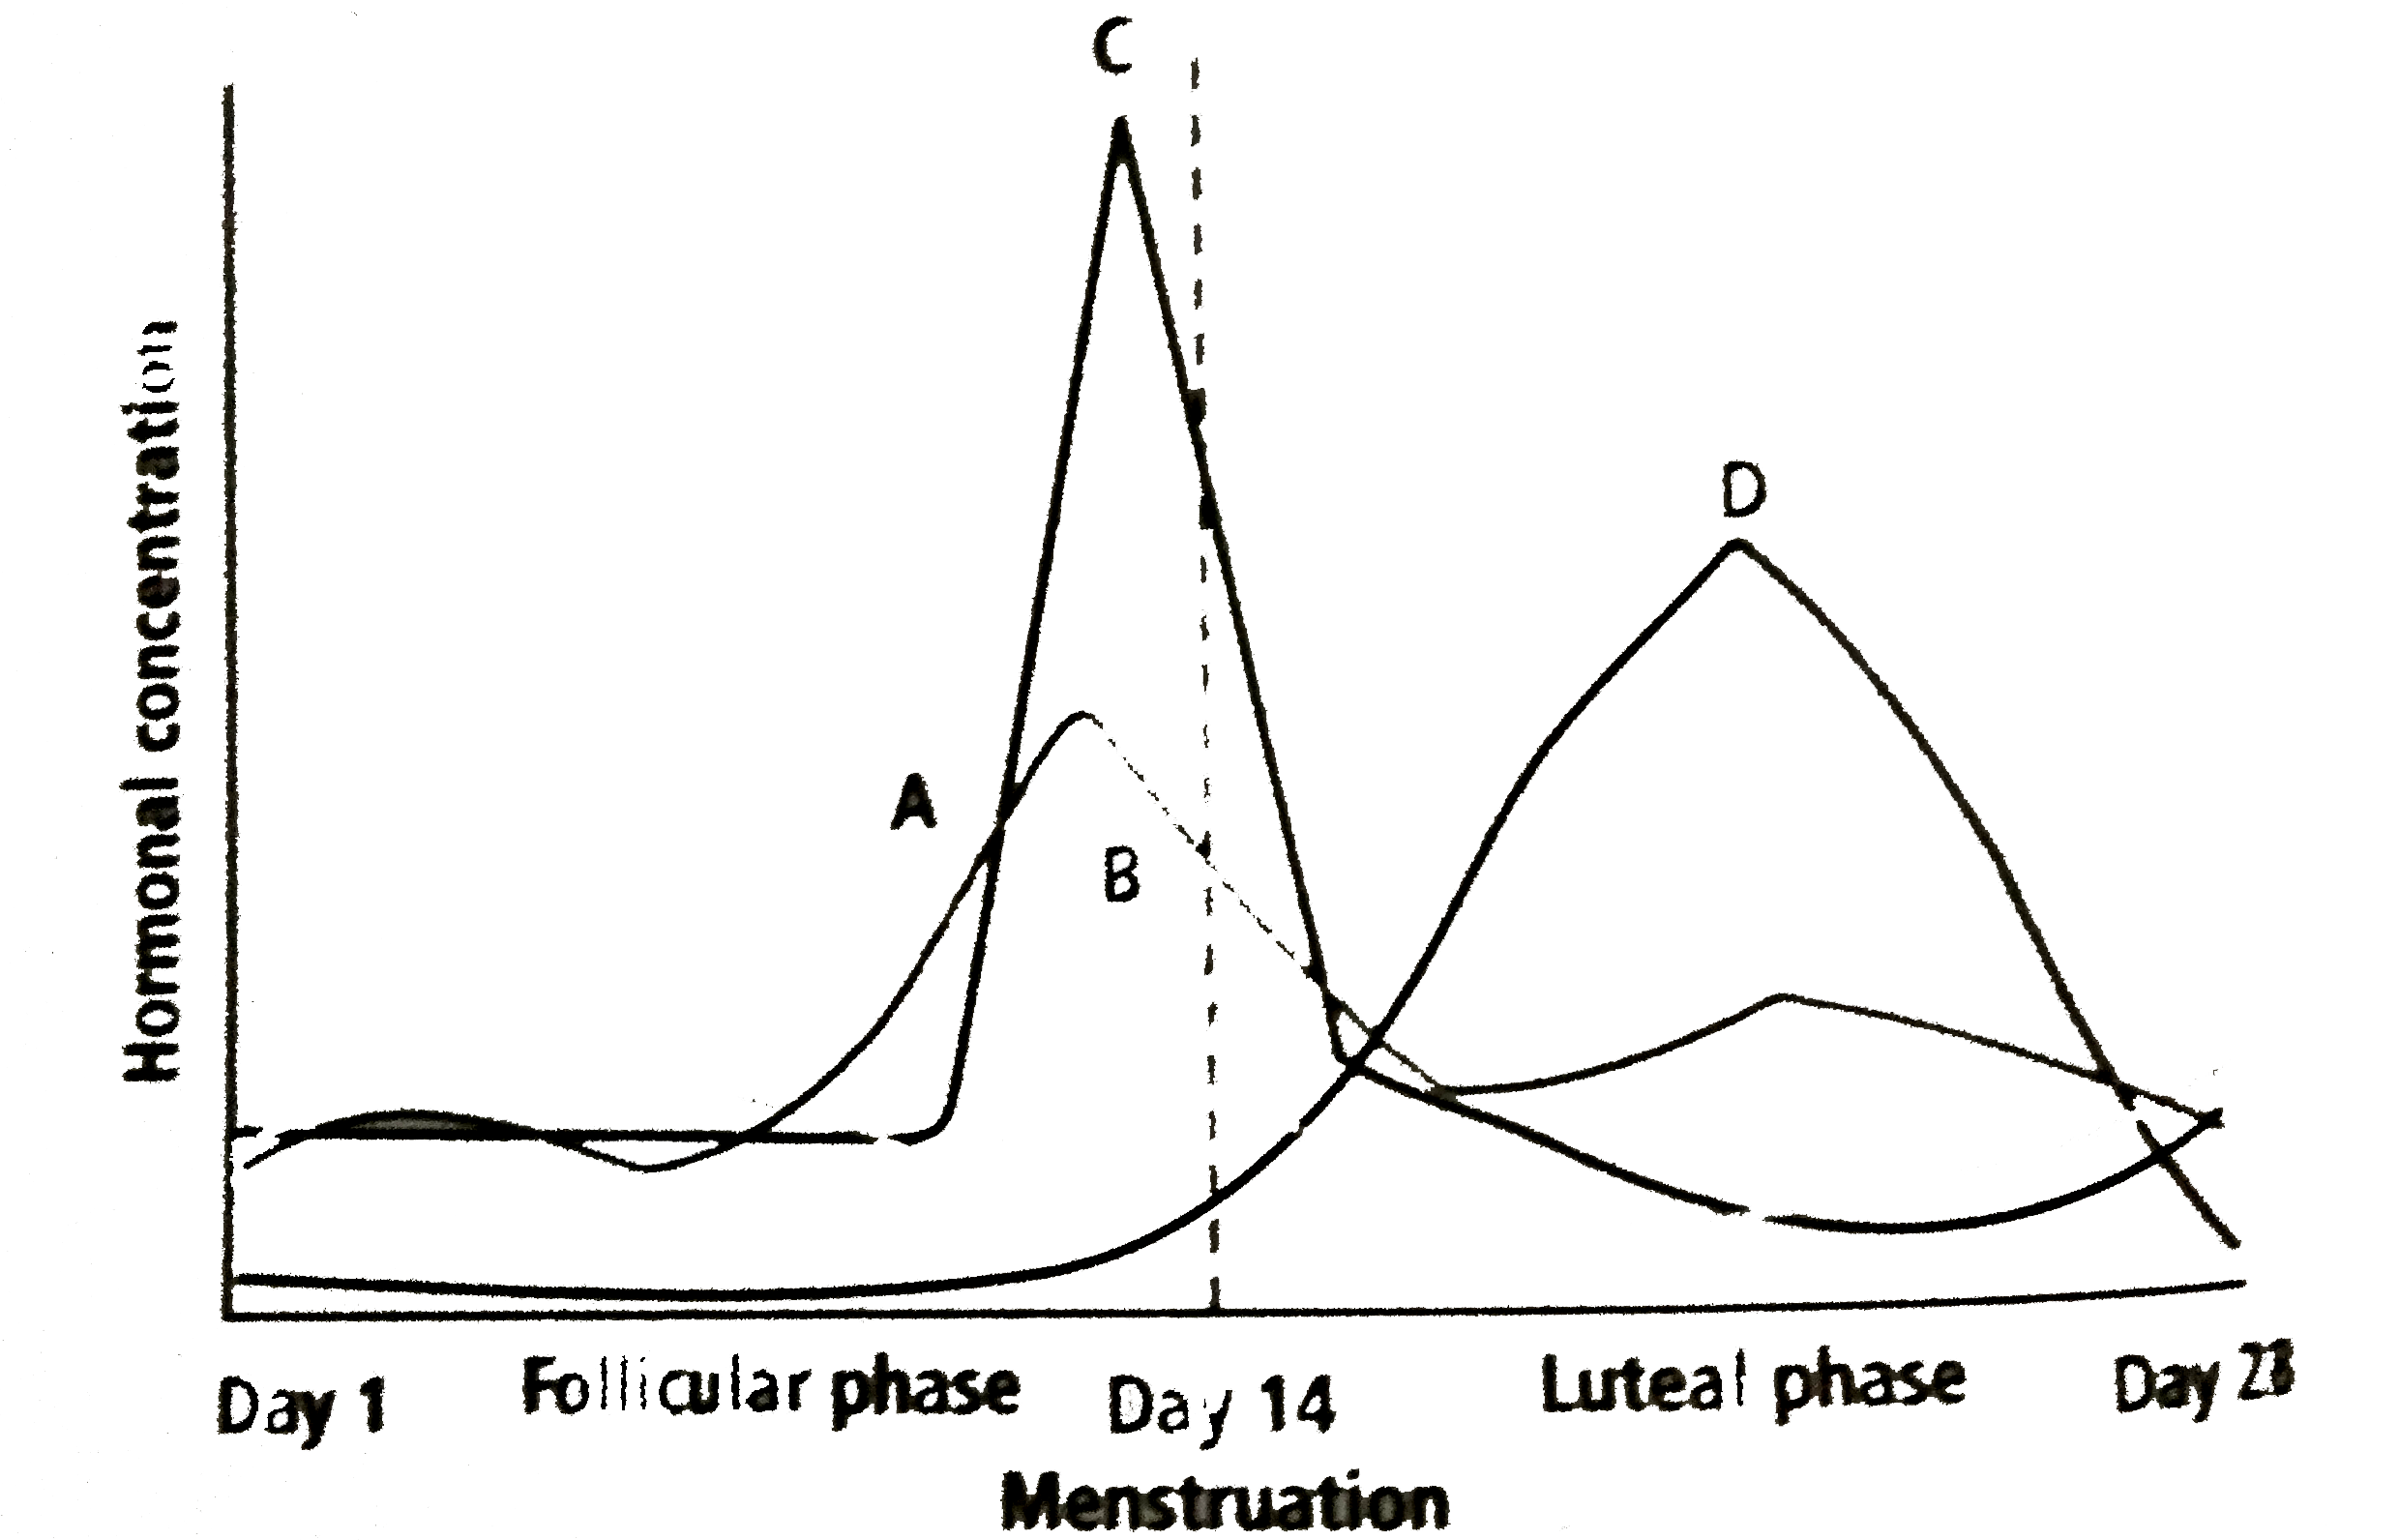
Which hormones are excreted in urine after menopause?
A
A
B
B
C
C
D
Both b and c
Video Solution
Text Solution
The correct Answer is:D
B and C represent FSH and LH. They are excreted in urine after menopause. At about age of 45 years, the production of estrogen by the ovaries decreases as the number of priomordial follicles approaches zero. When estrogen production falls below a critical value. the estrogen can no longer inhibit the production of the gonadotropins (FSH and LH). Instead, the gonadotropins FSH and LH (mainly FSH) are produced after menopause in large and continous quantities. The same are then excreted in urine.
|
Topper's Solved these Questions
Similar Questions
Knowledge Check
Refer to the given graph representing interplay of different hormones (A-D) during menstrual cycle in women and answer the question that follow.
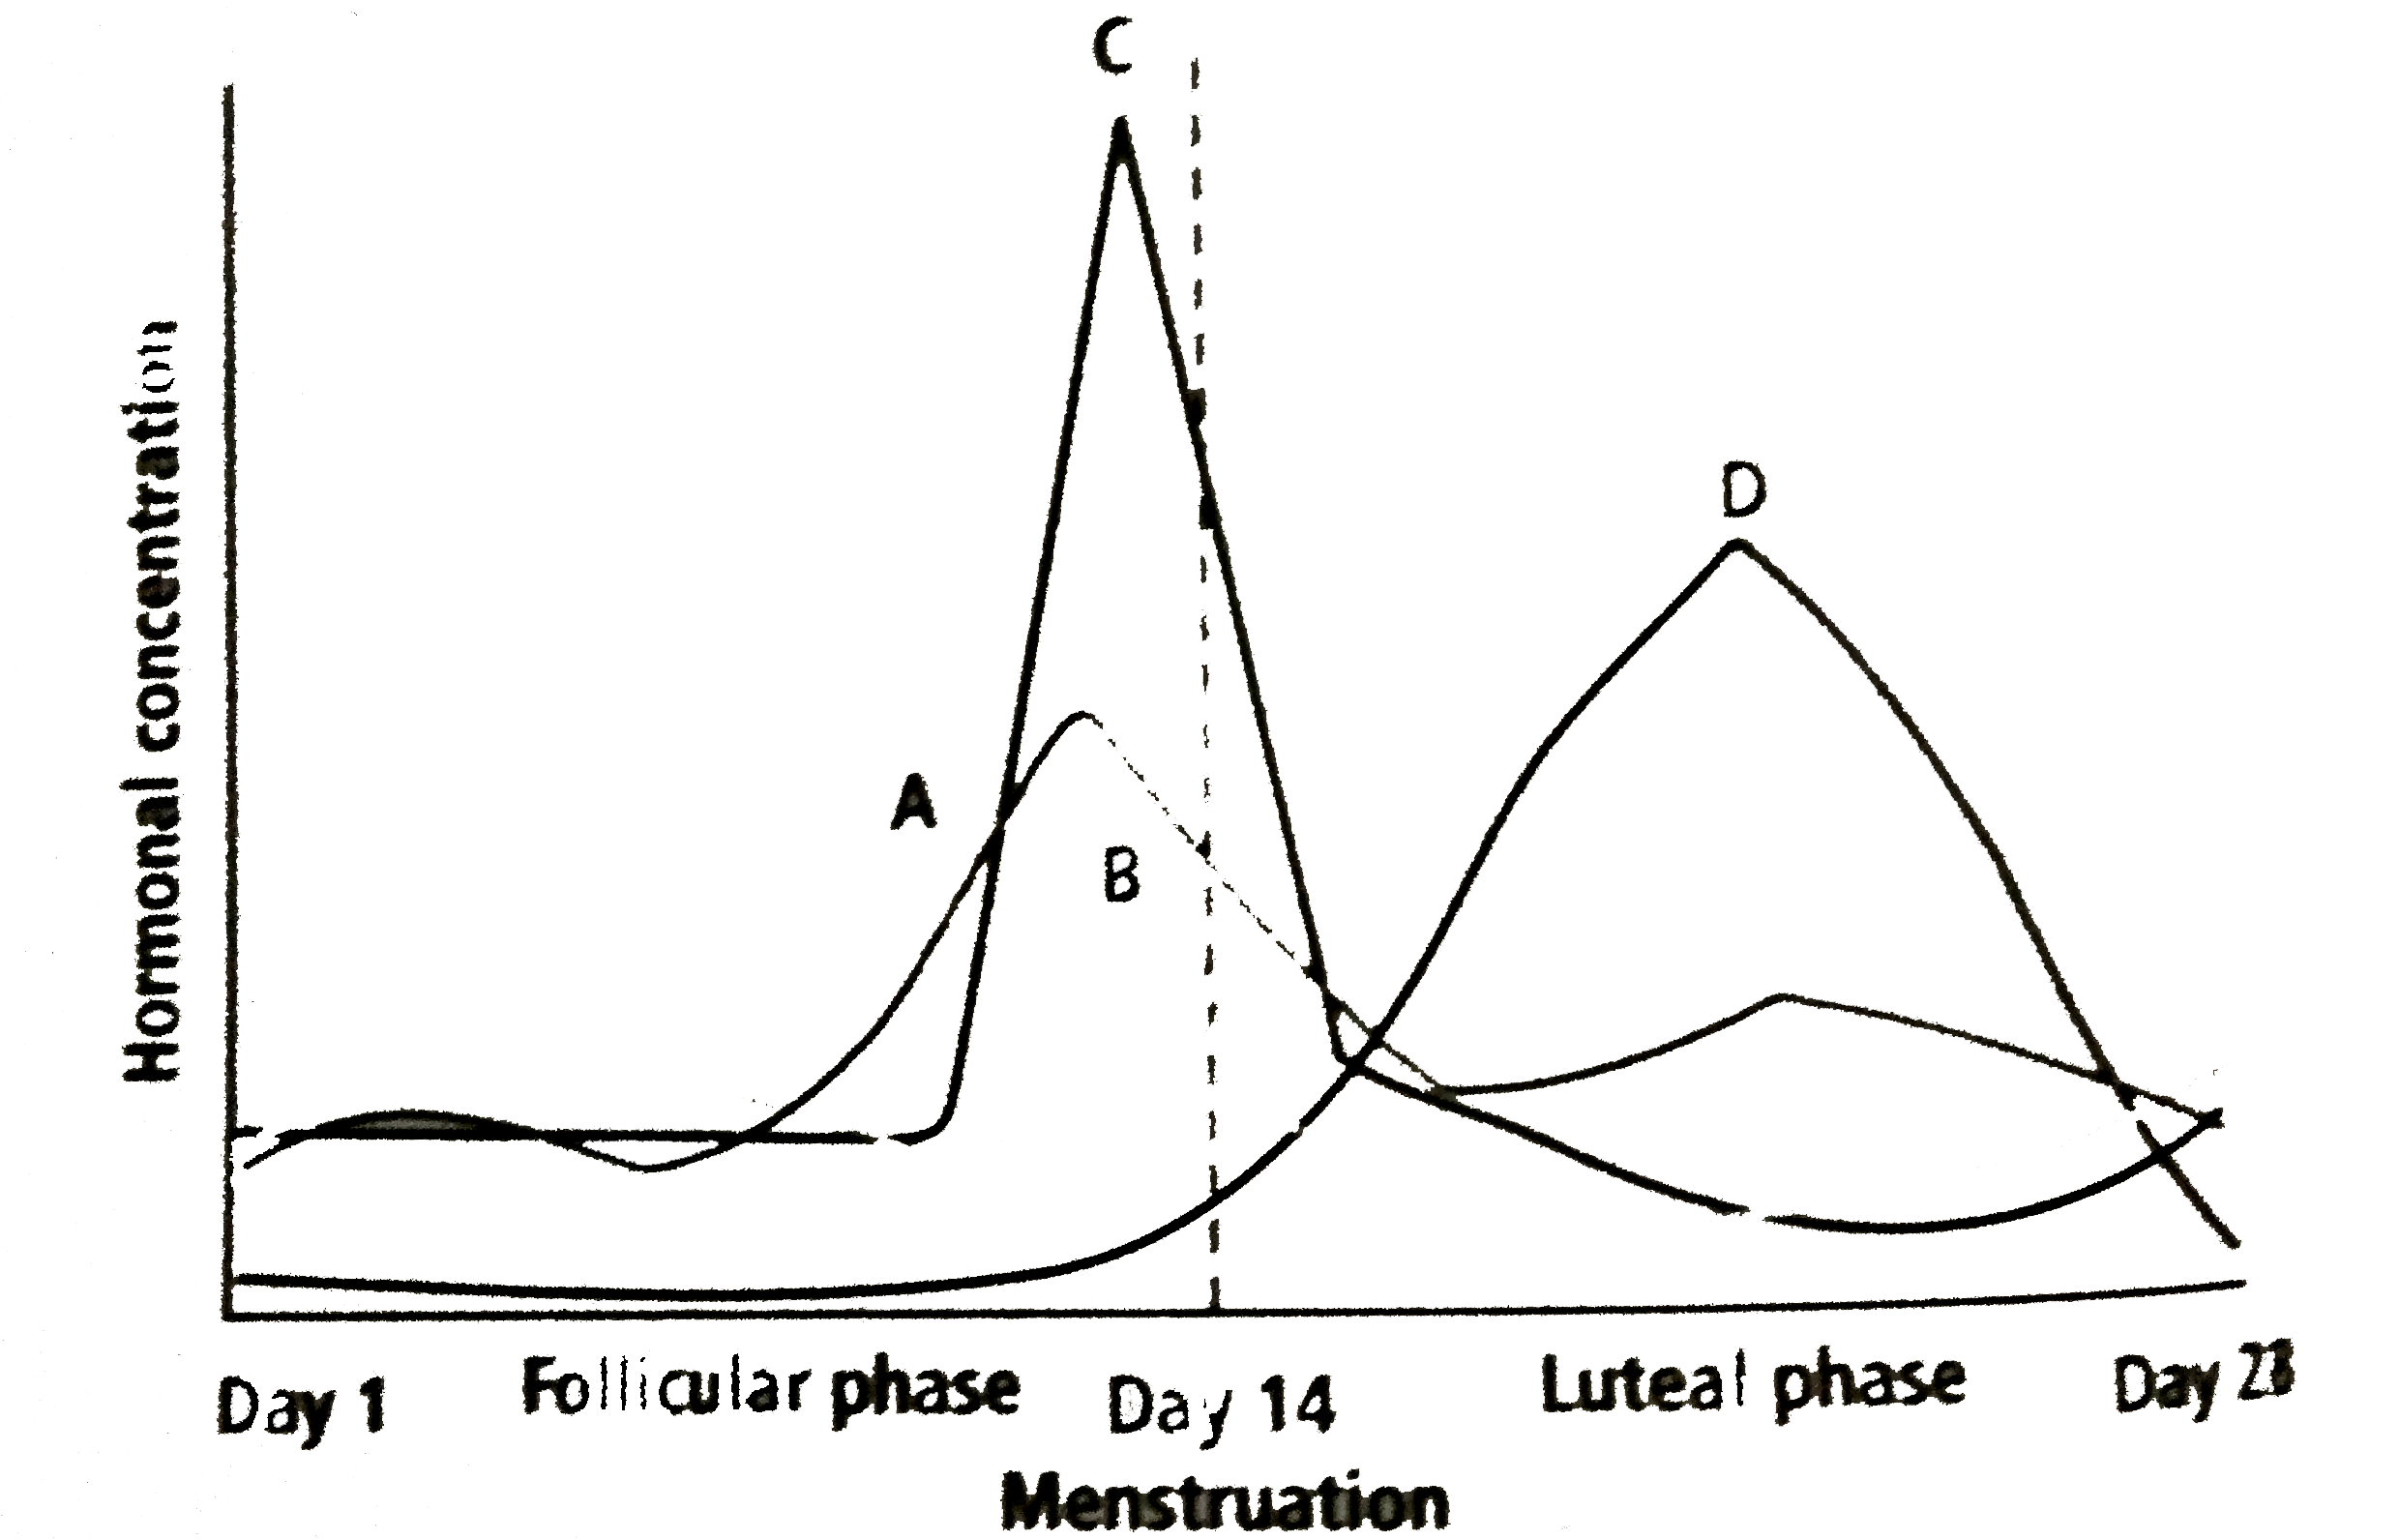
Which hormones is most effective in producing uterine changes during menstrual cycle?AABBCCDDRefer to the given graph representing interplay of different hormones (A-D) during menstrual cycle in women and answer the question that follow.
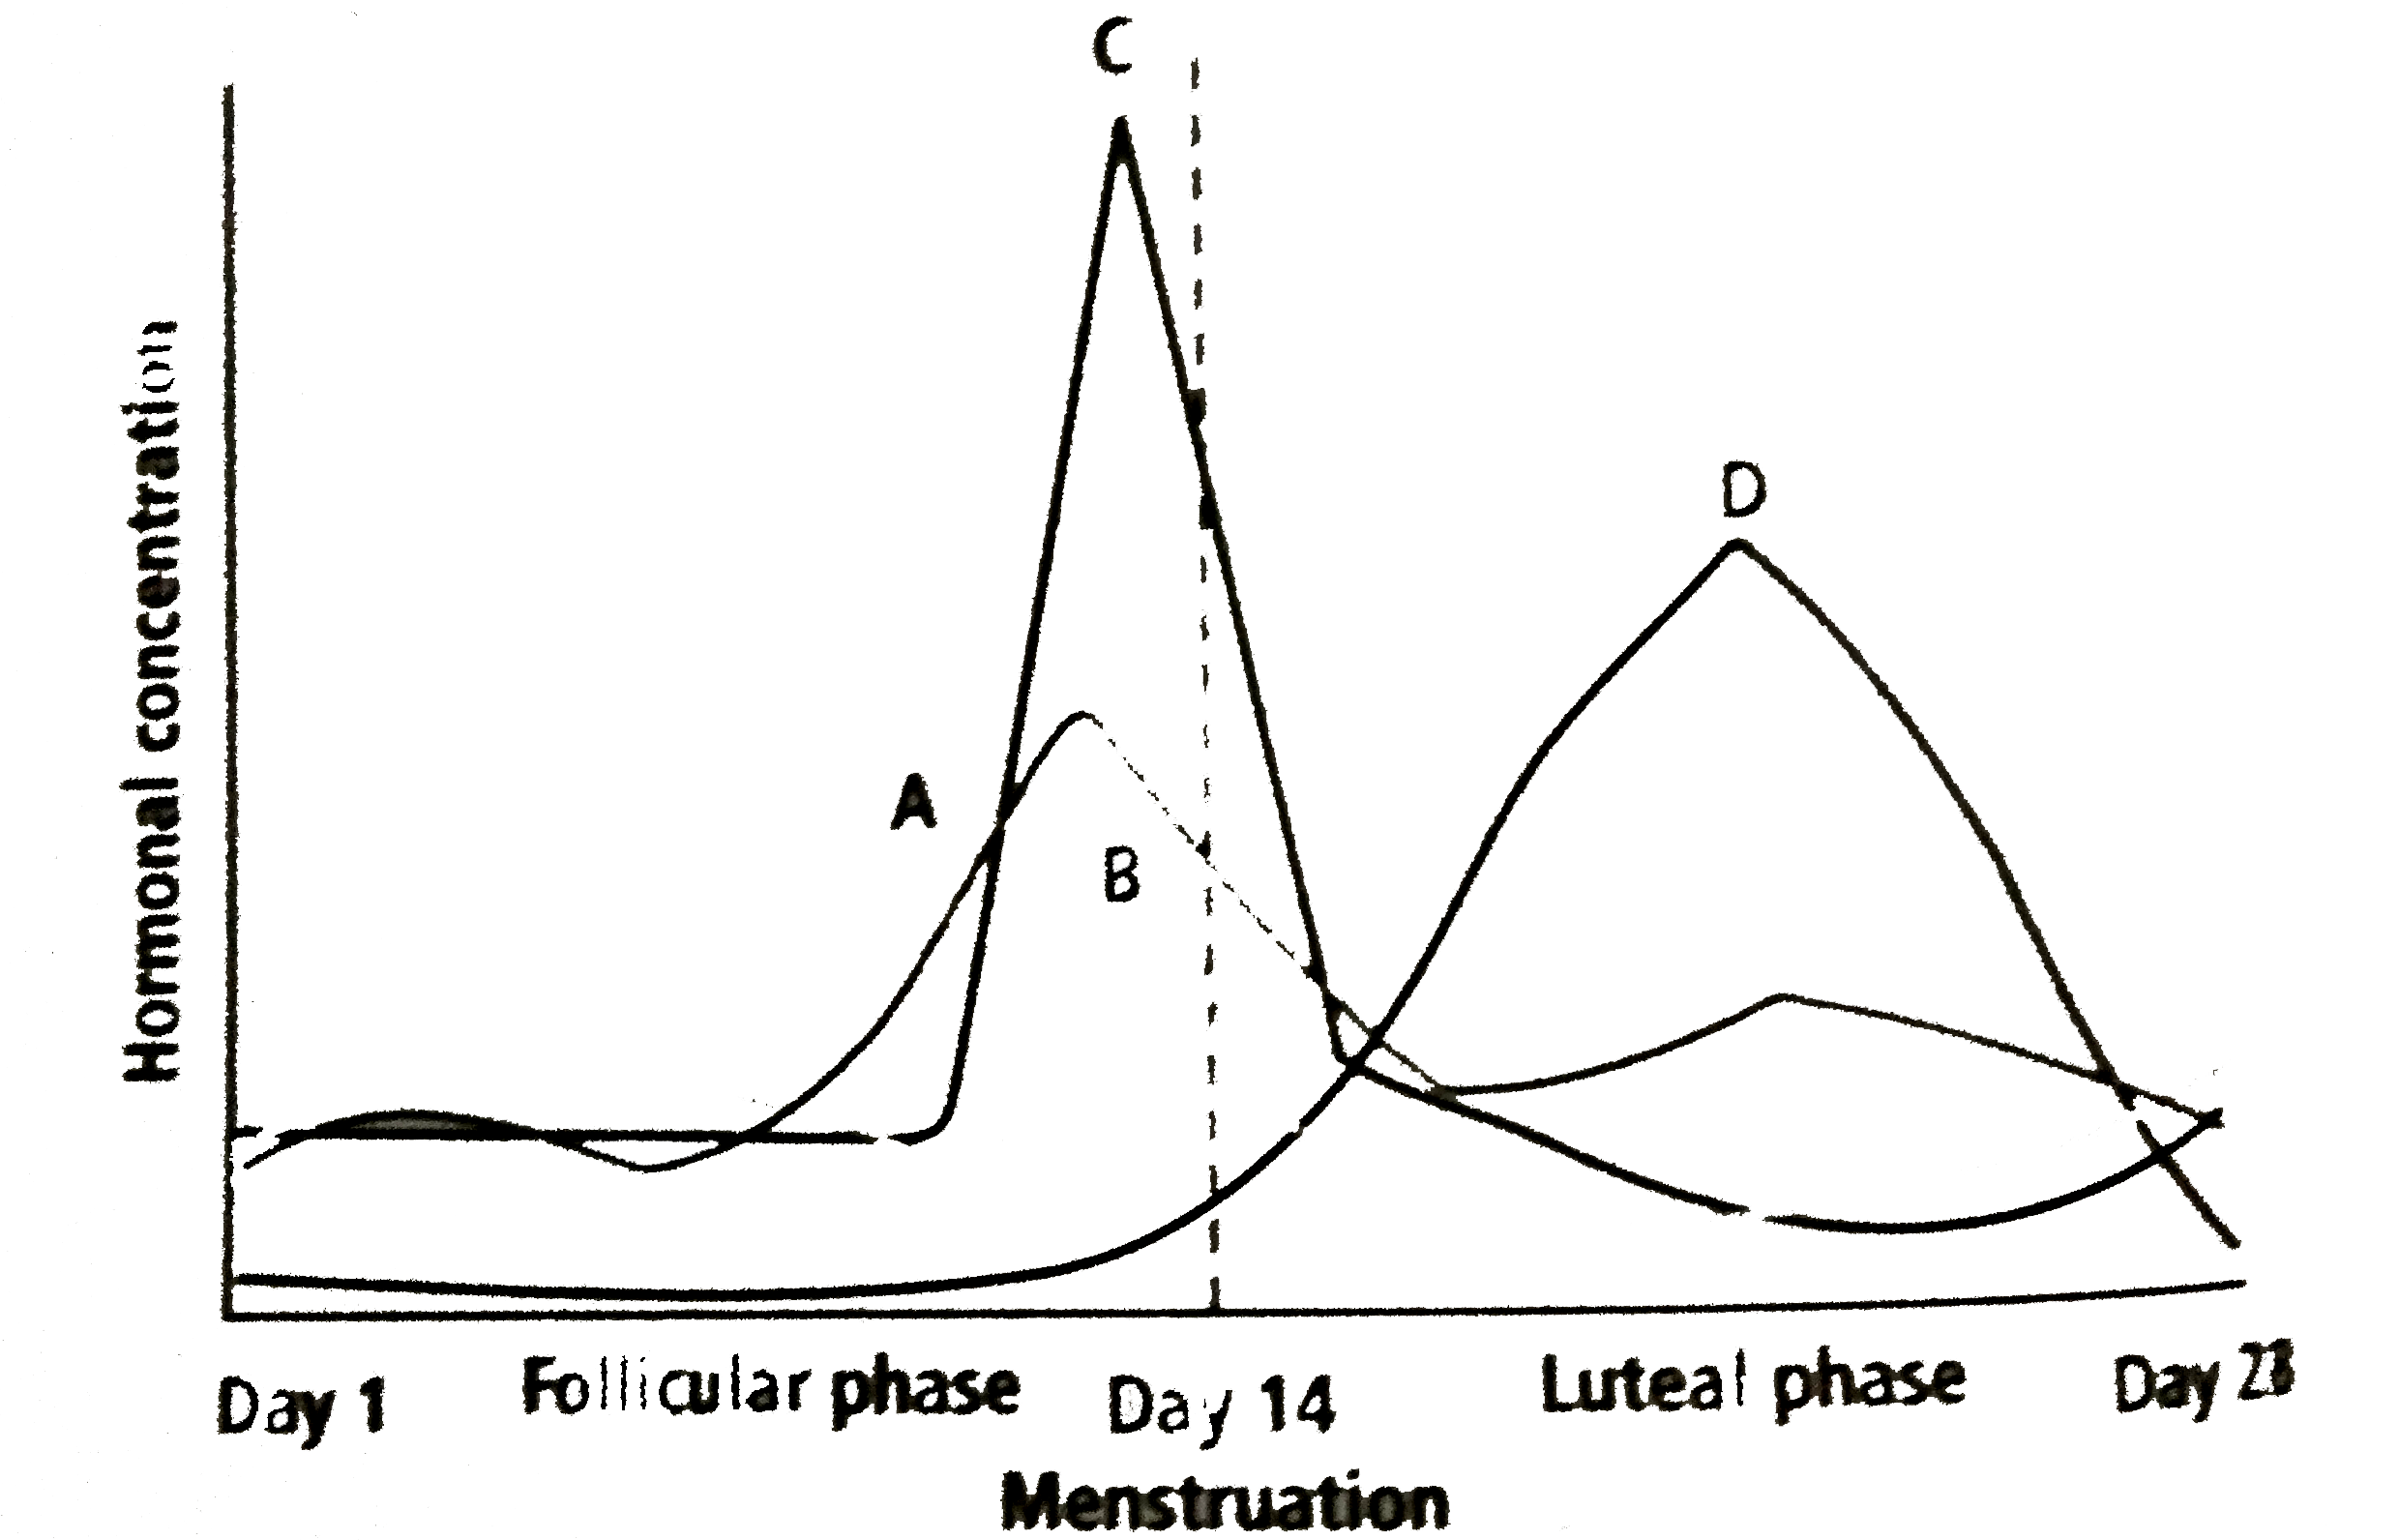 Which hormone (A,B,C or D) is necessary for the final follicular grwoth and ovulation? AABBCCDD
Refer to the given graph representing interplay of different hormones (A-D) during menstrual cycle in women and answer the question that follow.
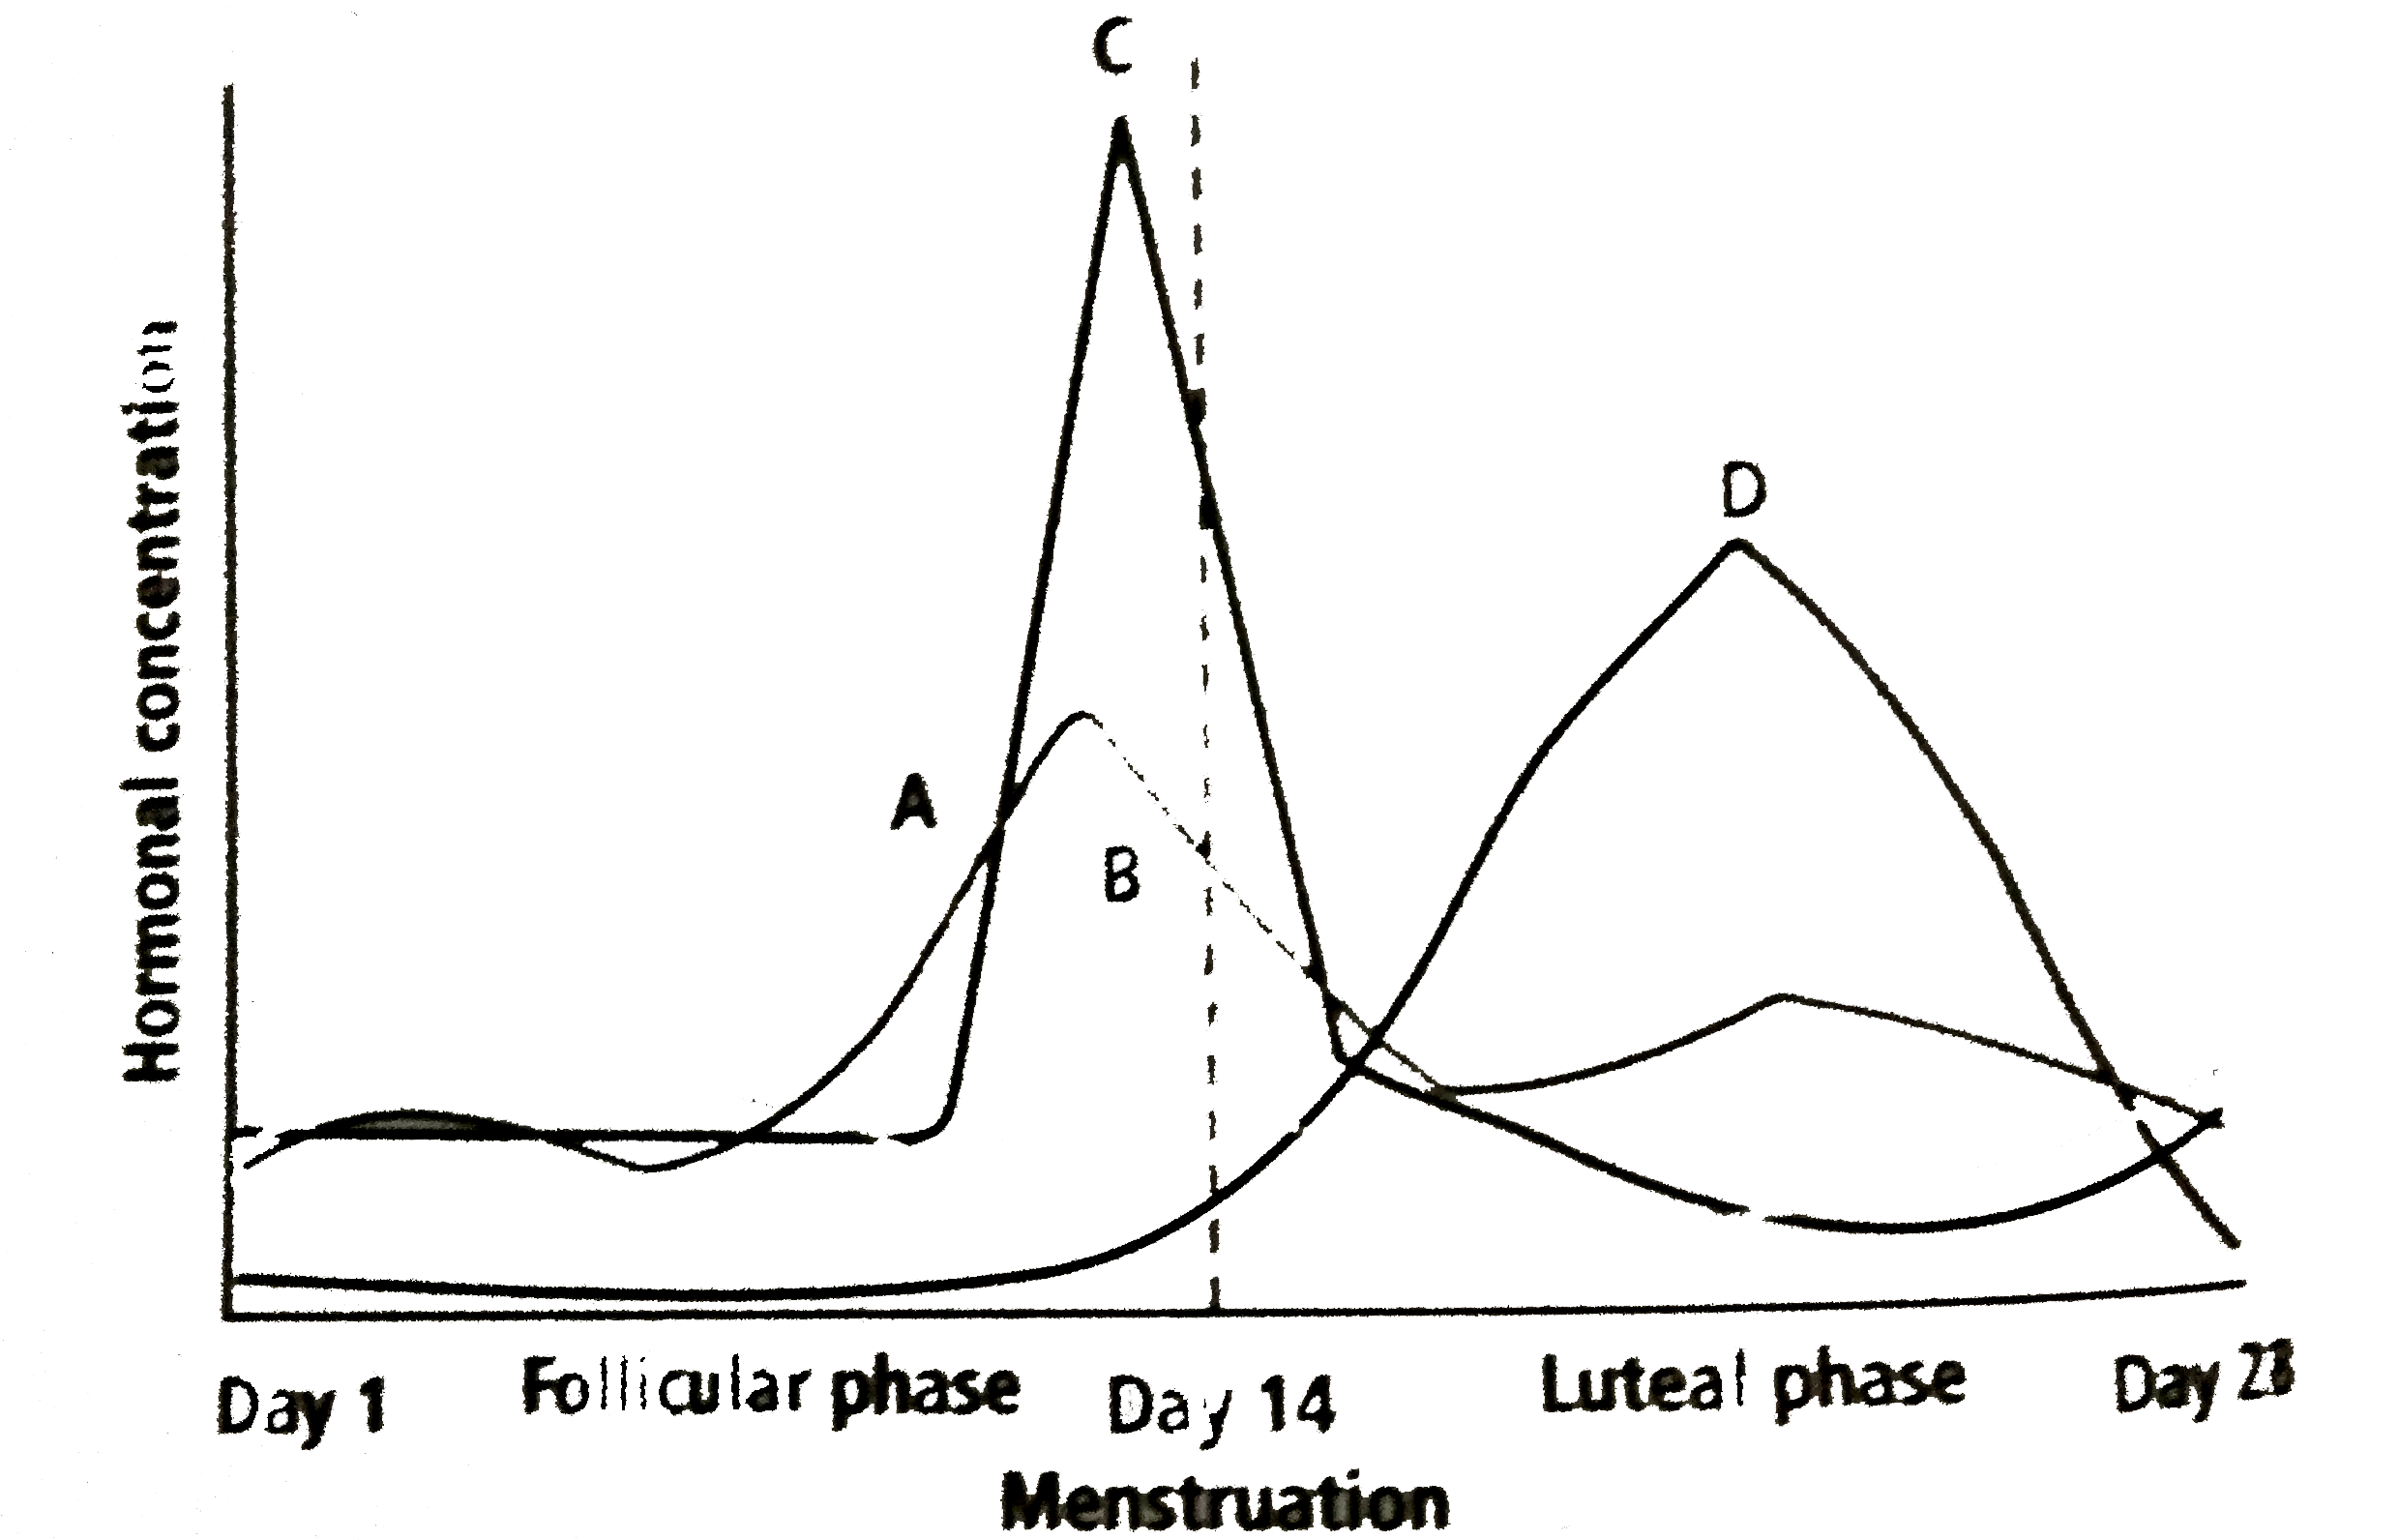
Cessation of secretion of which of these hormones may lead to osteoporosis?AABBCCDD
During menstrual cycle, which hormone shows dual peak ?
View Solution
The following graph shows the levels of ovarian hormones during a menstrual cycle. What do 1 and 2 represent?
View SolutionThe given bar graph represents the number of boys and girls in five different schools. Study the graph and answer the question that follows
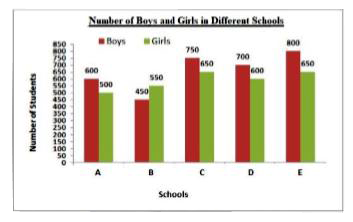
In which school is the percentage of girls the lowest ?
View SolutionThe given bar graph represents the number of boys and girls in five different schools. Read the graph and answer the question that follows.
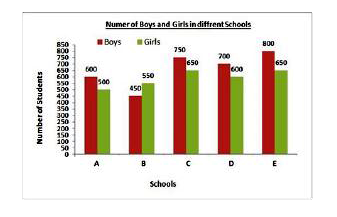
In which school is the percentage of boys more than 55%?
View Solution
The following graph shows the levels of pituitary hormones during a menstrual cycle. What do 1 and 2 represent?
View Solution

