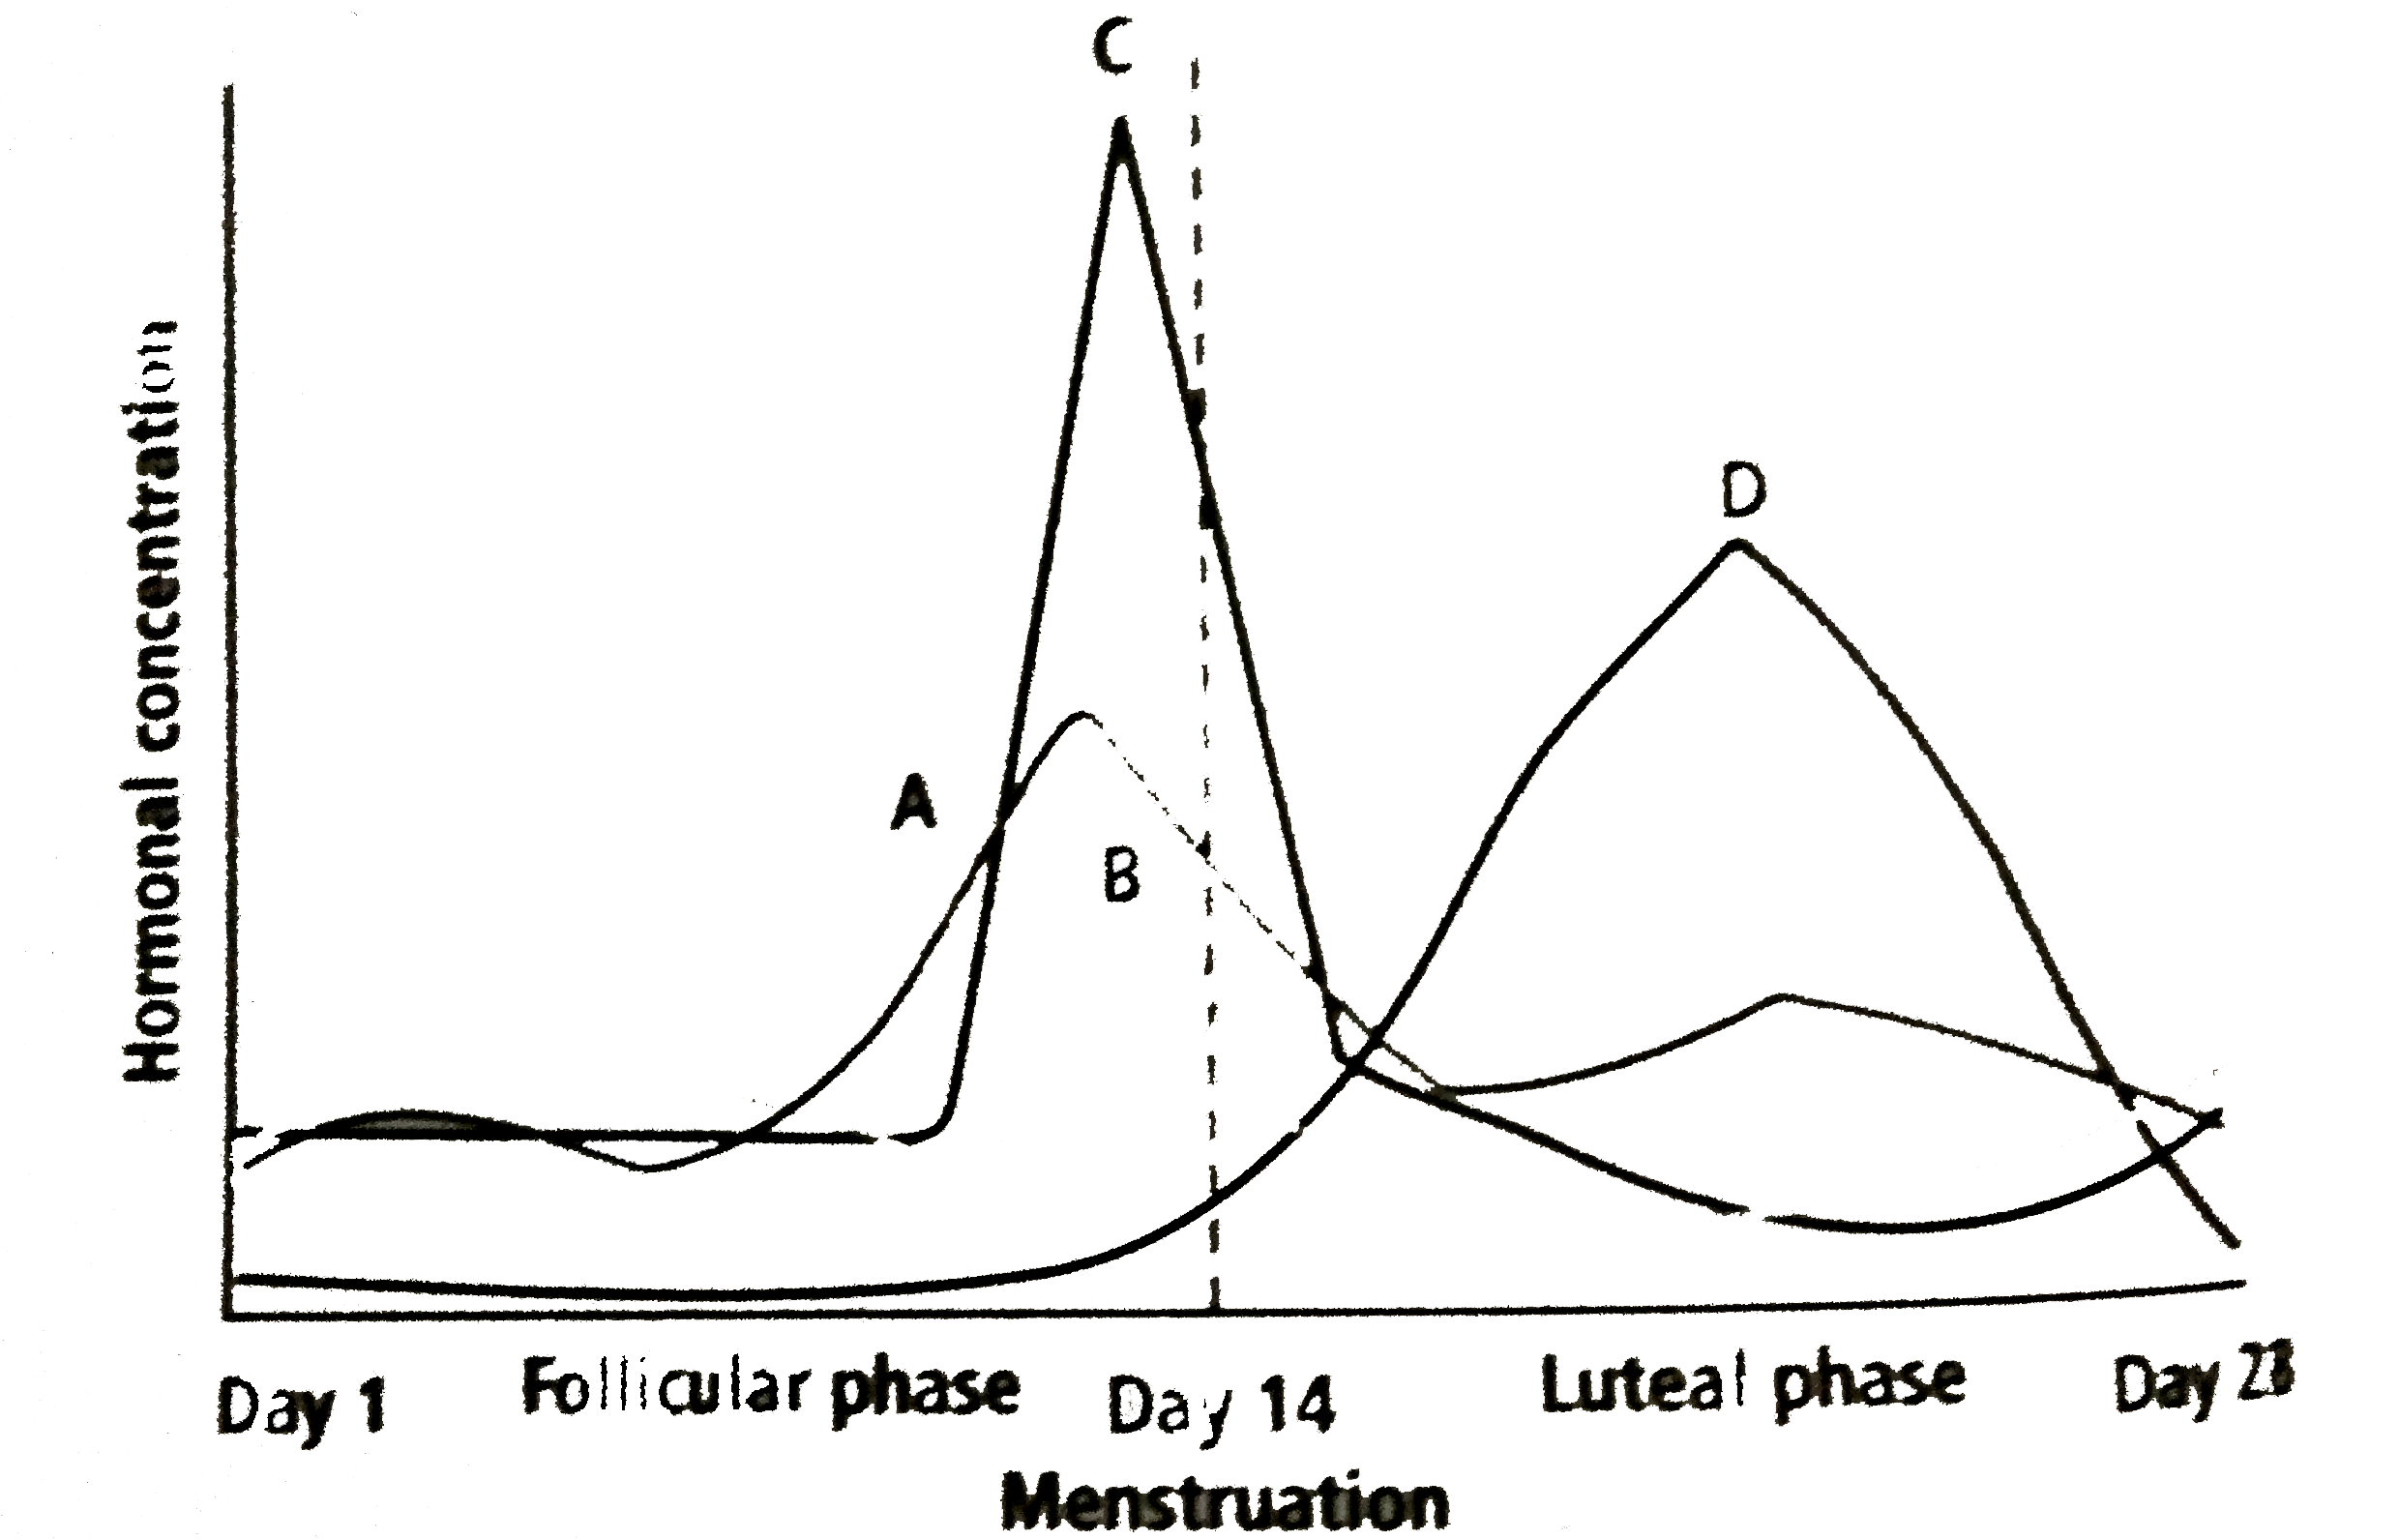
The following graph shows the levels of pituitary hormones during a menstrual cycle. What do 1 and 2 represent?
12LHFSH
12EstrogenProgesterone
12FSHLH
12ProgesteroneEstrogen
The correct Answer is:C
In the given graph, 1 and 2 are FSH and LH respectively. The secretion of both LH and FSH attain peak level during the ovulation (14th day of the cycle.)
Topper's Solved these Questions
Similar Questions
Knowledge Check

The following graph shows the levels of pituitary hormones during a menstrual cycle. What do 1 and 2 represent?A12LHFSHB12EstrogenProgesteroneC12FSHLHD12ProgesteroneEstrogen
The following graph shows the levels of ovarian hormones during a menstrual cycle. What do 1 and 2 represent?A12ProgesteroneEstrogenB12FSHLHC12LHFSHD12EstrogenProgesteroneWhich of the following layers of the tissue is shae3d as menses during menstrual cycle ?
APerimetriumBMyometirumCEndometriumDBoth (a) and (b)
which of the following is correctly matched event occurring during menstrual cycle?
View SolutionWhich one of the following is the correct matching of the events occurring during menstrual cycle ?
View SolutionWhich one of the following is the incorrect match of the events occurring during menstrual cycle ?
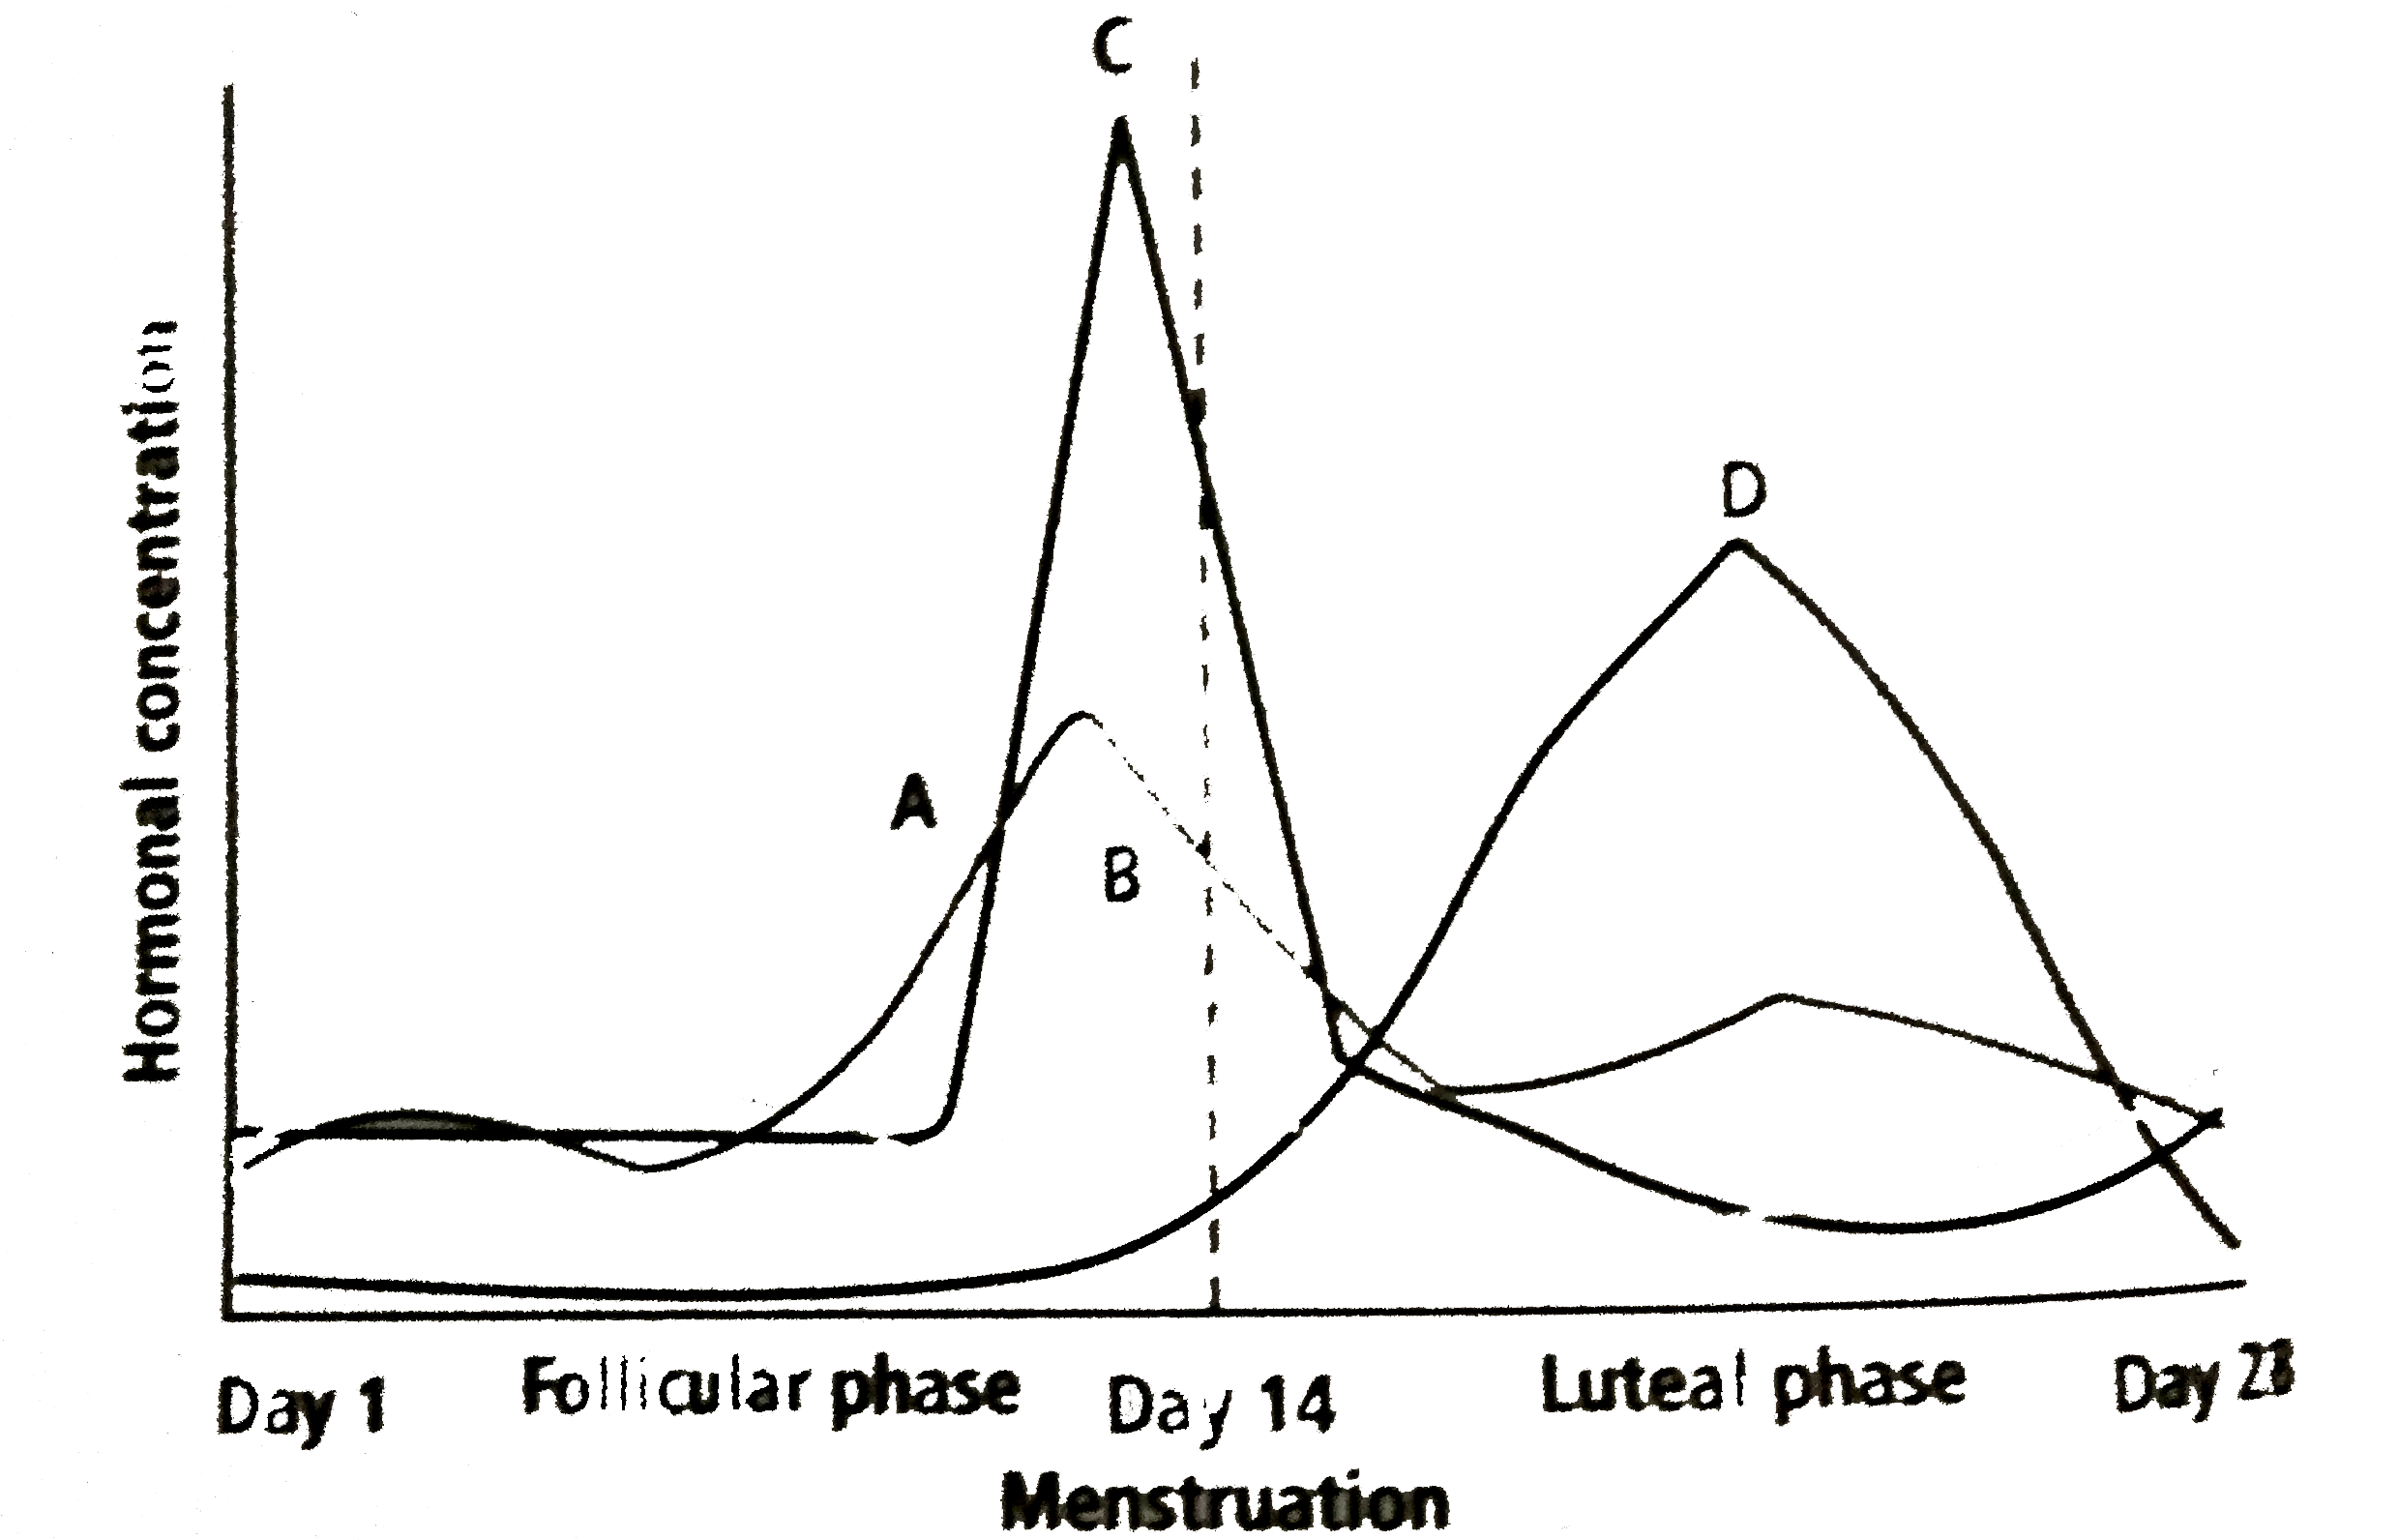
View SolutionRefer to the given graph representing interplay of different hormones (A-D) during menstrual cycle in women and answer the question that follow.

Which hormones is most effective in producing uterine changes during menstrual cycle?
View SolutionRefer to the given graph representing interplay of different hormones (A-D) during menstrual cycle in women and answer the question that follow.

Cessation of secretion of which of these hormones may lead to osteoporosis?
View Solution
