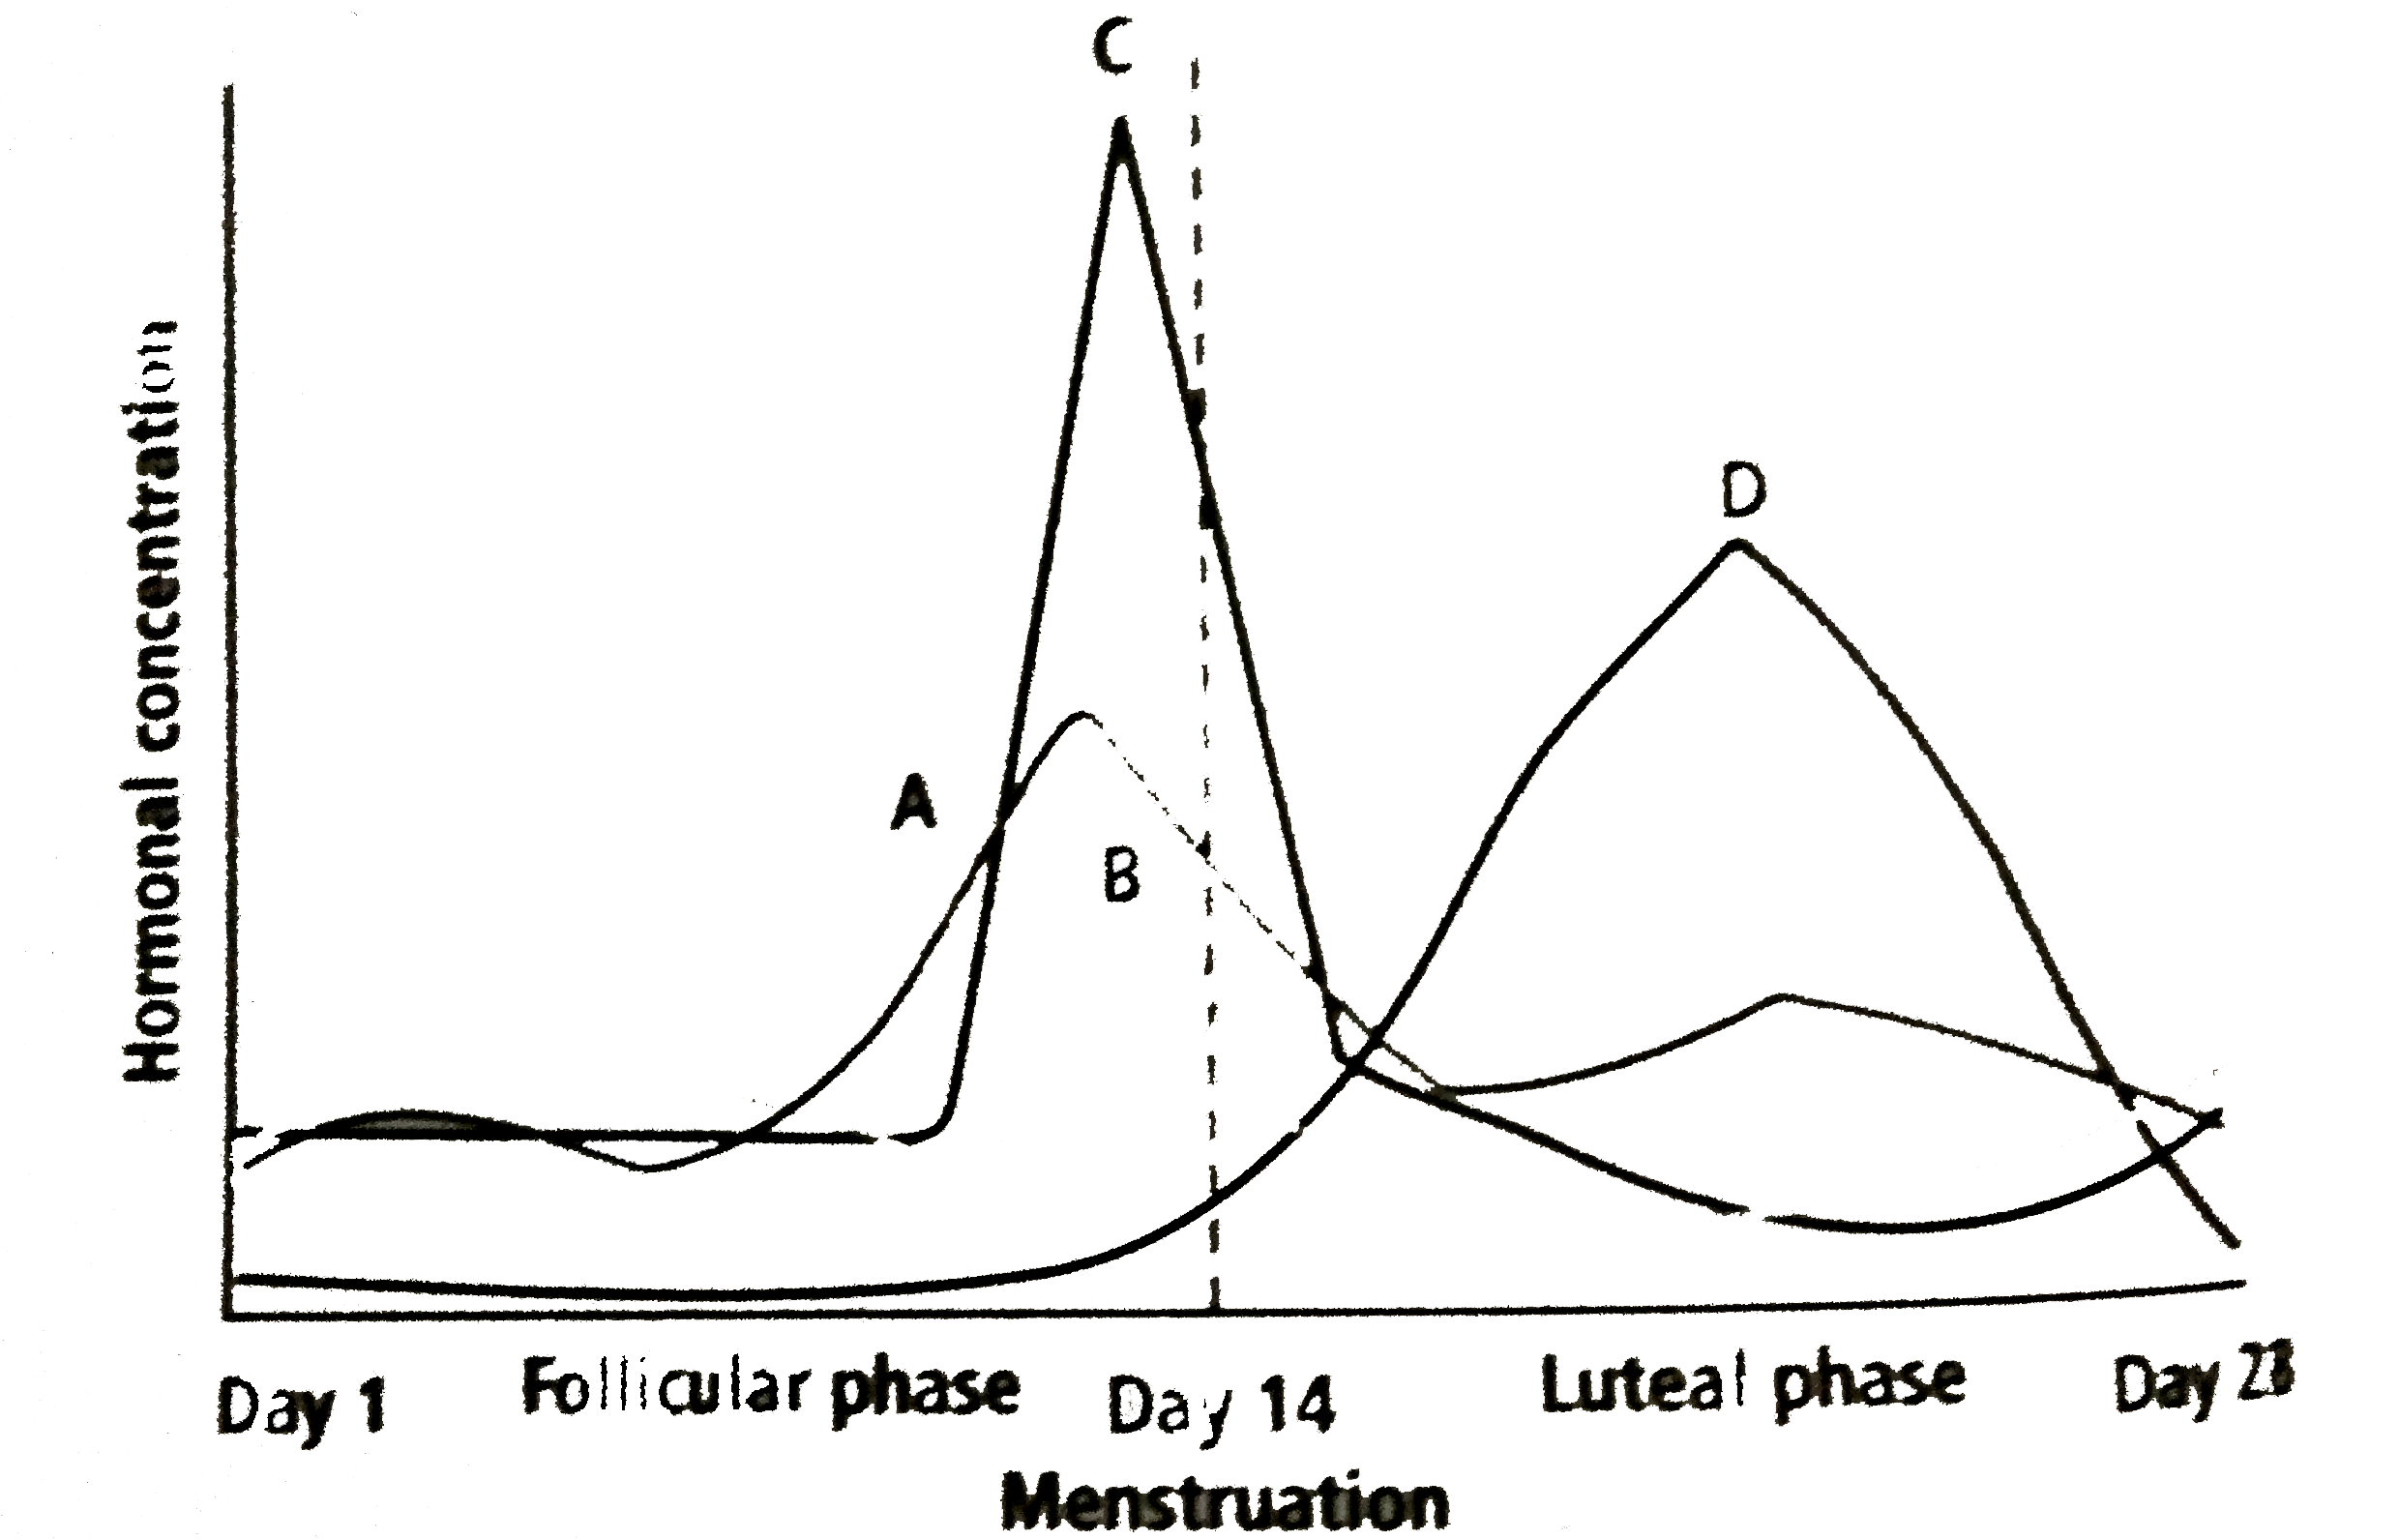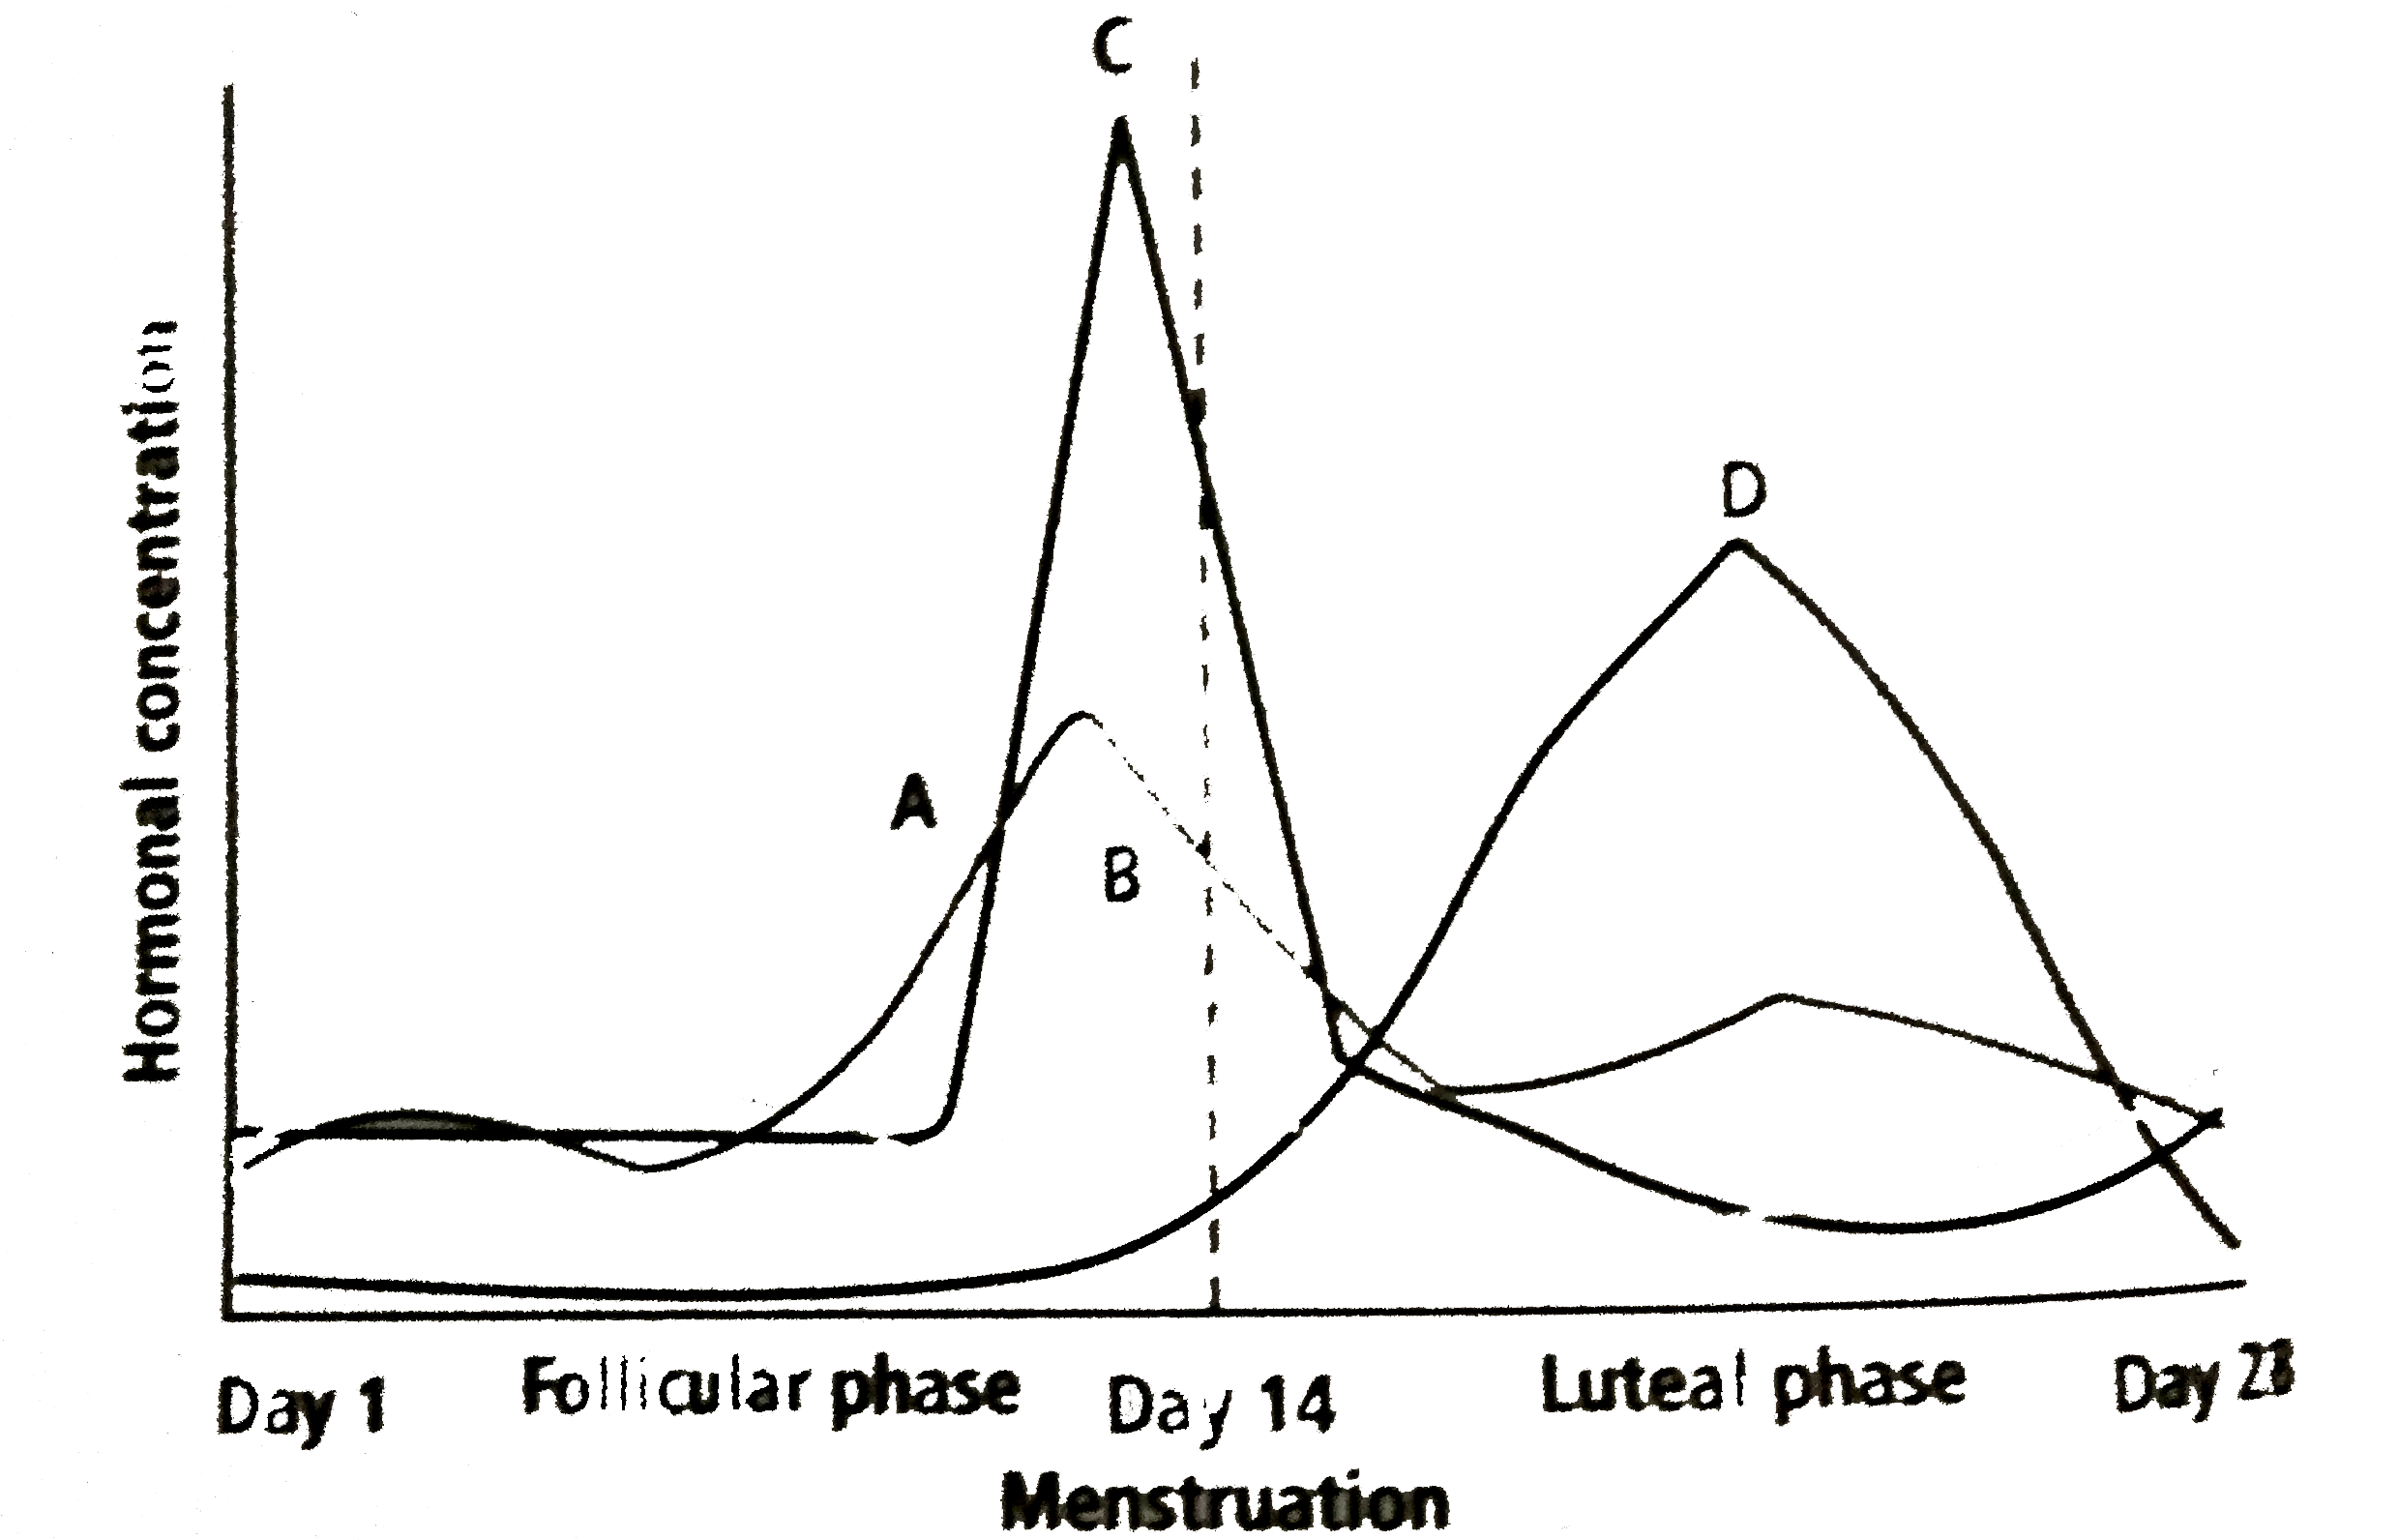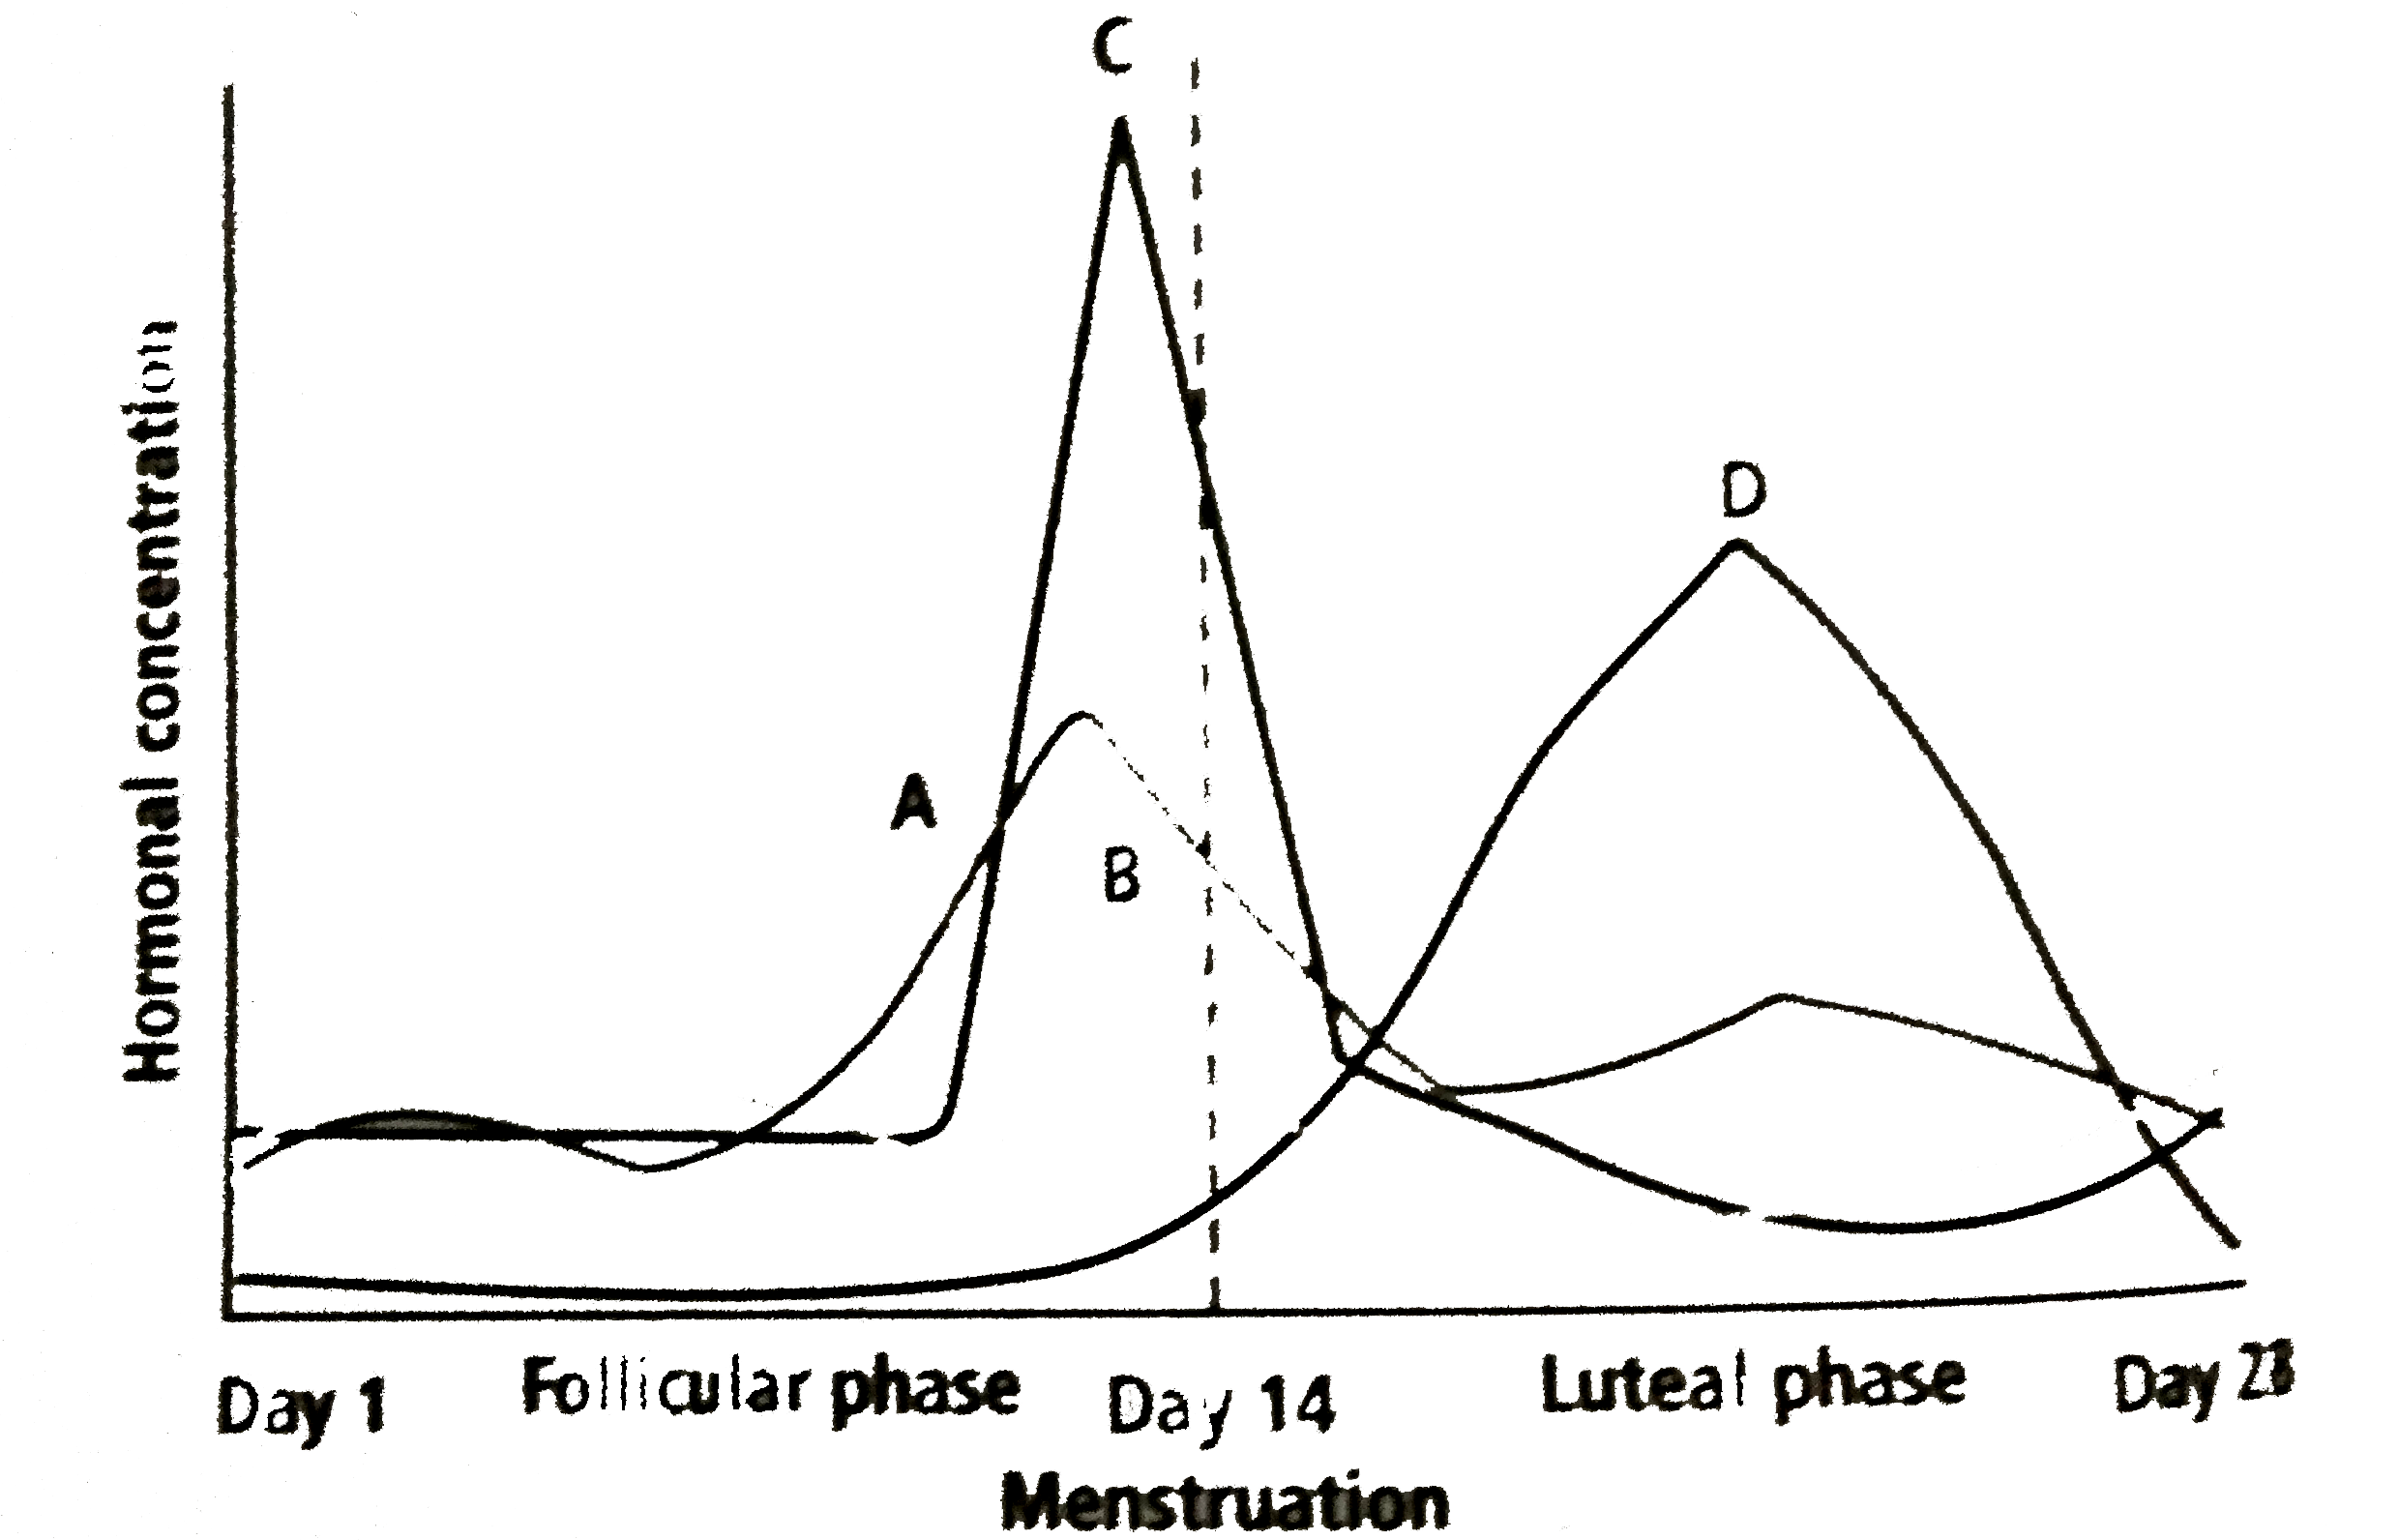
The following graph shows the levels of ovarian hormones during a menstrual cycle. What do 1 and 2 represent?
12ProgesteroneEstrogen
12FSHLH
12LHFSH
12EstrogenProgesterone
The correct Answer is:D
In the given graph, 1 and 2 are extrogen and progesterone respectively. The levelof estrogen and progesterone respectively The level of estrogen and progesterone respectively. The level of estrogen, and progesterone is reduced in the menstrual phase, in follicular phase level of estrogen is increased and in luteal phase level of progeterone increases.
Topper's Solved these Questions
Similar Questions
Knowledge Check

The following graph shows the levels of pituitary hormones during a menstrual cycle. What do 1 and 2 represent?A12LHFSHB12EstrogenProgesteroneC12FSHLHD12ProgesteroneEstrogenWhich of the following layers of the tissue is shae3d as menses during menstrual cycle ?
APerimetriumBMyometirumCEndometriumDBoth (a) and (b)Which one of the following is the correct matching of events occuring during menstrual cycle ?
AMenstruation : Breakdown of myometrium and ovum not fertilizedBOvulation : LH and FSH attain peak level and sharp fall in the secretion of progesteroneCProliferative : Rapid regeneration of myometrium and maturation of Graafian phase follicleDCorpus luteum : Development of secretory phase and increased secretion of progesterone
A biology student after studying about the different levels of hormones during the menstrual cycle was comparing 2 subjects (Patients). A table was created after looking at the levels of hormones A and B for Subject 1 and 2. Read the information in the table and answer the questions that follow

The Subject 2 has higher level of hormone B, which is
View SolutionDescribe the role of pituitary and ovarian hormones during the menstrual cycle in a human female .
View SolutionRefer to the given graph representing interplay of different hormones (A-D) during menstrual cycle in women and answer the question that follow.

Which hormones is most effective in producing uterine changes during menstrual cycle?
View SolutionRefer to the given graph representing interplay of different hormones (A-D) during menstrual cycle in women and answer the question that follow.

Cessation of secretion of which of these hormones may lead to osteoporosis?
View SolutionRefer to the given graph representing interplay of different hormones (A-D) during menstrual cycle in women and answer the question that follow.
 Which hormone (A,B,C or D) is necessary for the final follicular grwoth and ovulation?
View Solution

