Variation of displacement of a particle moving on a straight line with time is shown in following figure. The figure indicates
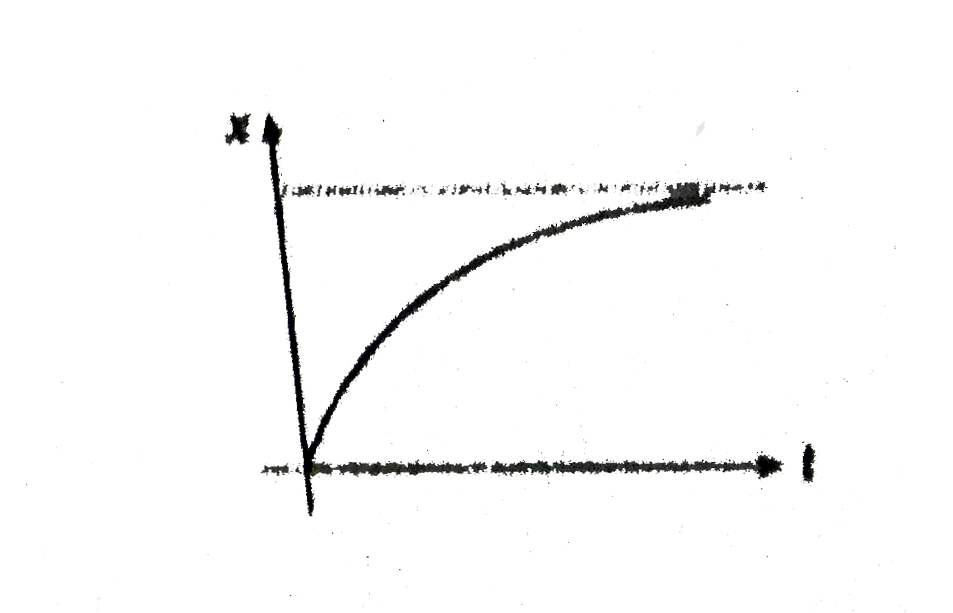
the particle starts with a certain speed but the motion is retarded
the velocity of particle is constant throughout motion
the acceleration of the paticle is constant throughout motion
the particle starts with certain speed and moves with increasing speed.
The correct Answer is:A
From the graph, we observe that slpe is non zero positive at slpe is continuously decreasing with time and finally becomes zero. Hence we can say that the particle starts with a certain velocity, but the motion is retarded (decreasing velocity)
Topper's Solved these Questions
- DAILY PRACTICE PROBLEMSBook:RESONANCEChapter:DAILY PRACTICE PROBLEMSExercise:dpp 20
Explore 8 Videos
- DAILY PRACTICE PROBLEMSBook:RESONANCEChapter:DAILY PRACTICE PROBLEMSExercise:dpp 21
Explore 8 Videos
- DAILY PRACTICE PROBLEMSBook:RESONANCEChapter:DAILY PRACTICE PROBLEMSExercise:dpp 18
Explore 7 Videos
- CURRENT ELECTRICITYBook:RESONANCEChapter:CURRENT ELECTRICITYExercise:Exercise
Explore 54 Videos
- ELASTICITY AND VISCOCITYBook:RESONANCEChapter:ELASTICITY AND VISCOCITYExercise:Advanced Level Problems
Explore 9 Videos
Similar Questions
Knowledge Check
Displacement time graph of a particle moving in a straight line is a shown in figure.
 Ain region A acceleration is positiveBin region B acceleration is negativeCin region C acceleration is positiveDin region D acceleration is negative
Velocity displacement graph of a particle moving in a straight line is as shown in figure.
 Amagnitude of acceleration of particle is decreasingBmagnitude of acceleration of particlre is increasingCacceleration versus displacement graph straight lineDacceleration versus displacement graph is parabola
The variation of velocity of a particle moving along a straight line is shown in . is
 .A37.5kmB32.5mC35.0mDNone of these
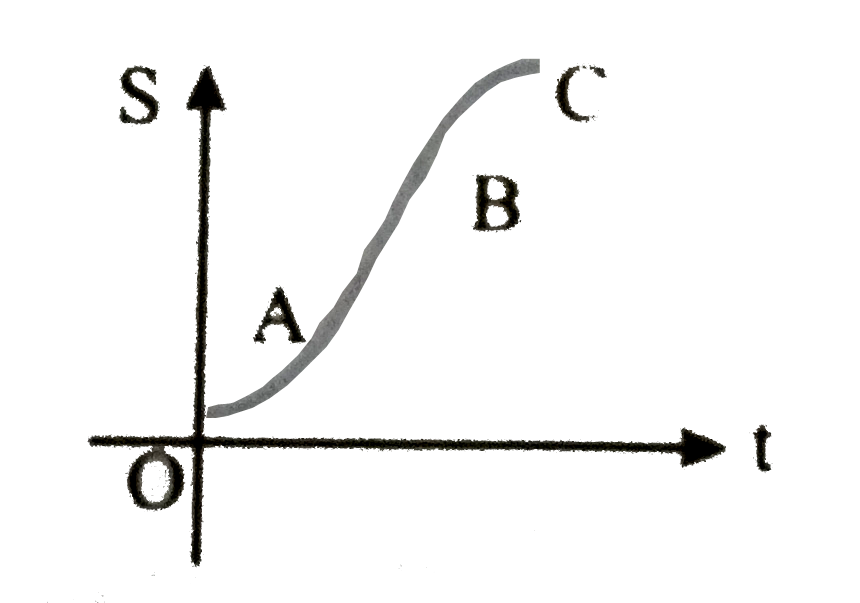
Displacement time graph of a particle moving in a straight line is as shown in figure. Select the correct alternative (s) :
 .
.
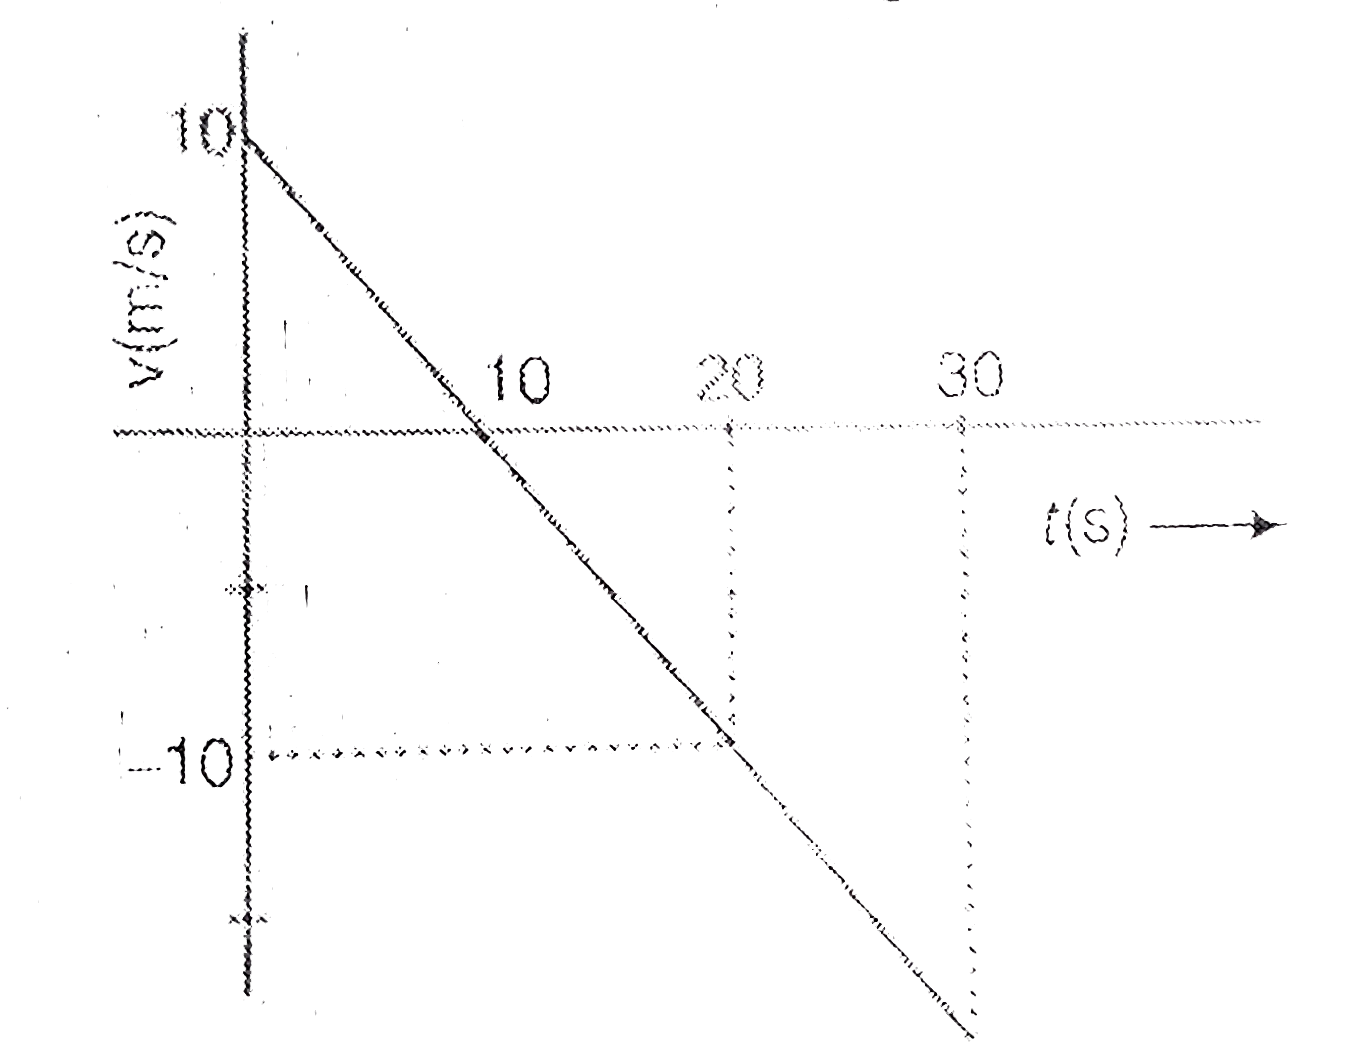
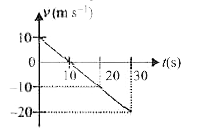
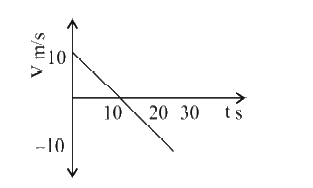
View SolutionThe velocity- time plot for a particle moving on a straight line is shown in the figure
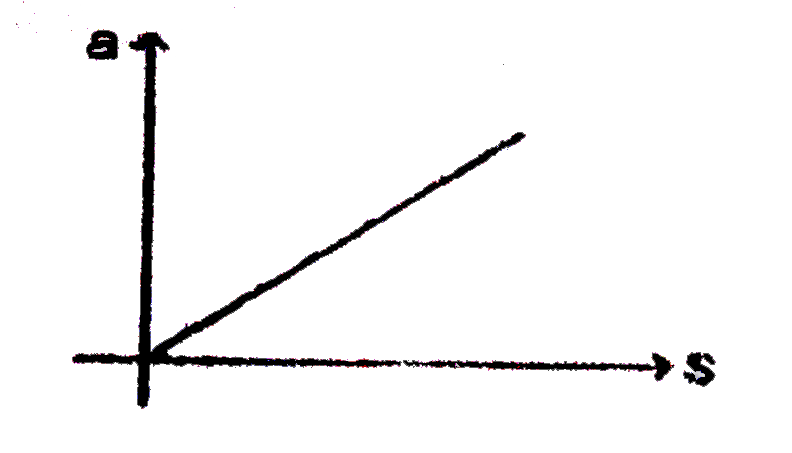
View SolutionAcceleration (a) -displacement (s) graph of a particle moving in a straight line is as shown in the figure. The initial velocity of the particle is zero. The v−s graph of the particle would be
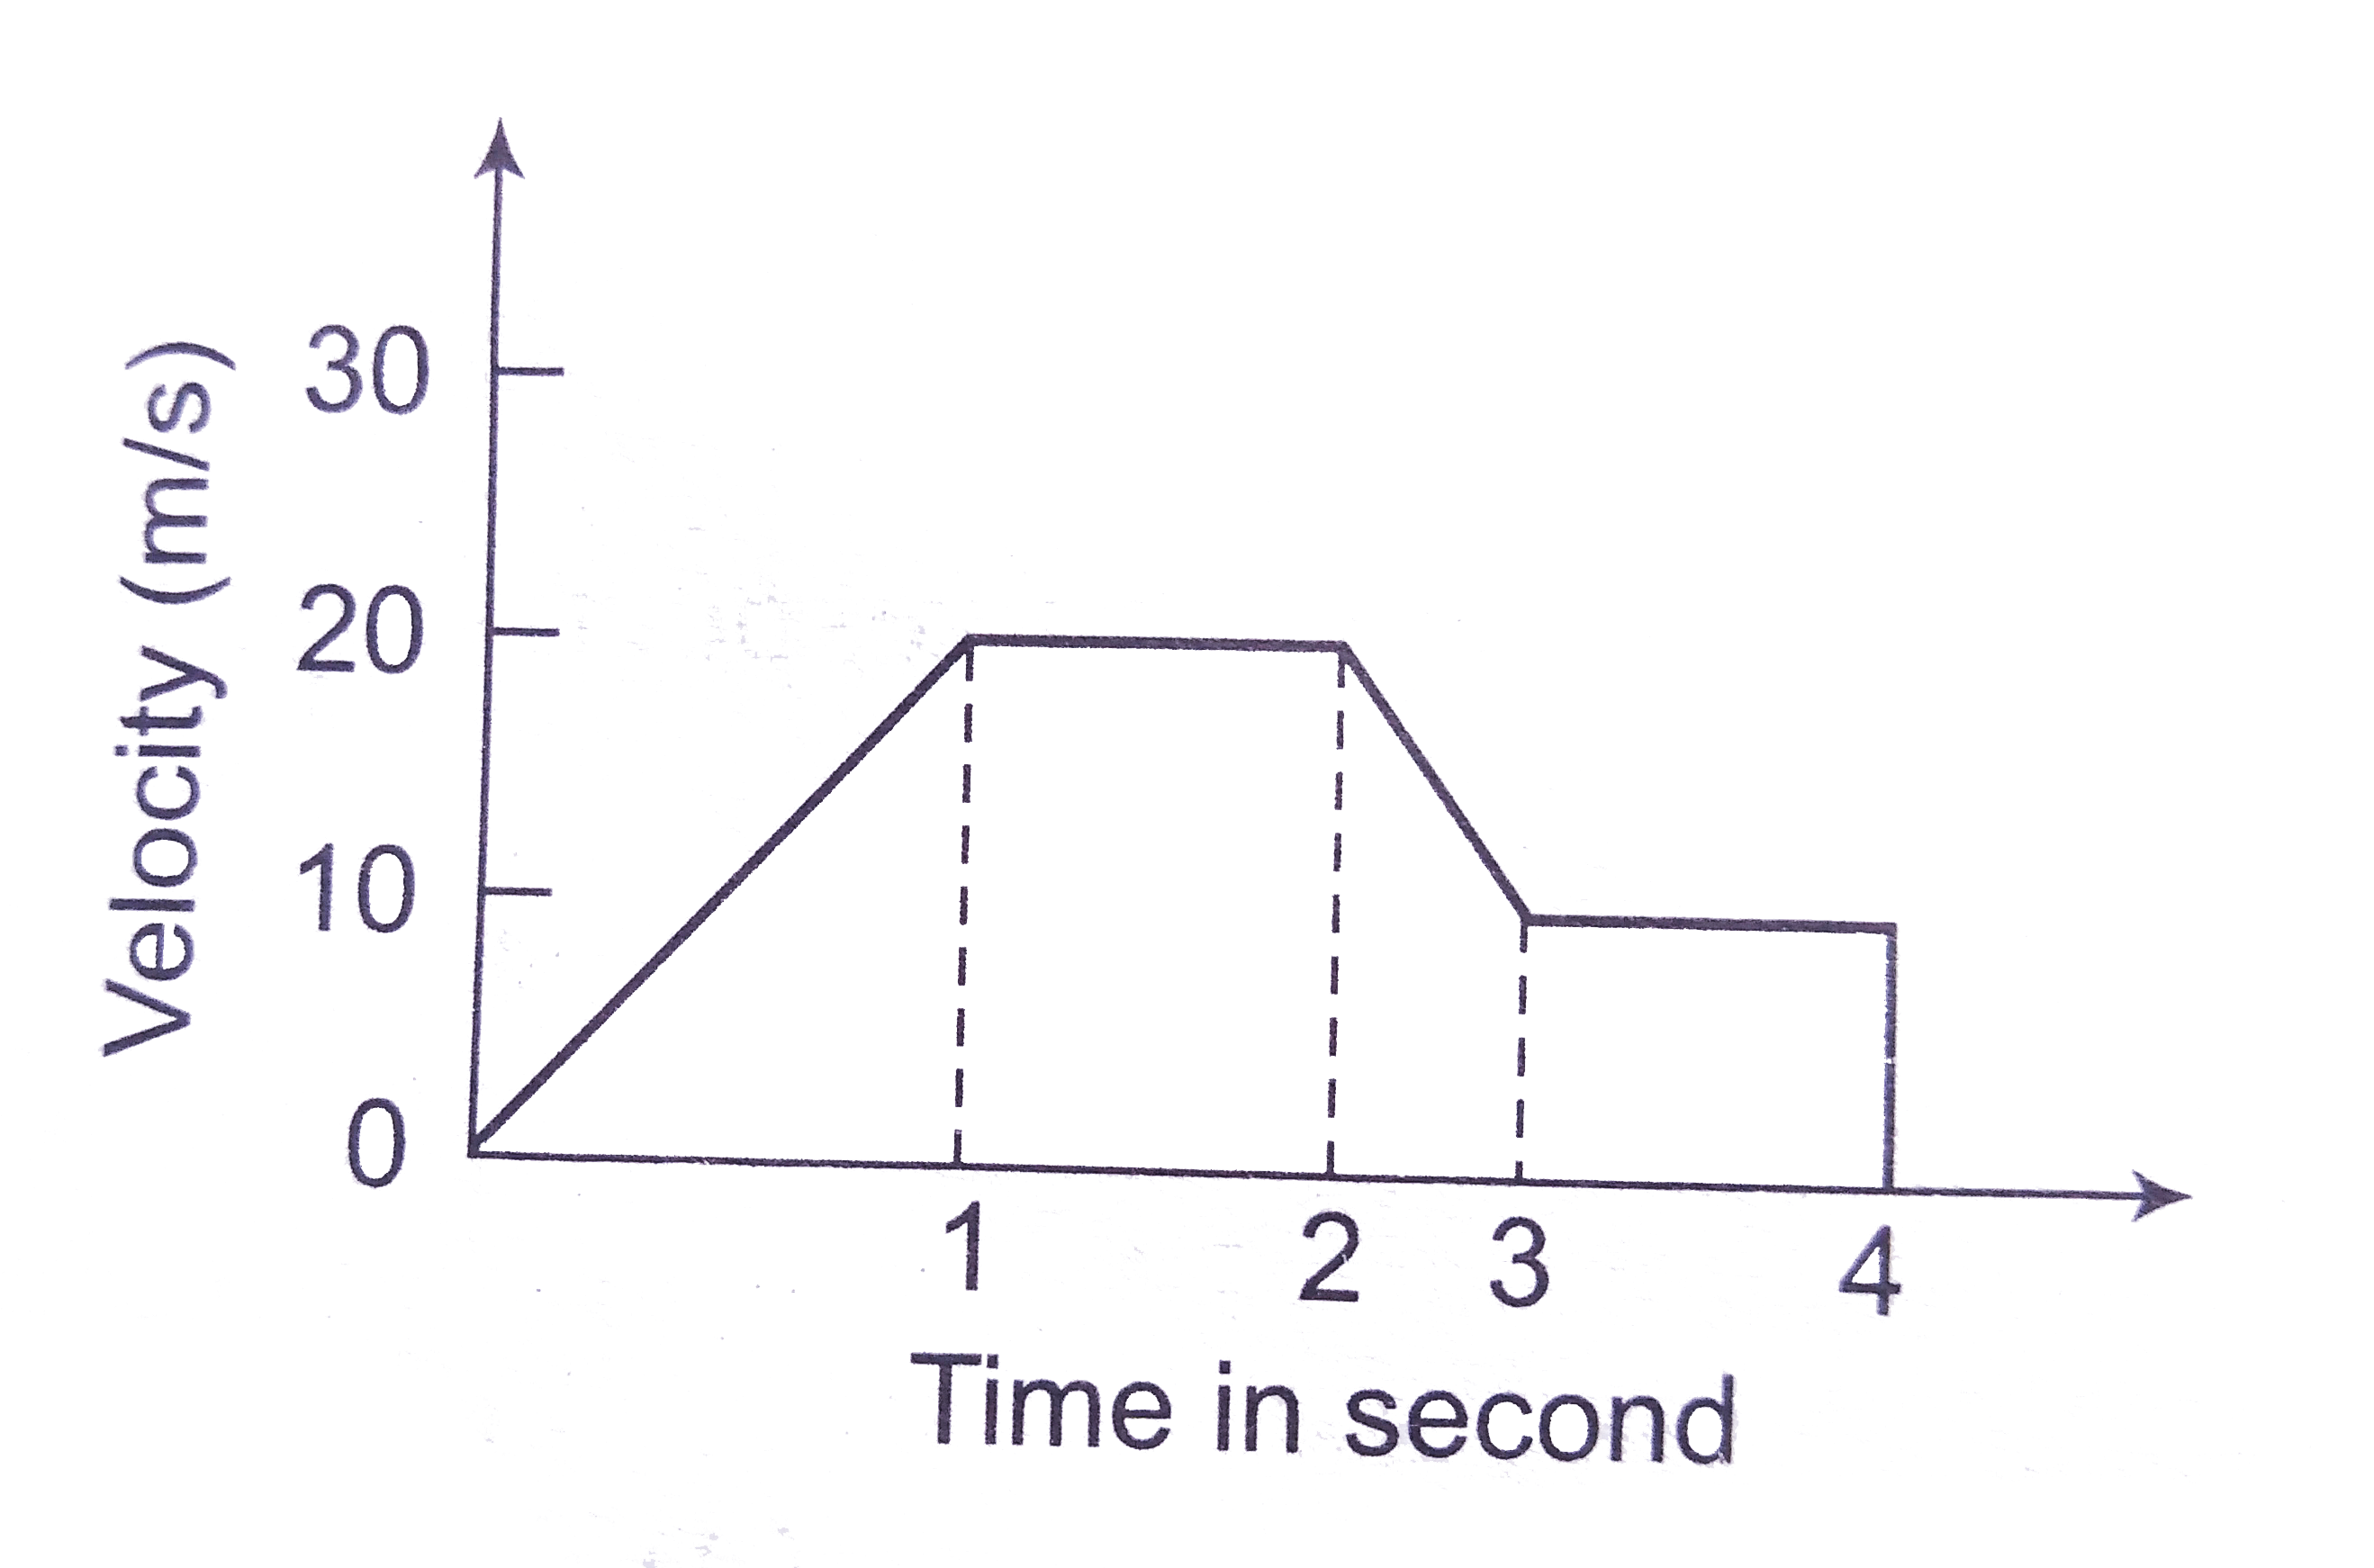
View SolutionThe variation of velocity of a particle with time moving along a straight line is illustrated in the following figure. The distance travelled by the particle in four seconds is.
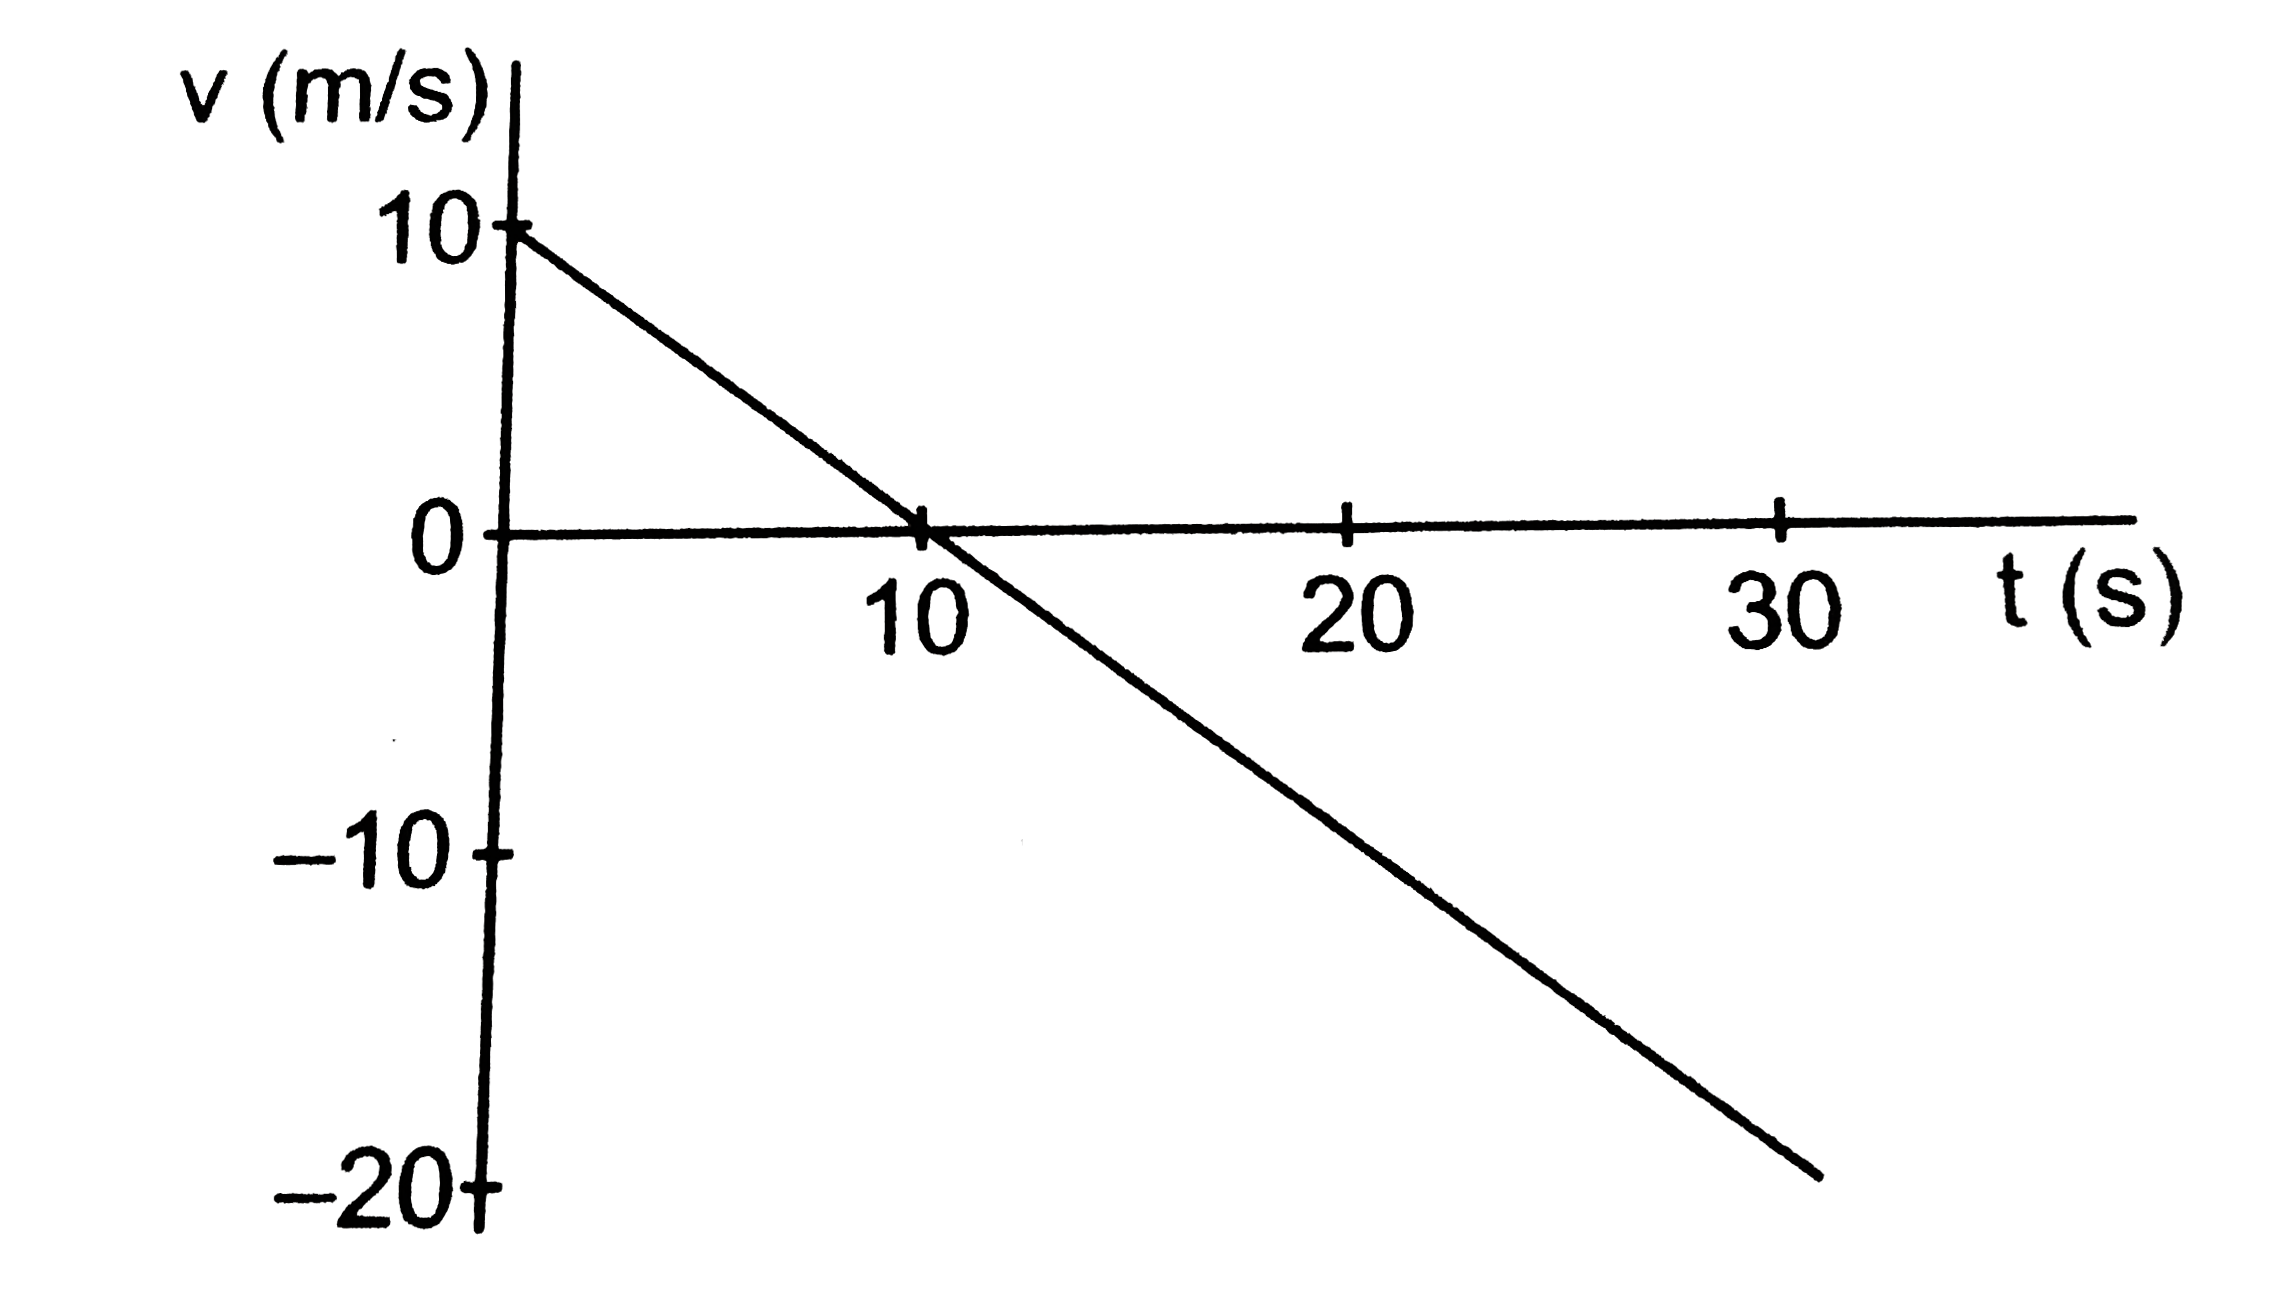
View SolutionThe velocity time plot for a particle moving on straight line is shown in the figure.
View Solution


