For which of the following graphs the average velocity of a particl moving along a straight line for time interval (0,t) must be negative−
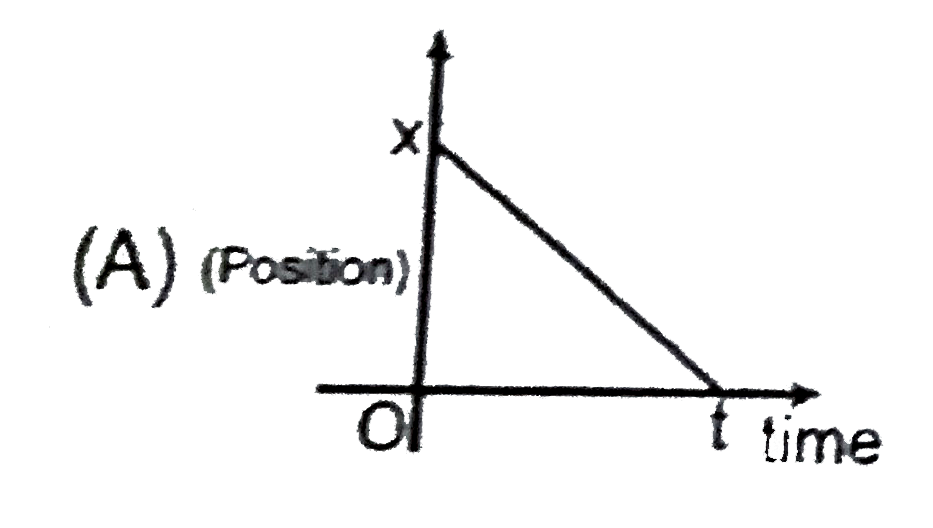
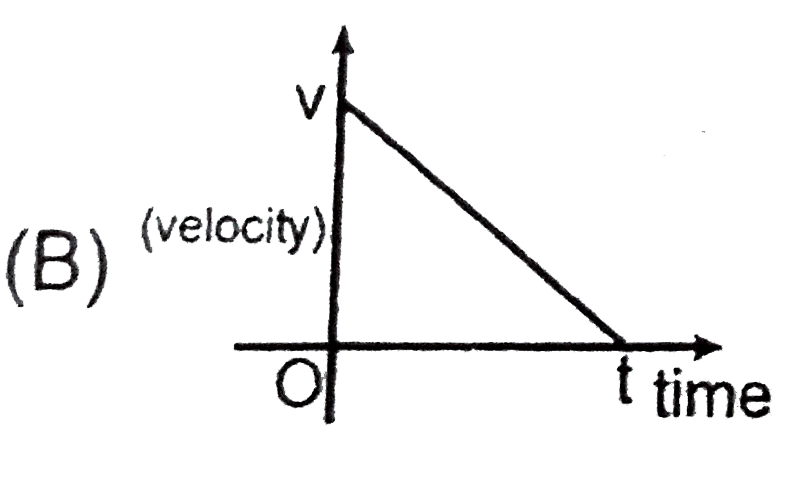
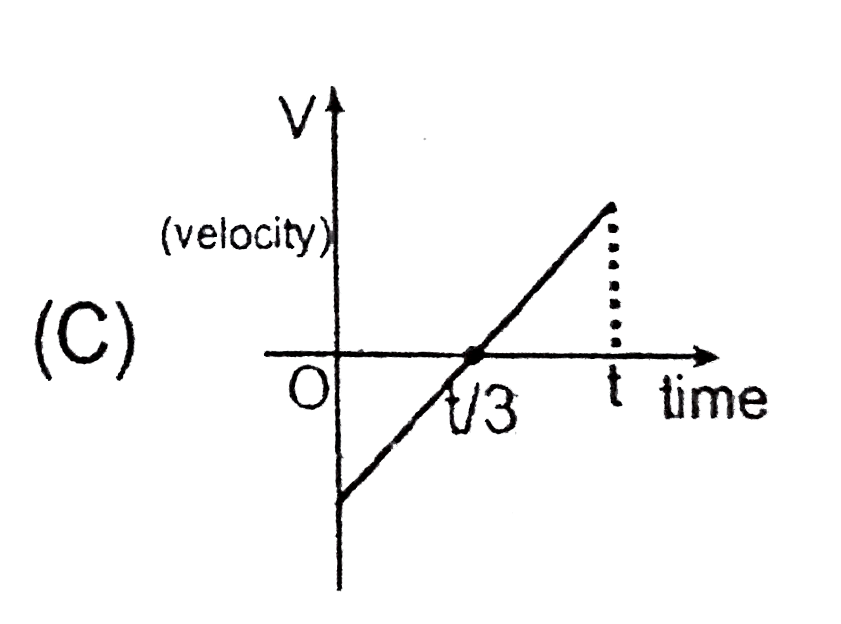
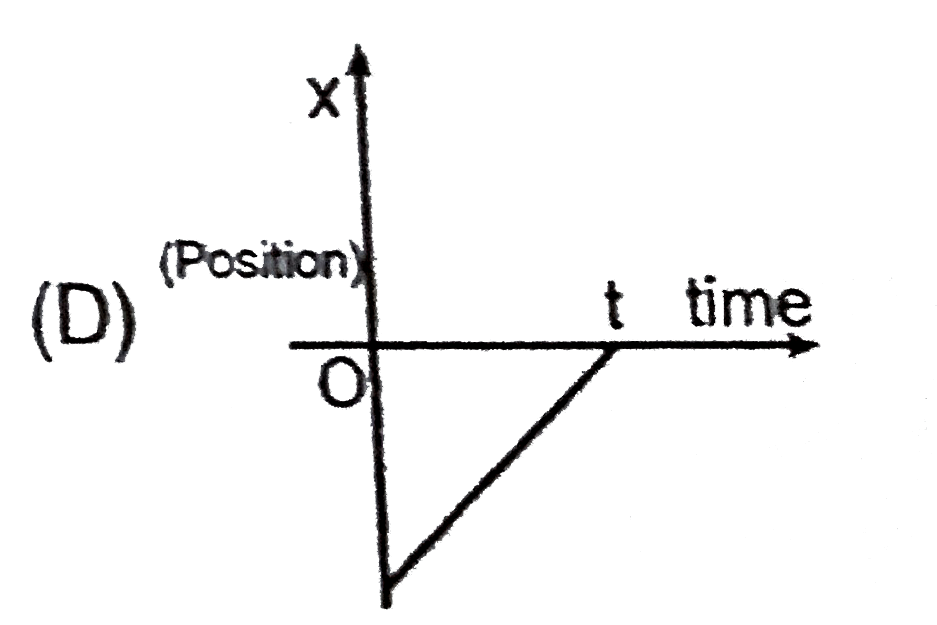
The correct Answer is:A
To determine which graph indicates that the average velocity of a particle moving along a straight line for the time interval (0, t) must be negative, we need to analyze the concept of average velocity and how it relates to displacement.
1. Understanding Average Velocity:
- Average velocity (V_avg) is defined as the total displacement (Δs) divided by the total time (Δt).
- Mathematically, it is expressed as:
Vavg=ΔsΔt
2. Identifying Displacement:
- Displacement (Δs) is the change in position of the particle from the initial position (s(0)) to the final position (s(t)).
- If the final position is less than the initial position, then Δs will be negative.
3. Analyzing Graphs:
- We need to look for a graph where the position of the particle decreases over the time interval from 0 to t.
- This means that the graph should show a downward trend or a slope that is negative.
4. Graph Interpretation:
- If the graph of position vs. time shows that the particle moves from a higher position to a lower position, the displacement (Δs) will be negative.
- Therefore, if Δs is negative and Δt is always positive (since time cannot be negative), the average velocity will also be negative.
5. Conclusion:
- The graph that shows a downward slope from left to right indicates that the average velocity for the interval (0, t) must be negative.
- Average velocity (V_avg) is defined as the total displacement (Δs) divided by the total time (Δt).
- Mathematically, it is expressed as:
Vavg=ΔsΔt
- Displacement (Δs) is the change in position of the particle from the initial position (s(0)) to the final position (s(t)).
- If the final position is less than the initial position, then Δs will be negative.
- We need to look for a graph where the position of the particle decreases over the time interval from 0 to t.
- This means that the graph should show a downward trend or a slope that is negative.
- If the graph of position vs. time shows that the particle moves from a higher position to a lower position, the displacement (Δs) will be negative.
- Therefore, if Δs is negative and Δt is always positive (since time cannot be negative), the average velocity will also be negative.
- The graph that shows a downward slope from left to right indicates that the average velocity for the interval (0, t) must be negative.
Topper's Solved these Questions
- DAILY PRACTICE PROBLEMSBOOK - RESONANCECHAPTER - DAILY PRACTICE PROBLEMSEXERCISE - dpp 20
8 Videos
- DAILY PRACTICE PROBLEMSBOOK - RESONANCECHAPTER - DAILY PRACTICE PROBLEMSEXERCISE - dpp 21
8 Videos
- DAILY PRACTICE PROBLEMSBOOK - RESONANCECHAPTER - DAILY PRACTICE PROBLEMSEXERCISE - dpp 18
7 Videos
- CURRENT ELECTRICITYBOOK - RESONANCECHAPTER - CURRENT ELECTRICITYEXERCISE - Exercise
54 Videos
- ELASTICITY AND VISCOCITYBOOK - RESONANCECHAPTER - ELASTICITY AND VISCOCITYEXERCISE - Advanced Level Problems
9 Videos
Similar Questions
Knowledge Check
If average velocity of particle moving on a straight line is zero in a time interval, then
AAcceleration of particle may be zeroBVelocity of particle must be zero at an instantCVelocity of particle may be never zero in the intervalDAverage speed of particle may be zero in the intervalThe figure shows a velocity-time graph of a particle moving along a straight line
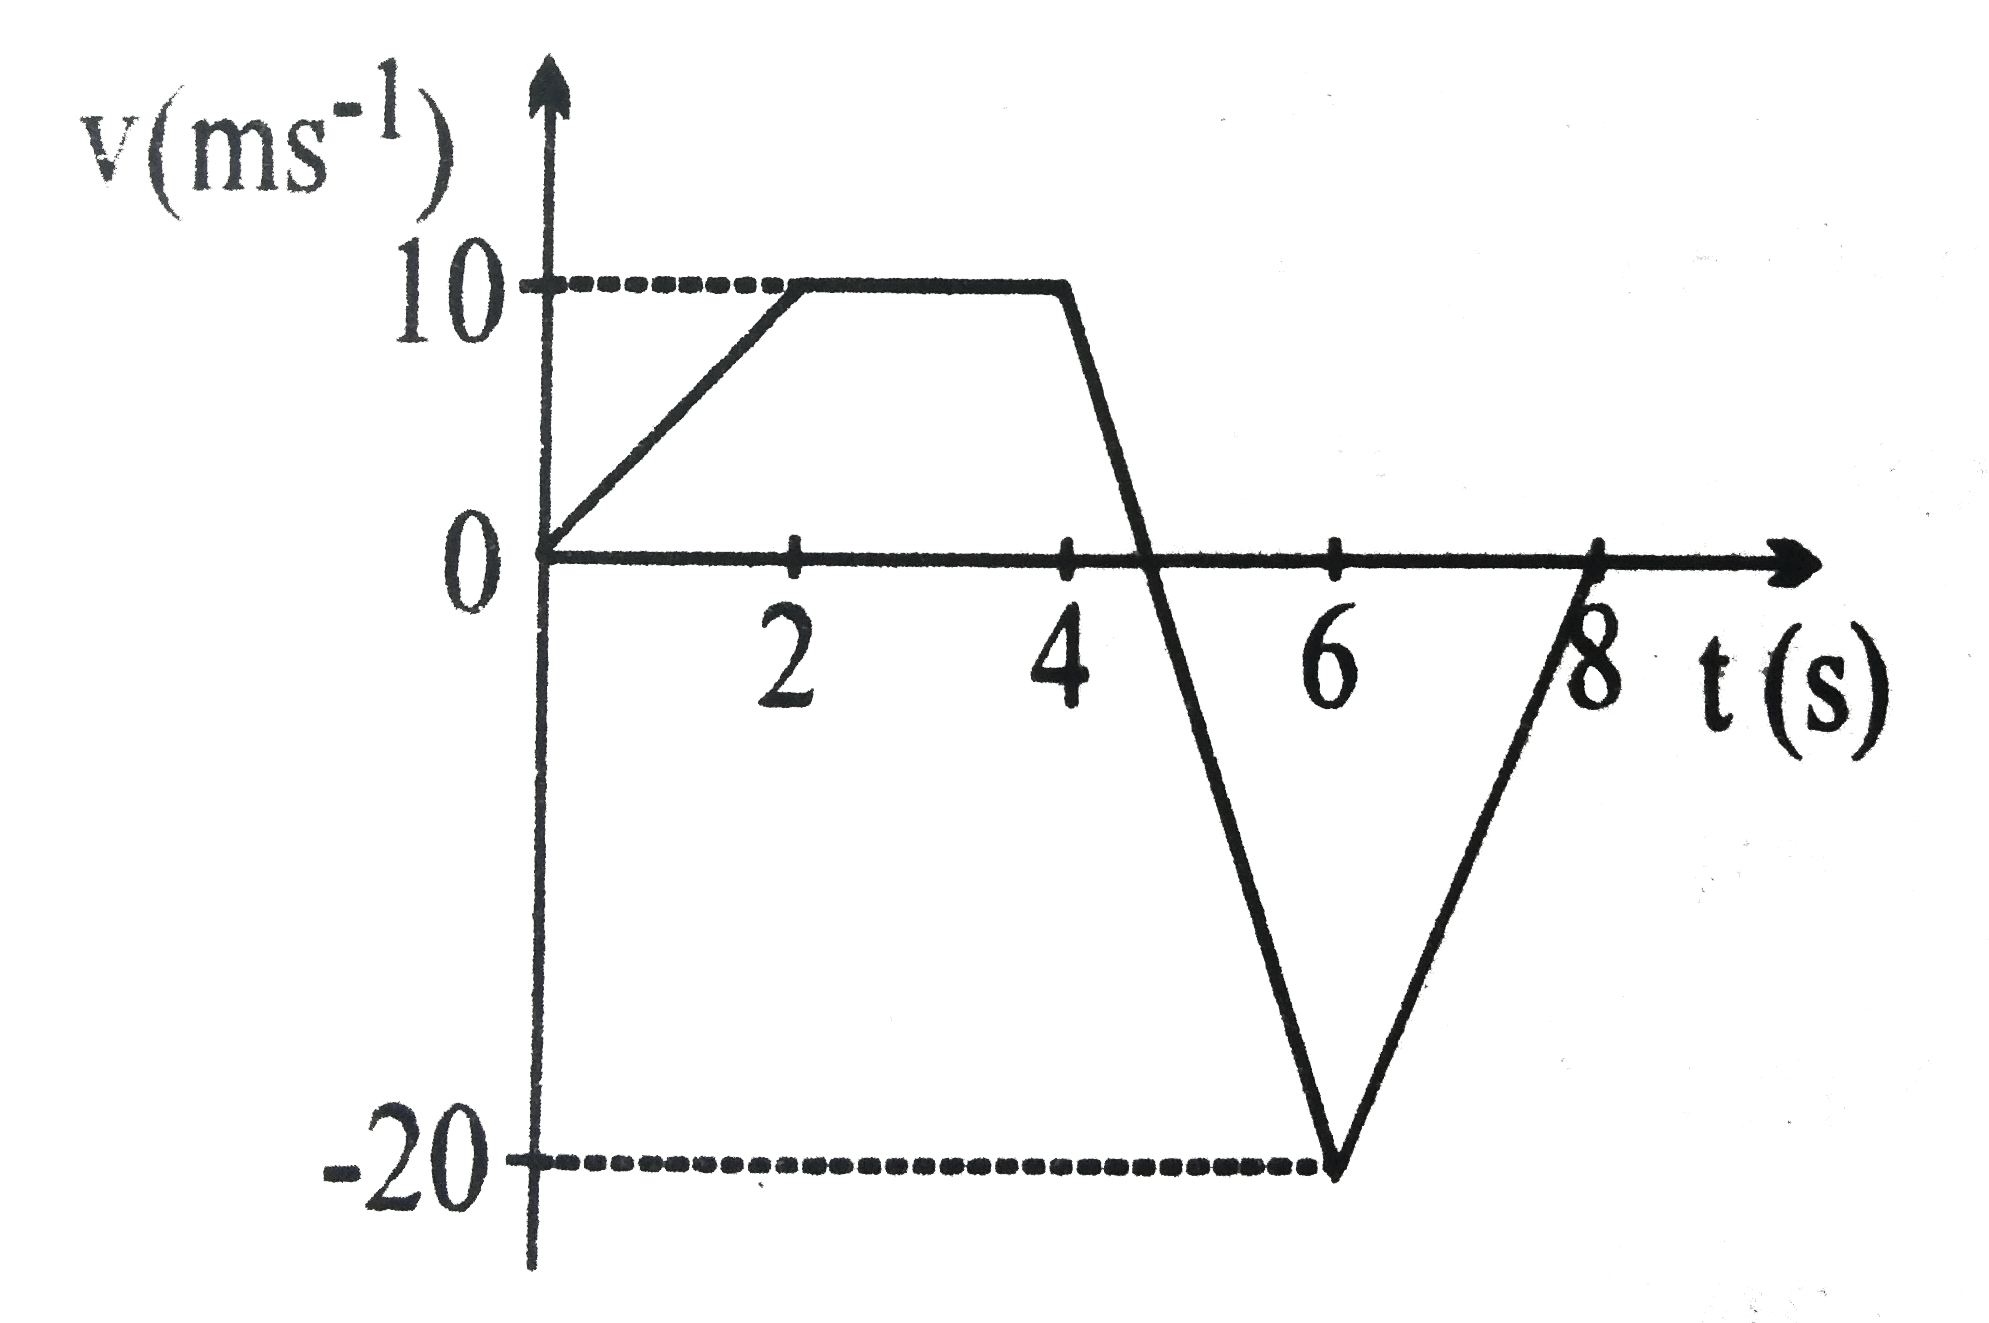
The maximum displacement of the particle isA33.3mB23.3mC18.3mDzeroThe figure shows a velocity-time graph of a particle moving along a straight line
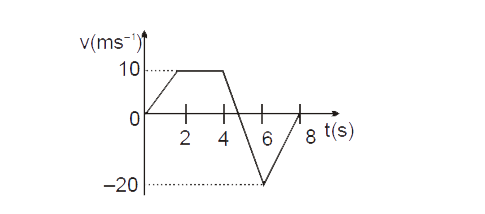
The total distance travelled by the particle isA66.6 mB51.6 mCzeroD36.6m
The figure shows a velocity-time graph of a particle moving along a straight line
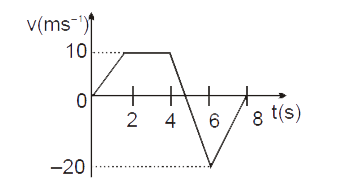
The maximum of displacement of the particle is
View SolutionThe figure shows a velocity-time graph of a particle moving along a straight line
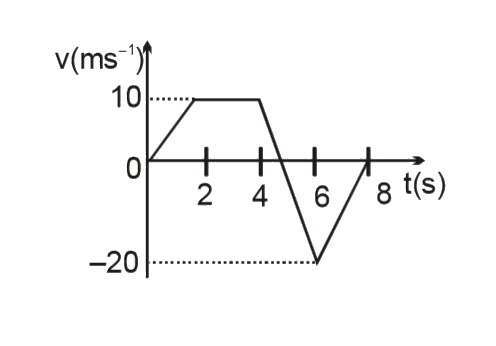
Q. The total distance travelled by the particle is
View SolutionThe figure shows velocity-time graph of a particle moving along a straight line. Identify the correct statement.
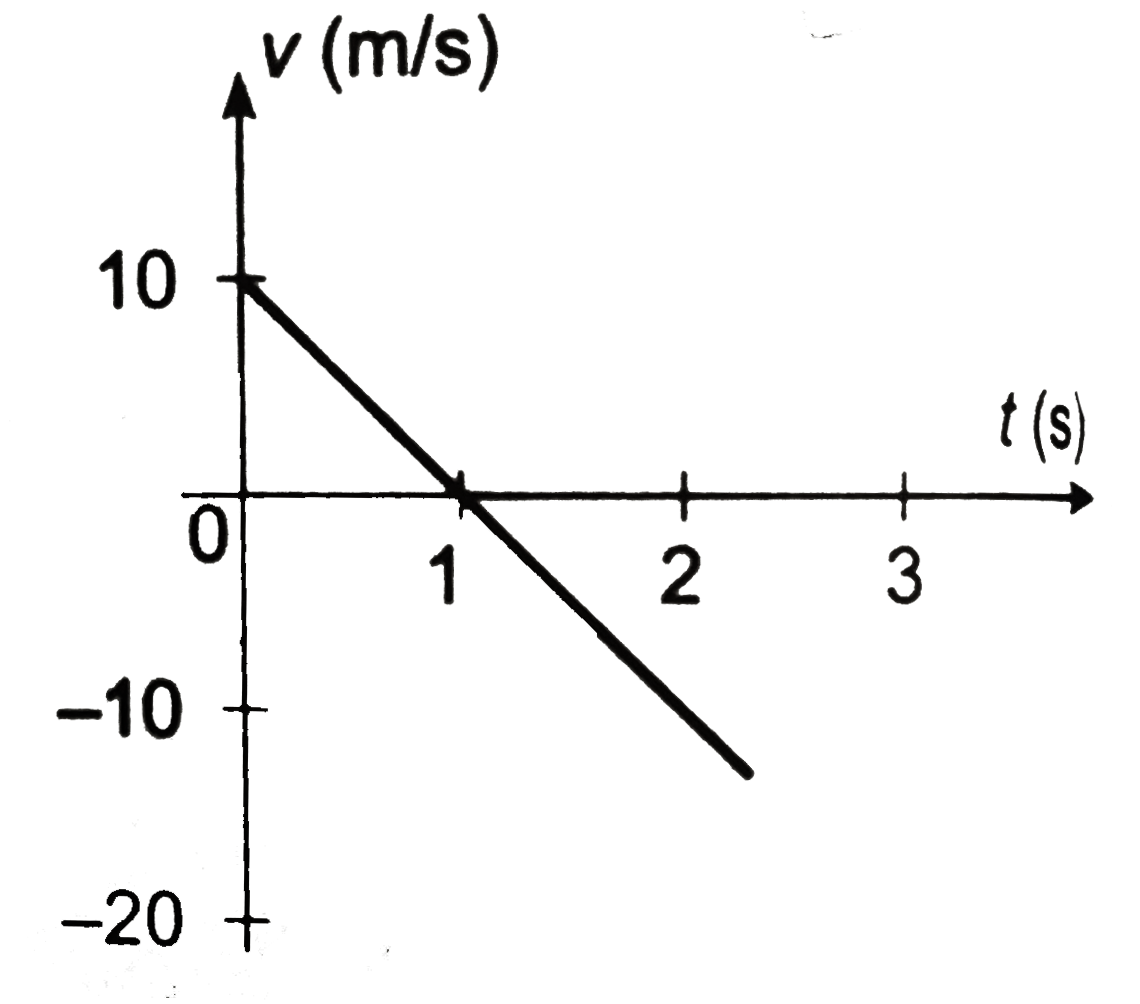
View SolutionThe figure shows a velocity-time graph of a particle moving along a straight line
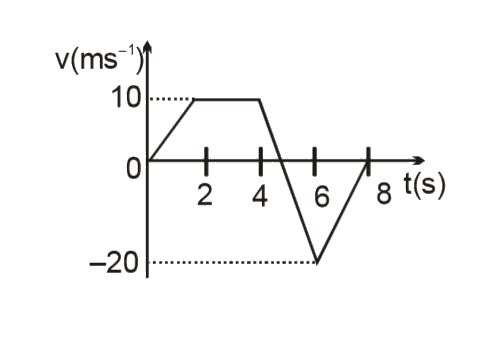
Q. The maximum of displacement of the particle is
View SolutionThe distance-time graph of a particle moving along a curved path is a straight line .
View Solution

