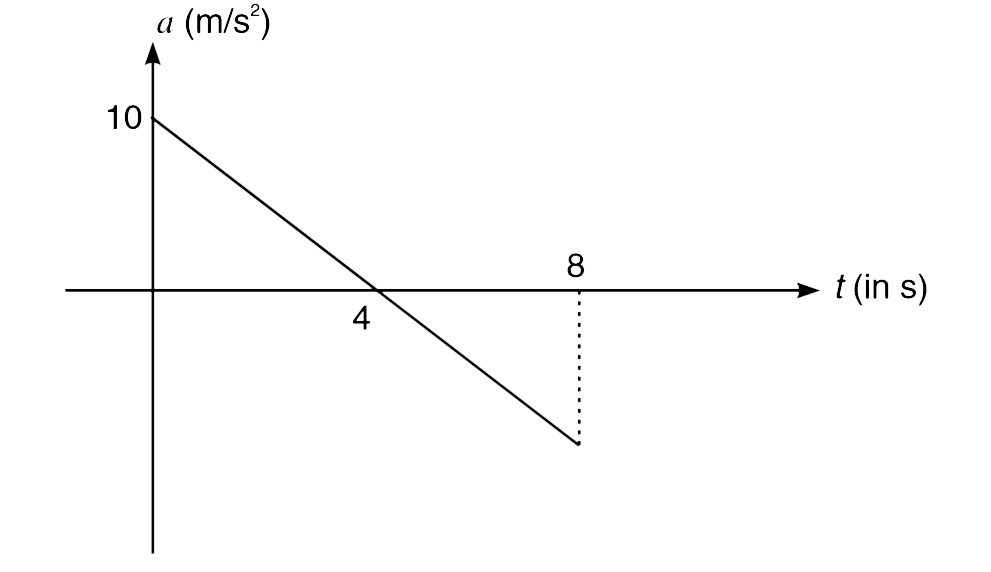
A particle is moving along the x-axis. Consider it’s a-t graph. If initial velocity is 10 m//s, sketch the v-t graph and calculate the displacement in the time interval t=0 to 12 s.
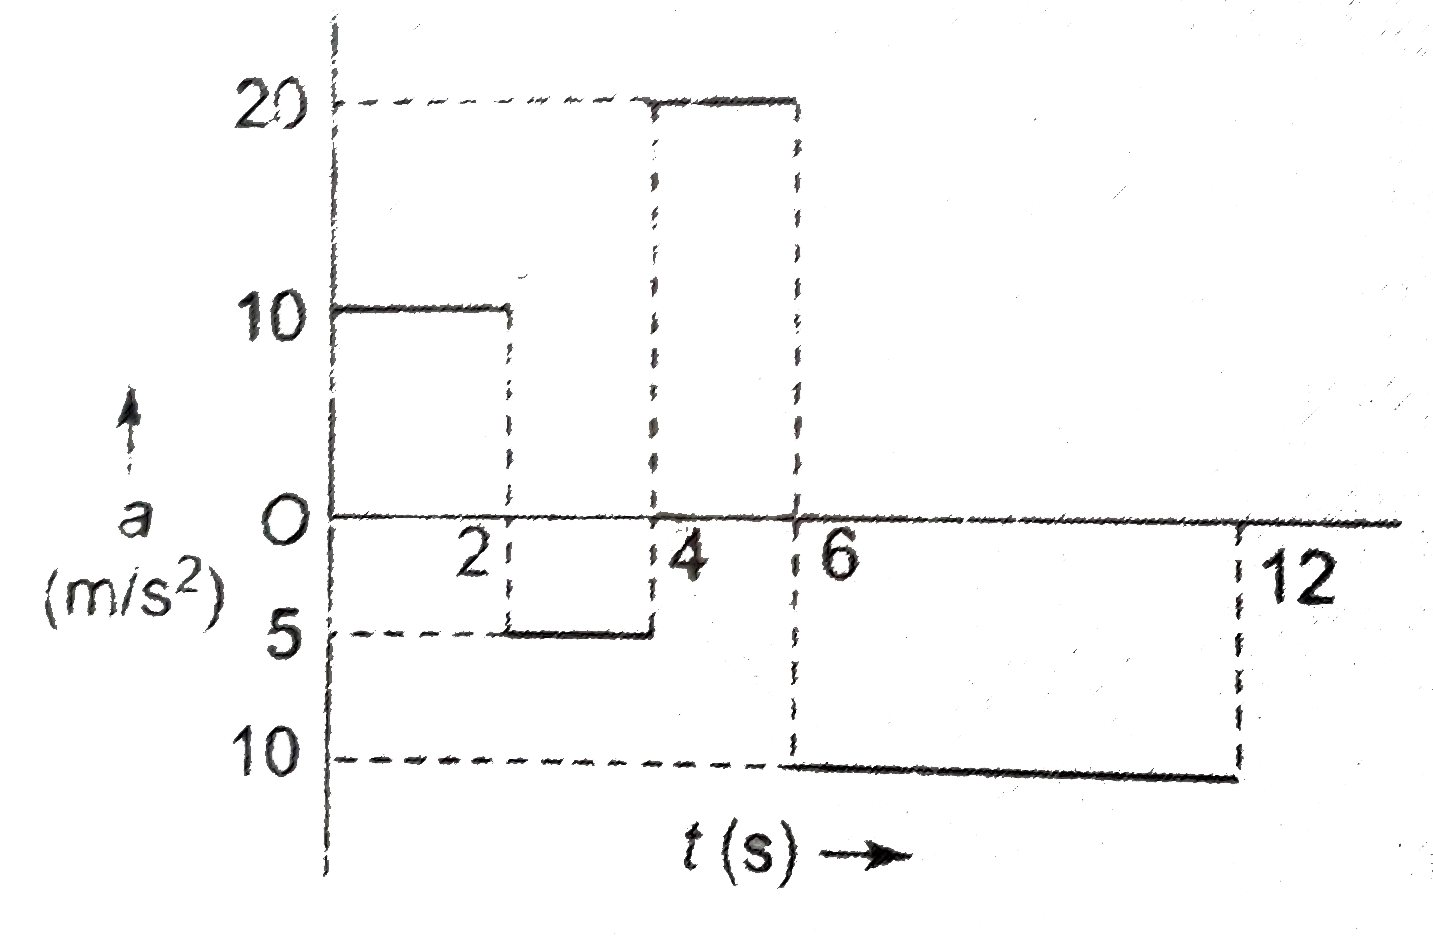
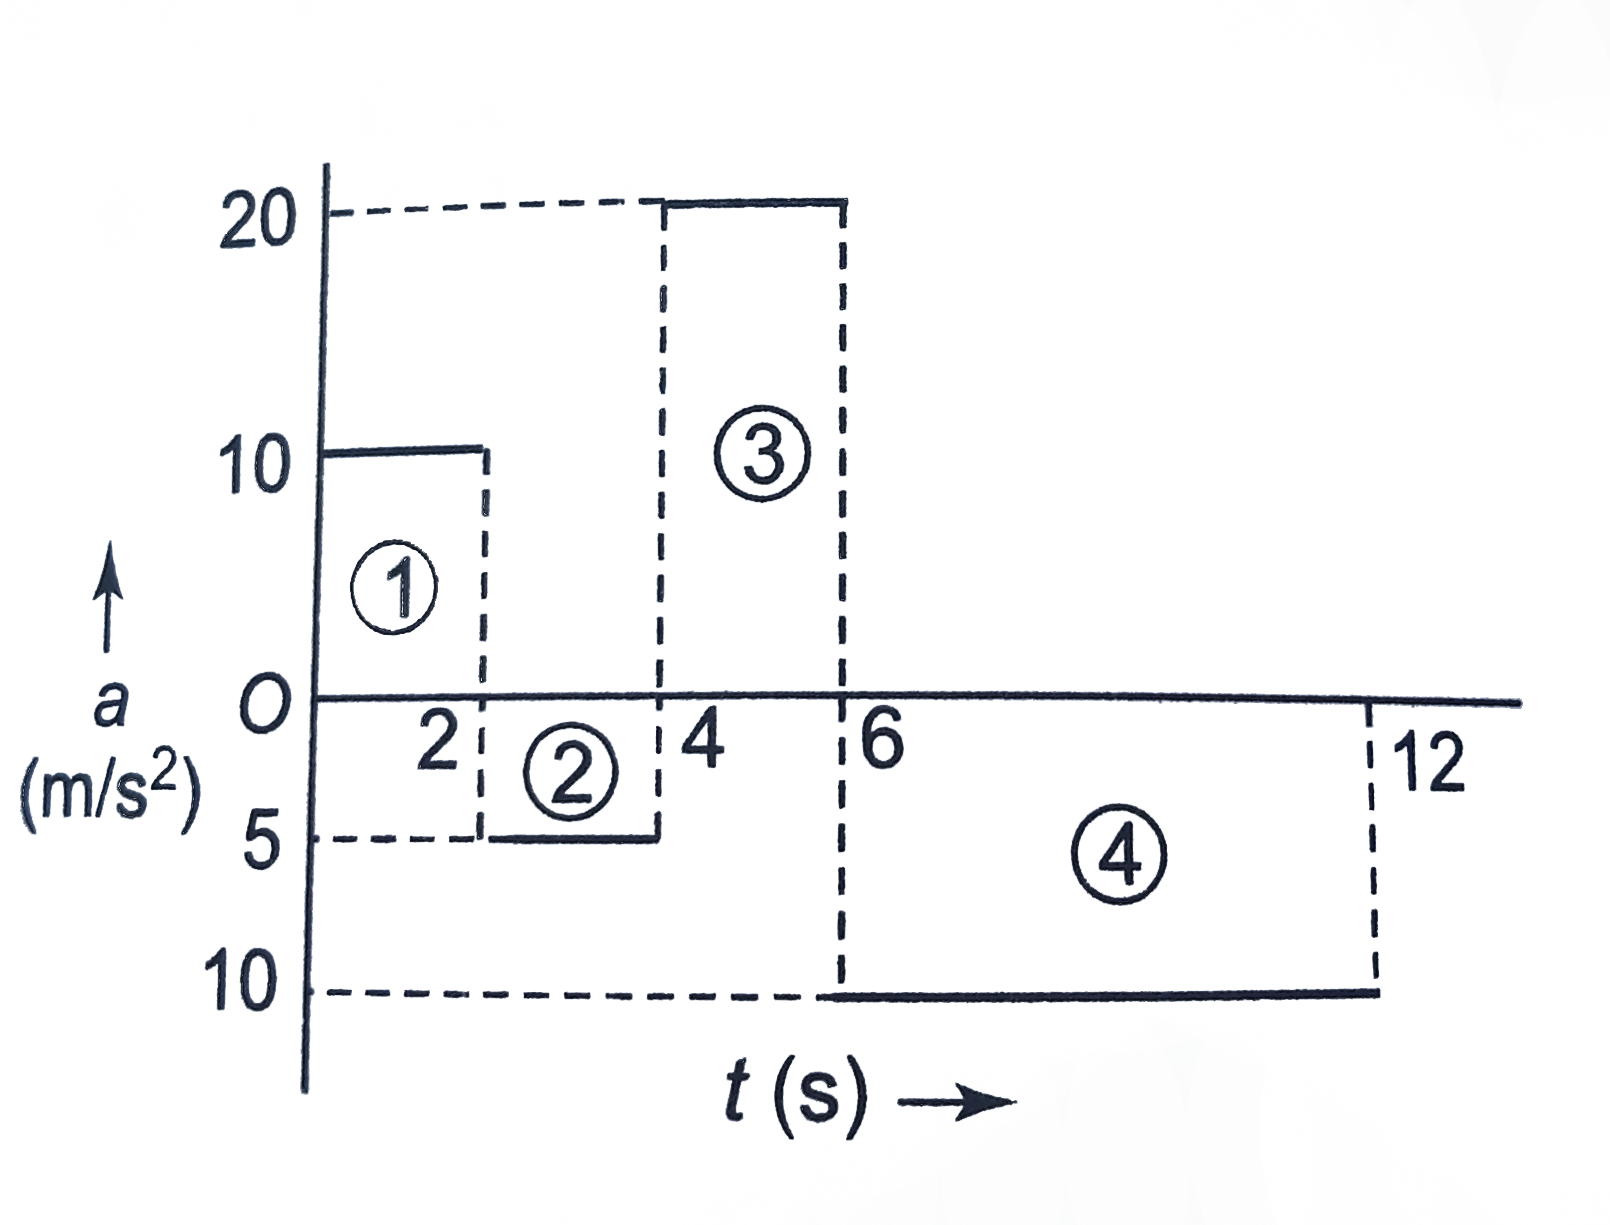
At t=0,vt=10=10m/s
vt=2−vt=0=Area(1)=20⇒vt=2−10=20⇒vt=2=30m/s
vt=4−vt=2=Area(2)=−10⇒vt=4=20m/s
vt=6−vt=4=Area(3)=40⇒vt=6=60m/s
vt=12−vt=6=Area(4)=−60⇒vt=12=0
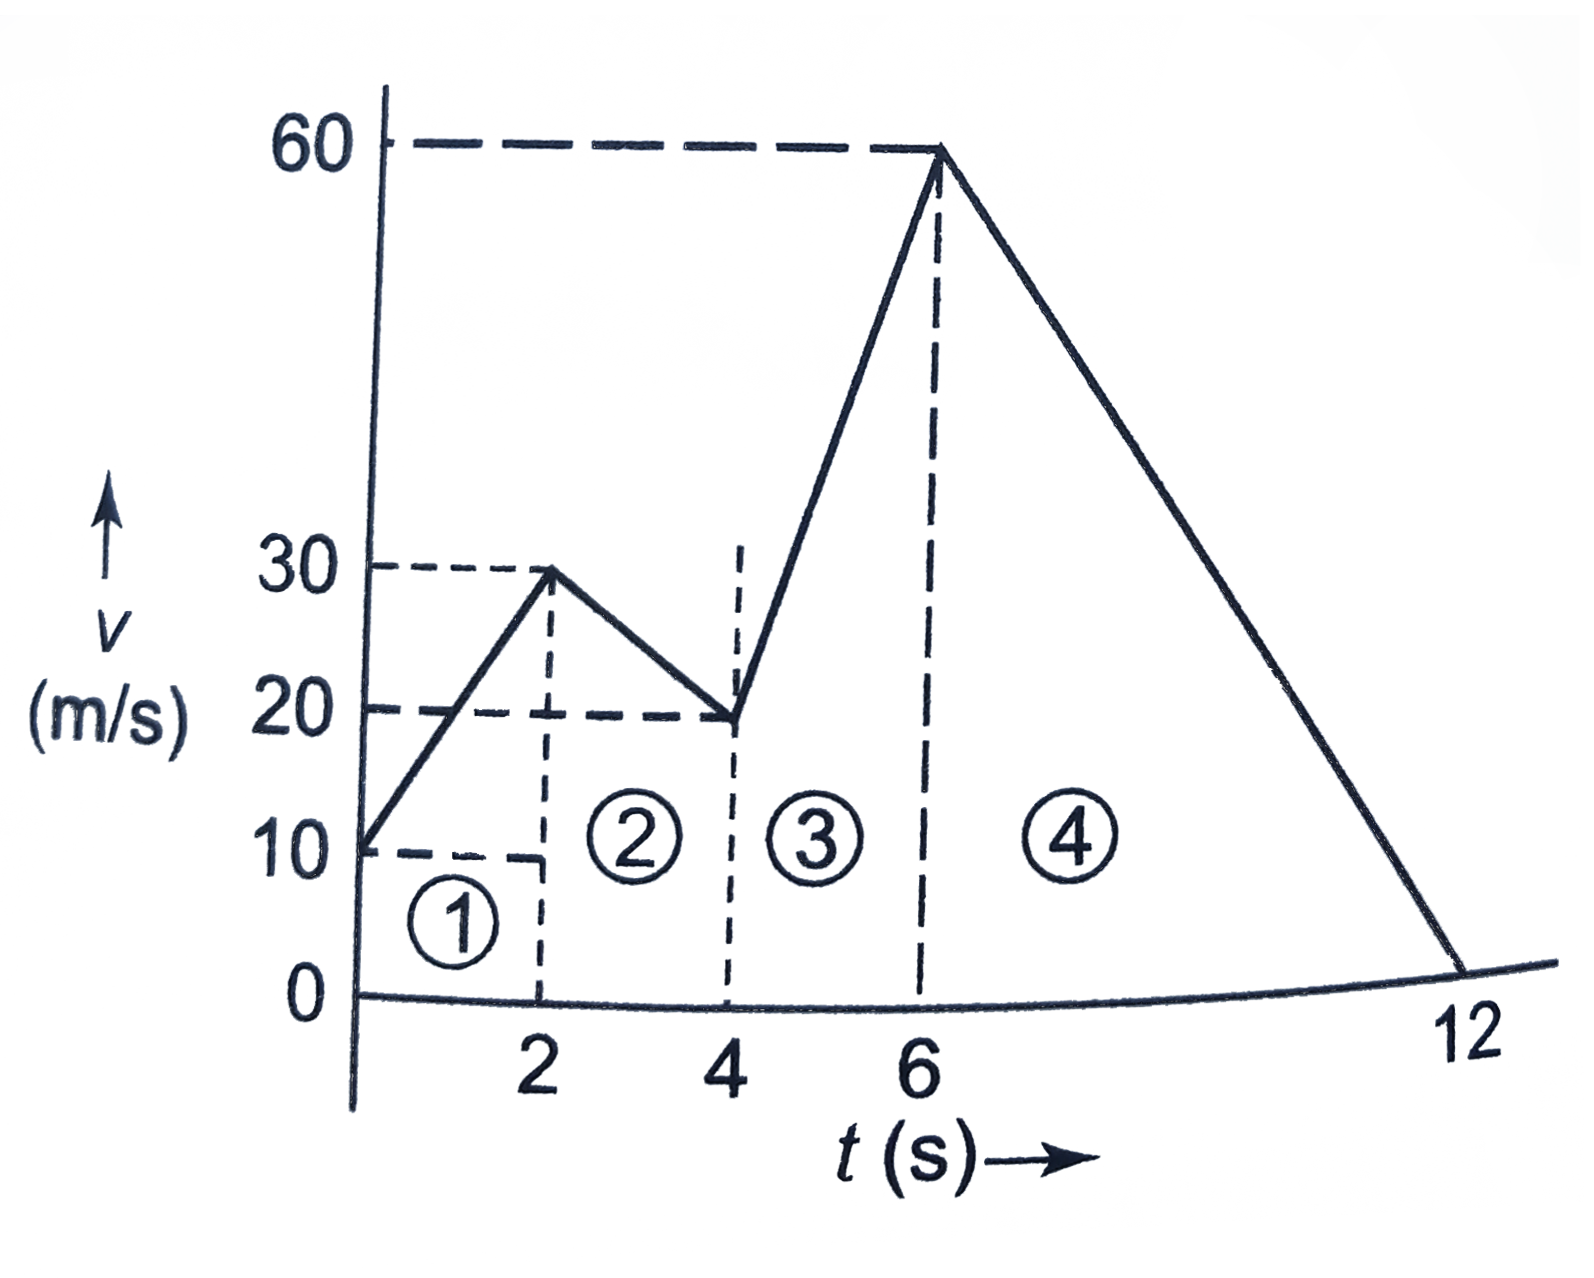
Area(1)=12(10+30)2=40
Area(2)=12(30+20)×2=50
Area(3)=12(20+60)×2=80
Area(4)=12×60+6=180
From t=0 to t=12s,
Displacement=40+50+80+180=350m
Topper's Solved these Questions
Similar Questions
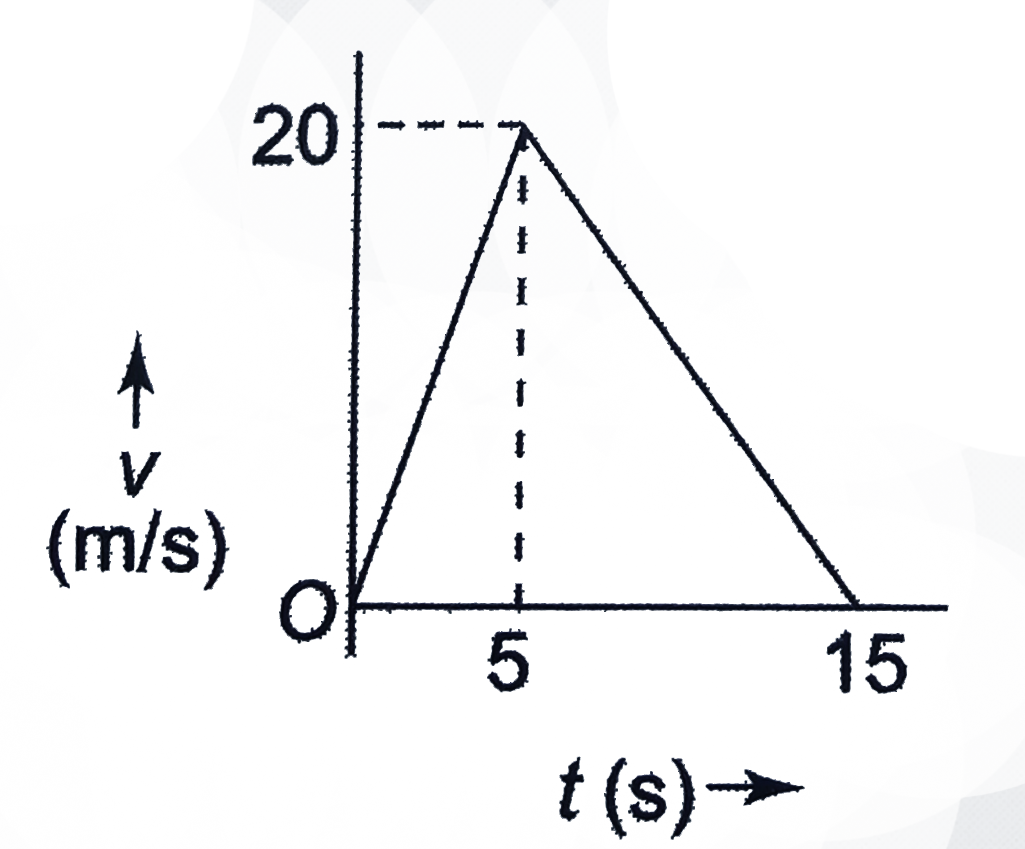
From the following v-t graph, find the displacement for time interval t=3 to t=12s.
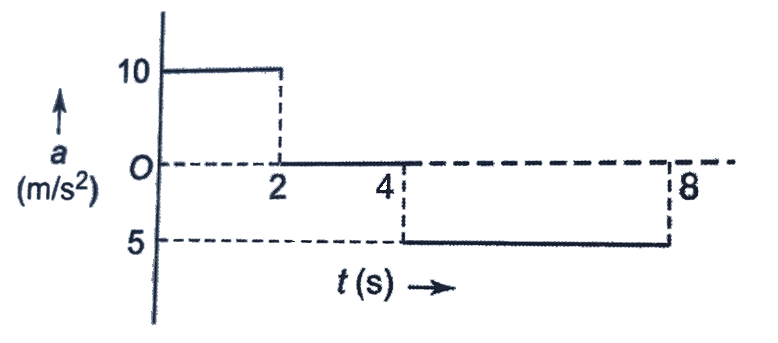
View SolutionConsider the following a-t graph for a particle moving along the x-axis. If the initial velocity is zero, sketch the v-t graph.
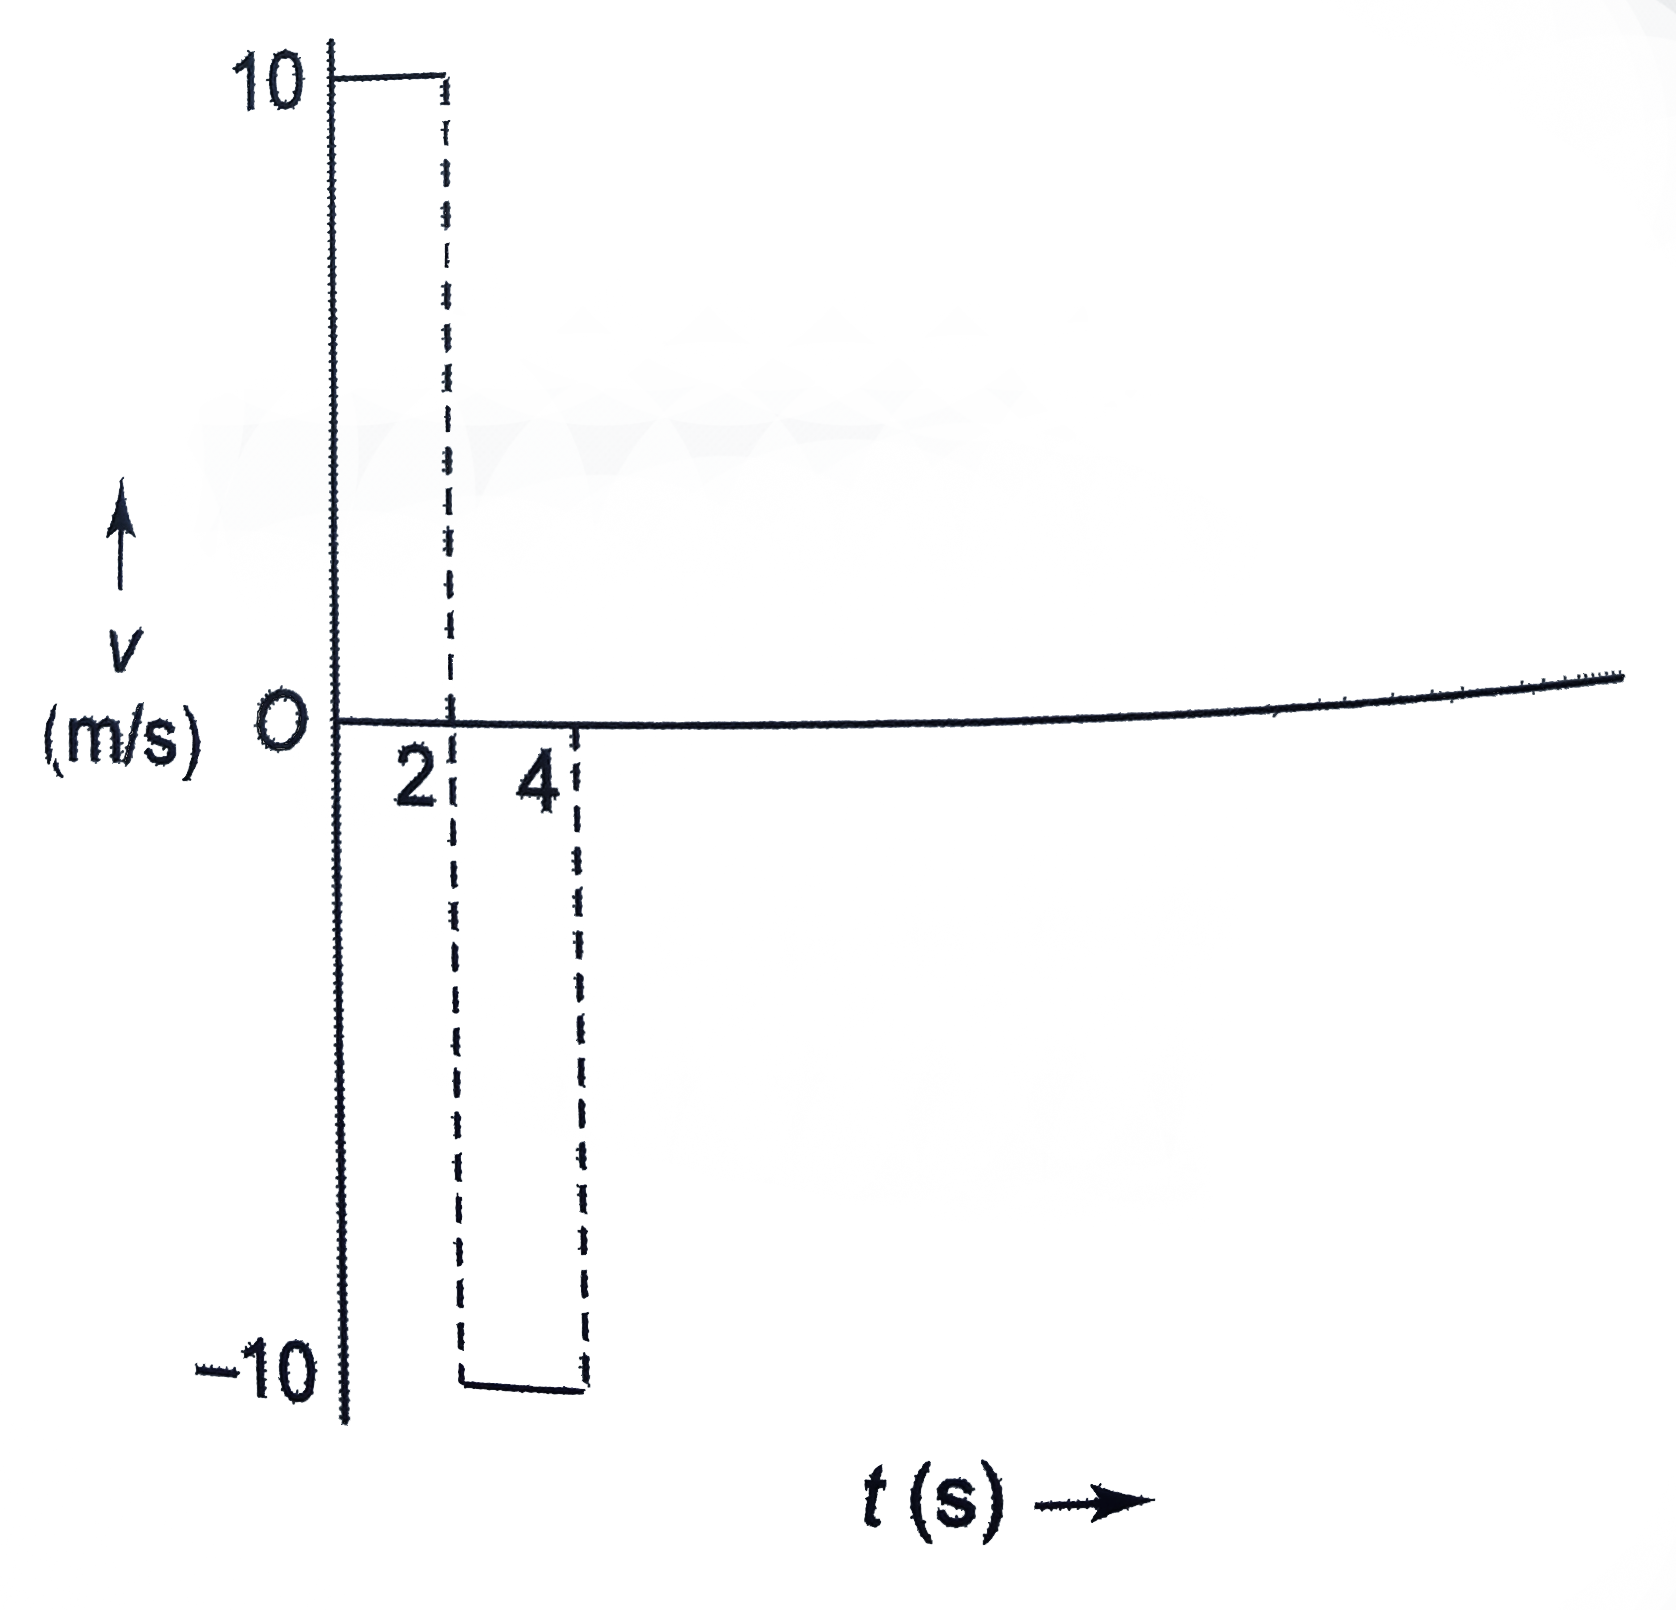
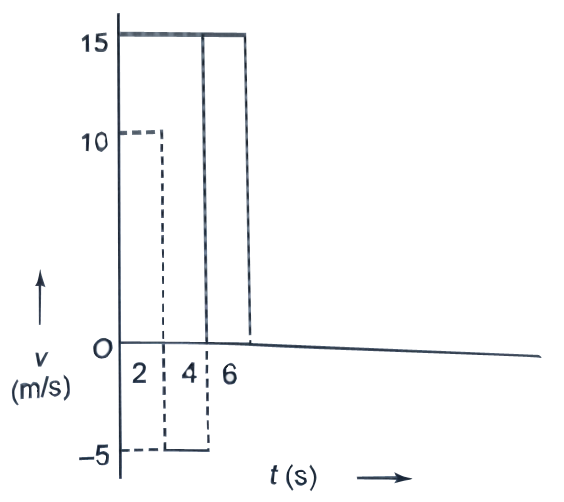
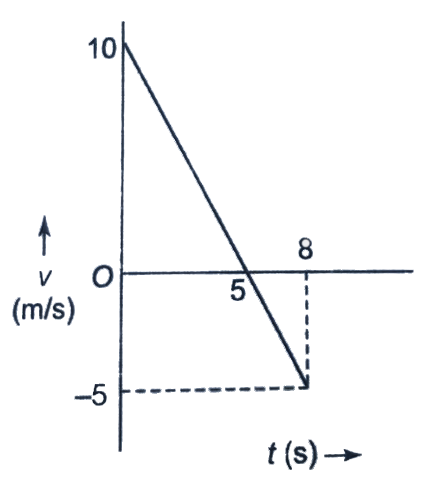
View SolutionA partical is moving along the x-axis and its velocity-time graph is shown in following diagrams. Sketch displacement-time graph.
View SolutionA particle is moving in a straight line under constant acceleration alpha. If the intial velocity is v0, sketch the v-t and s-t graphs. (v0>0).
View SolutionA particle is moving along the x-axis and its velocity-time graph ia as shown in the following diagrems. Sketch the displacement-time graph.
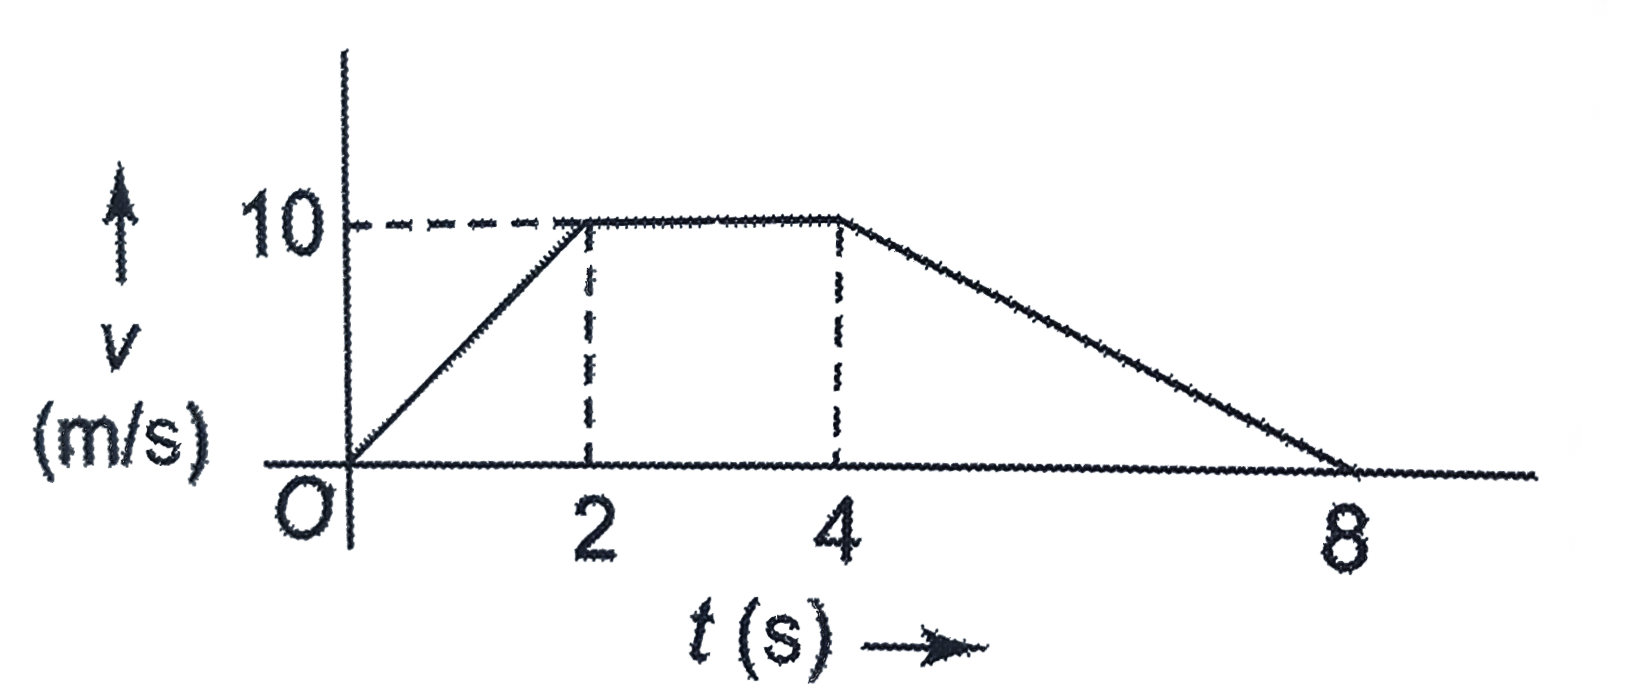
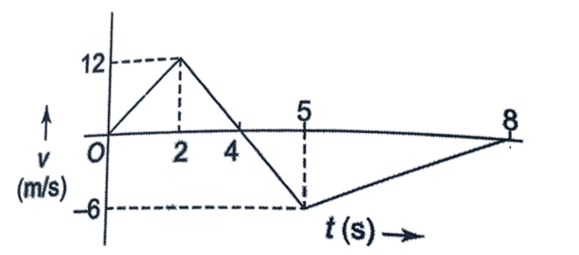
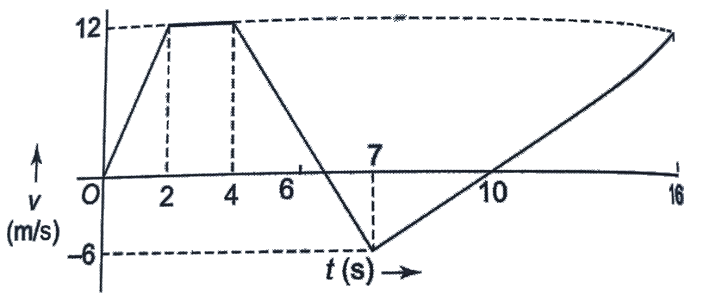
View SolutionA particle is moving in a straight line. Its v-t graph in different cases are as shown below. Find the diplacement and distance in time interval t=0 to t=10 s for the following cases:
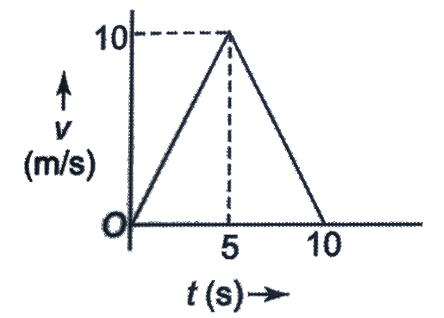
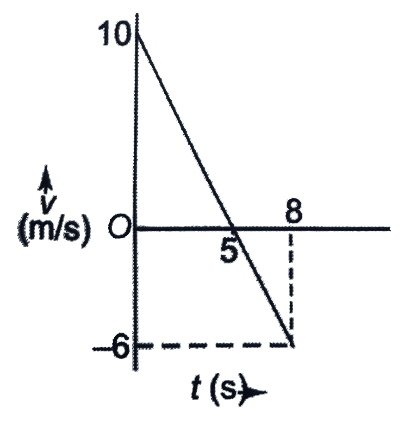
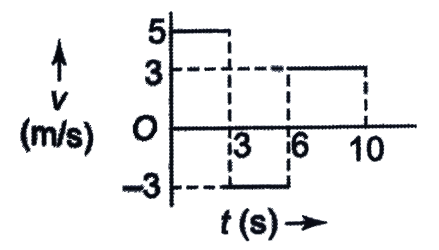
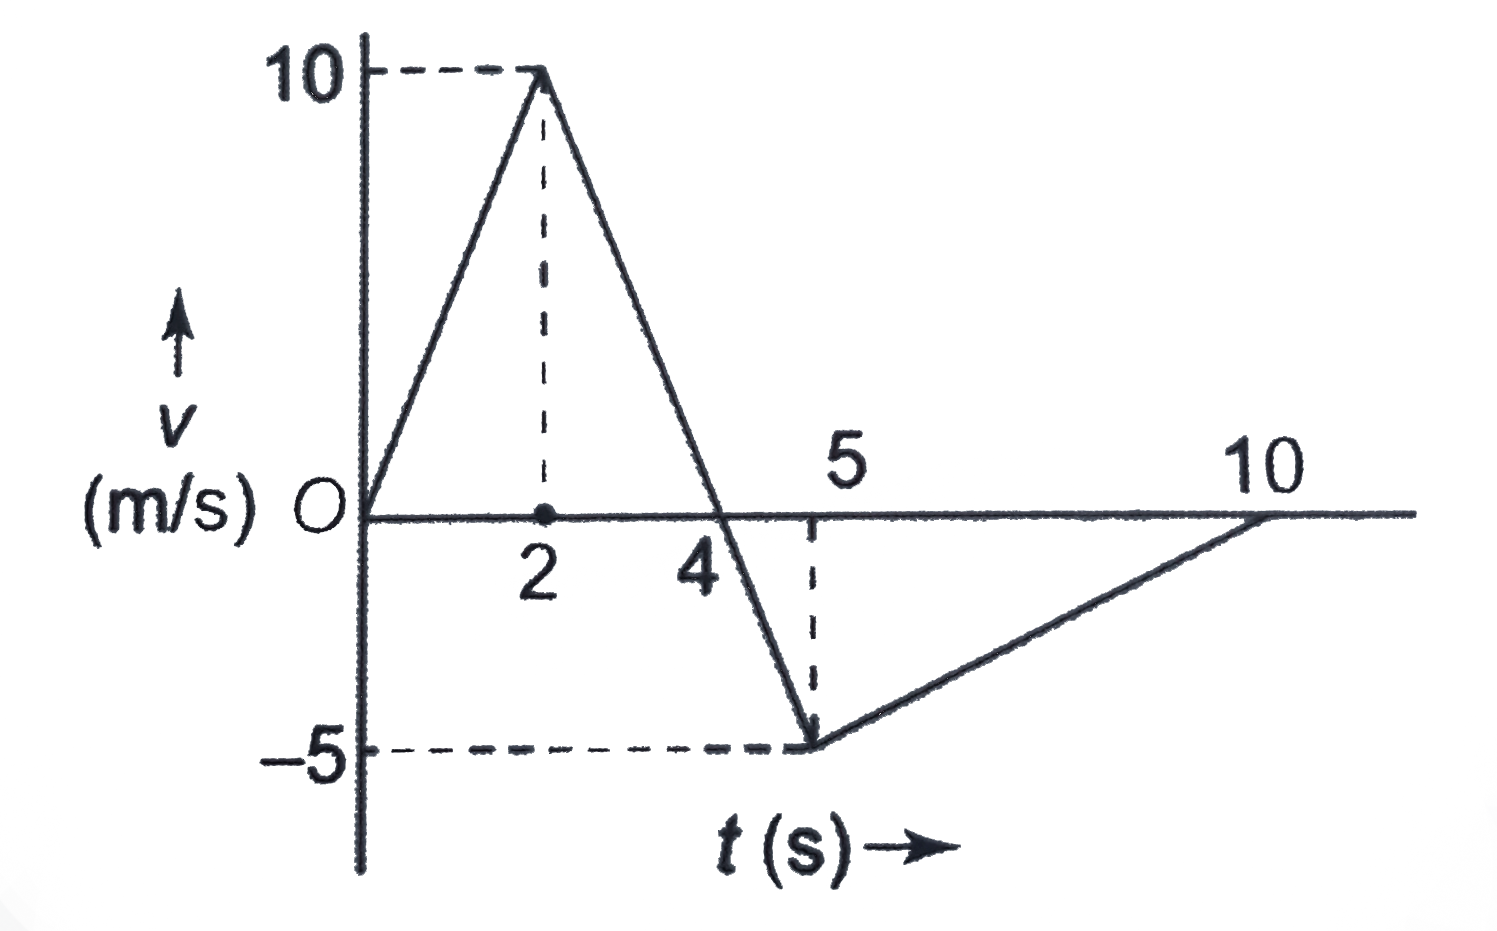
View SolutionIf a particle starts moving along x-axis from origin with initial velocity u=2m/s and acceleration 4m/s2 the relation between displacement and time is given as x=2t+2t2. Draw the displacement time graph for t>––––0.
View SolutionA particle is moving along the x-axis such that s=6t−t2, where s in meters and t is in second. Find the displacement and distance traveled by the particle during time interval t=0 to t=5s.
View SolutionThe position of a particle moving along the x axis is given in centimeters by x=9.75+1.50t3, where t is in seconds. Calculate (a) the average velocity during the time interval t=2.00s to t=3.00s, (b) the instantaneous velocity at t=2.00s , (c) the instantaneous velocity at t=3.00s, (d) the instantaneous velocity at t=2.50s, and (e) the instantaneous velocity when the particle is midway between its positions at t=2.00s and t=3.00s . (f) Graph x versus t and indicate your answers graphically
View SolutionAcceleration vs time graph for a particle moving along a straight line is as shown. If the initial velocity of the particle is u=10m/s, draw a plot of its velocity vs time for 0<t<8.
View Solution

