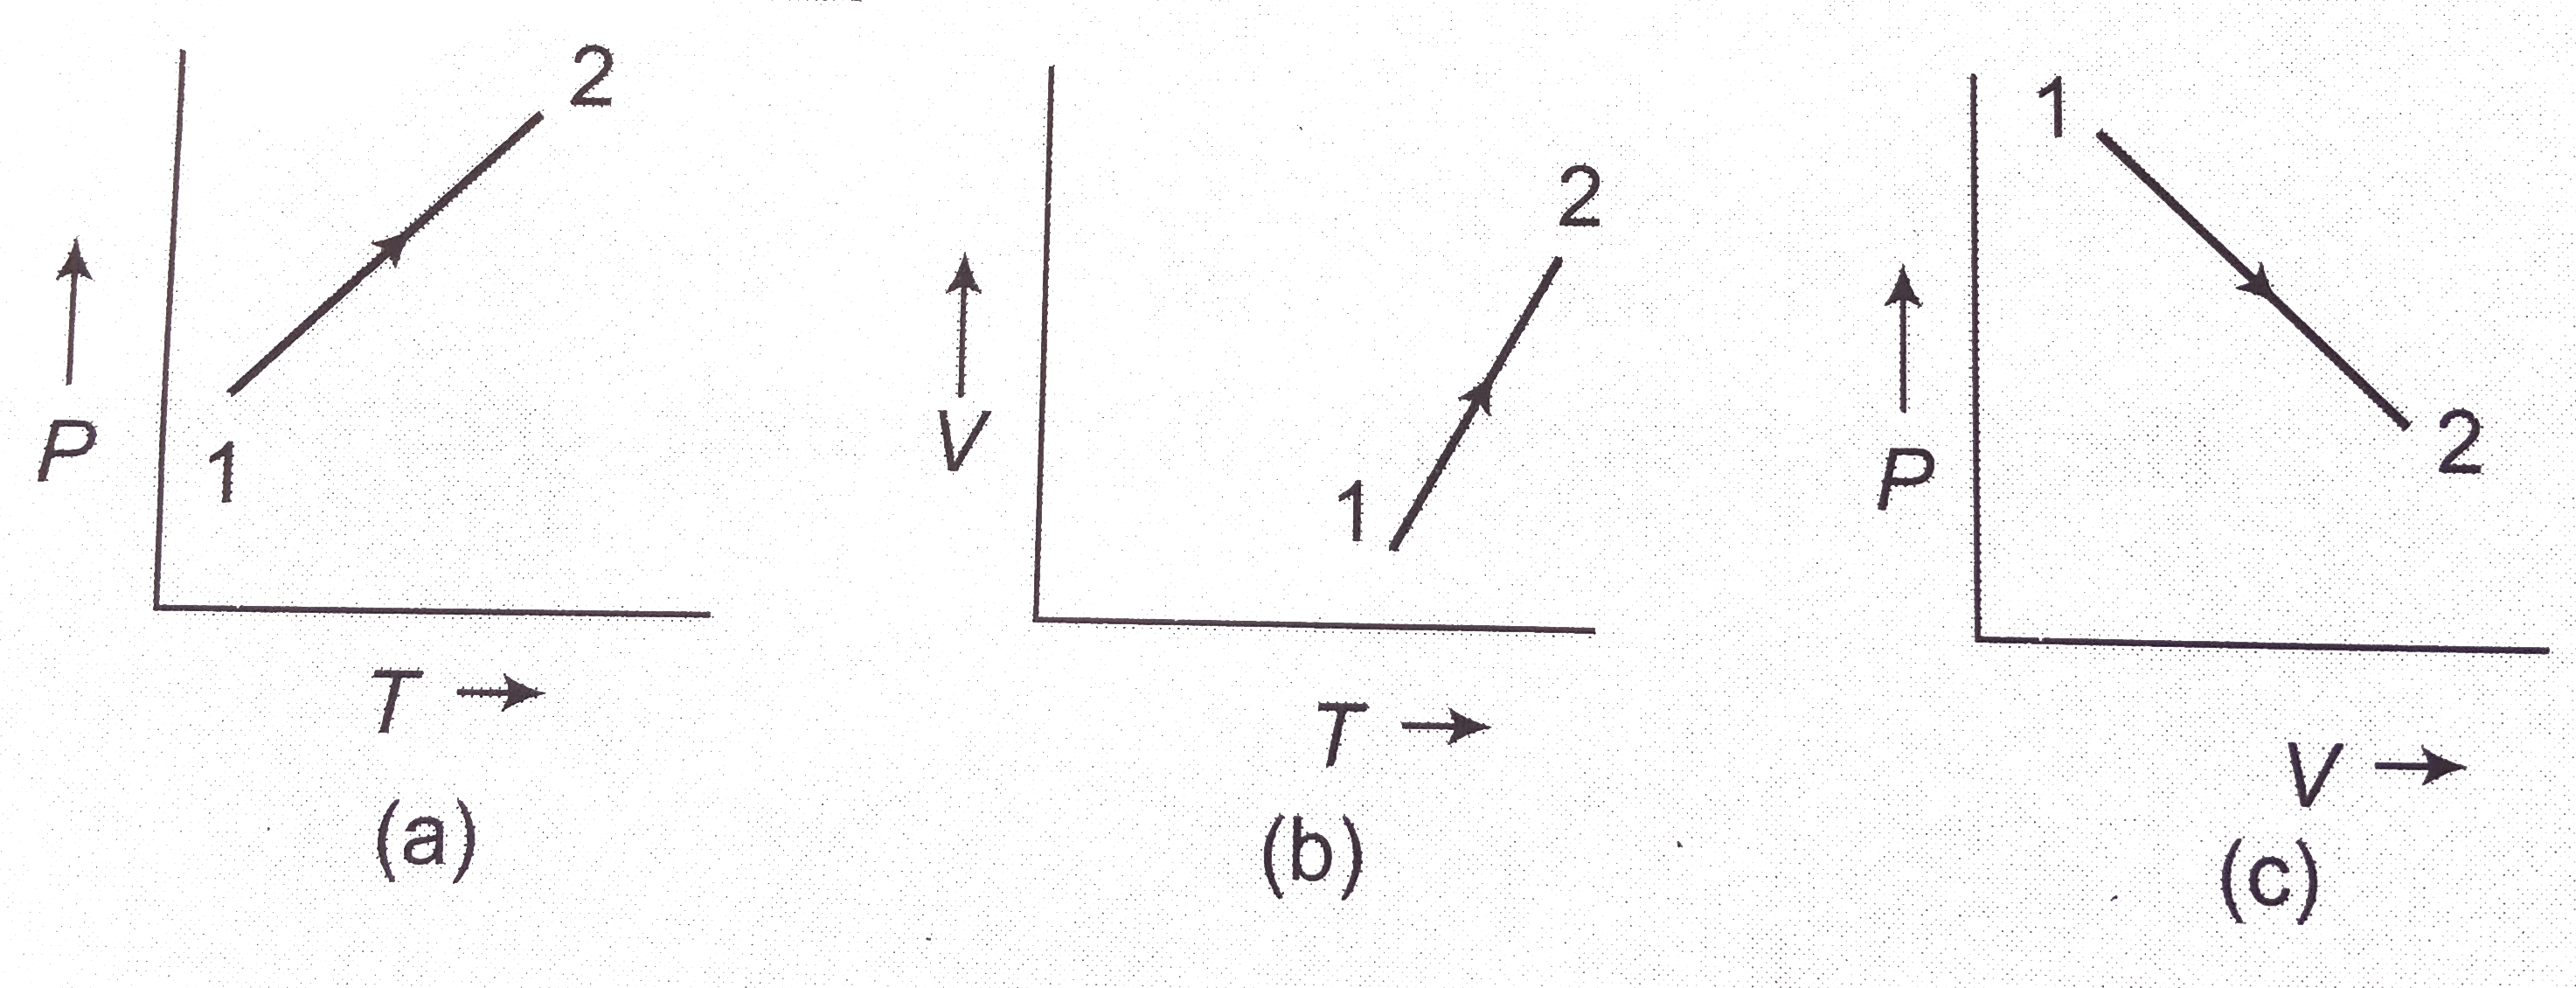
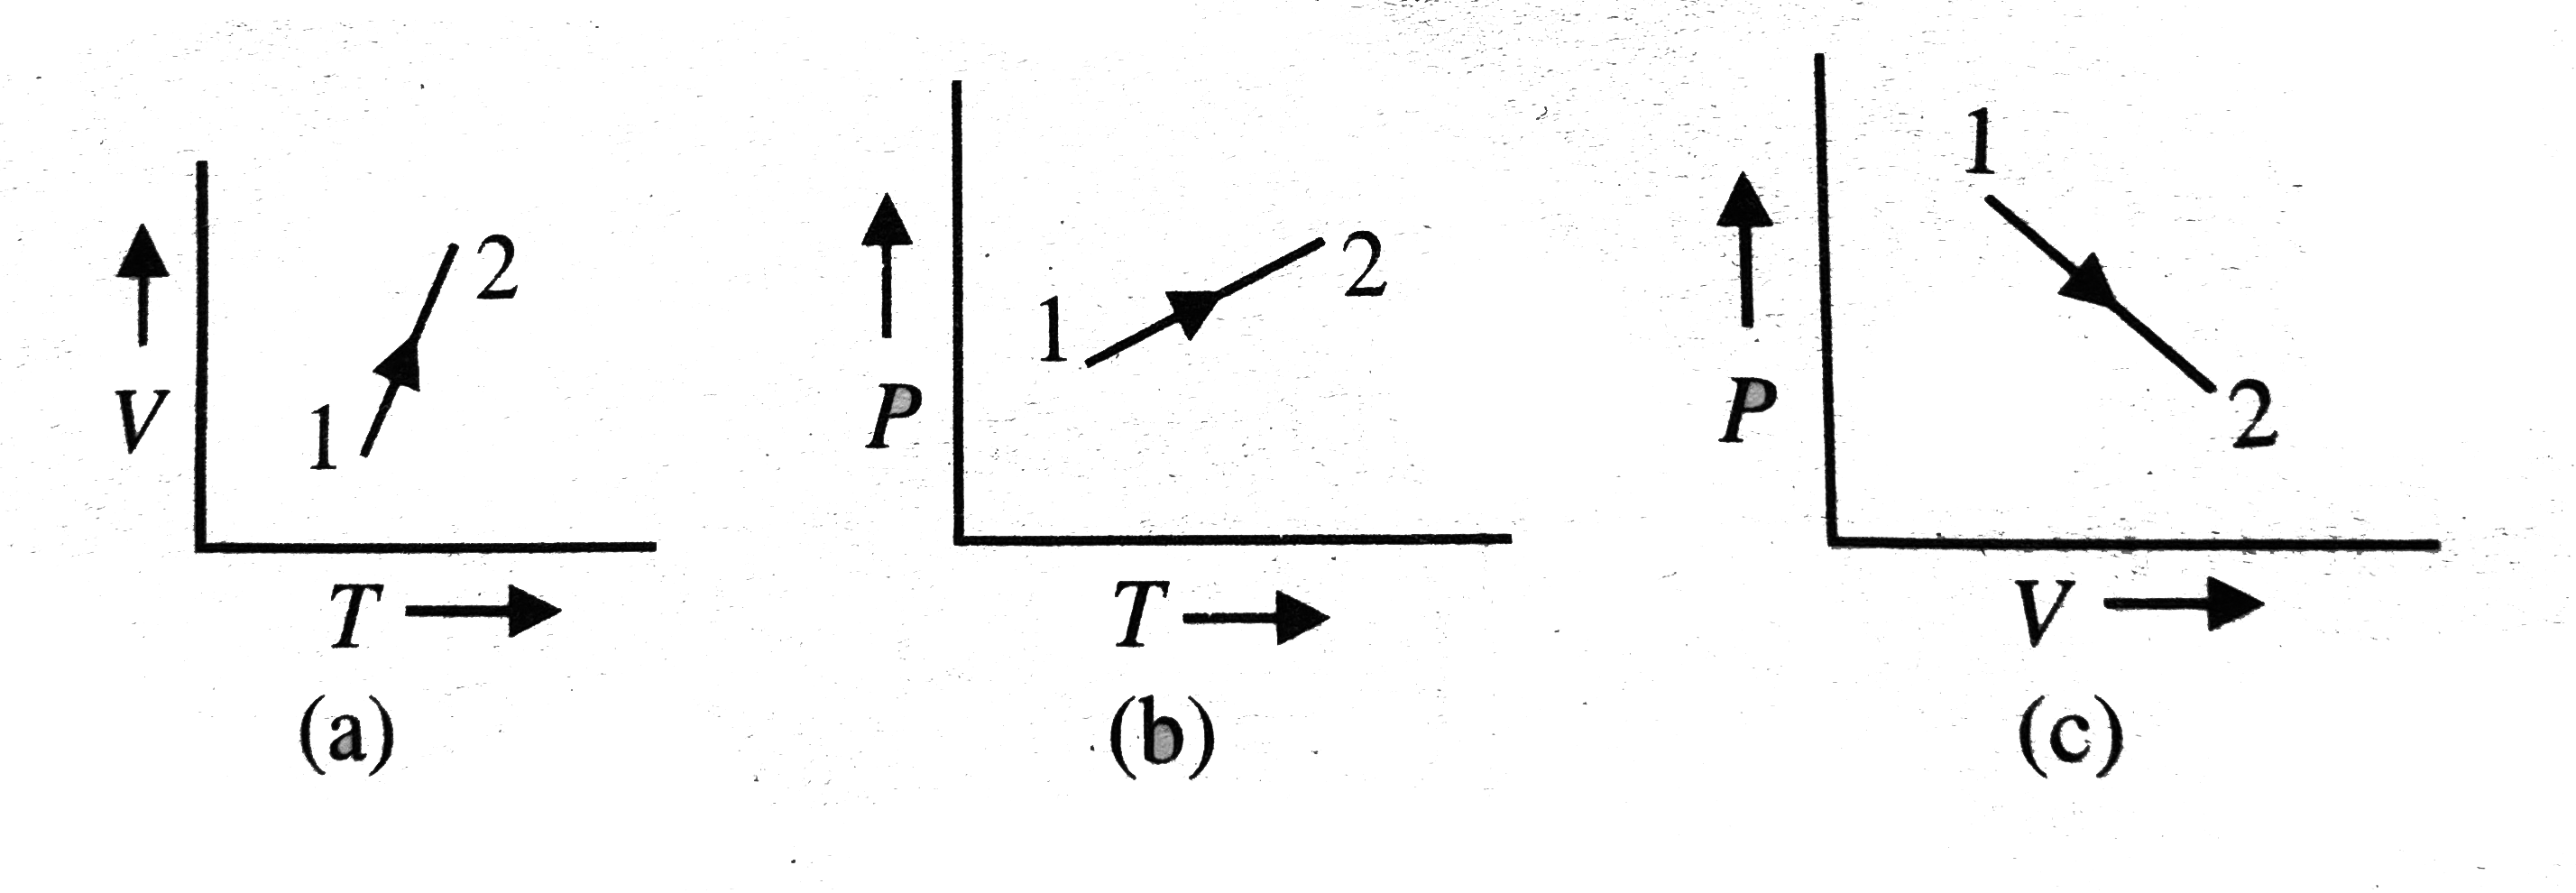
For given mass of an ideal gas, consider the following diagrams
What is variation of volume in (a), pressure in (b) and temperature in (c).
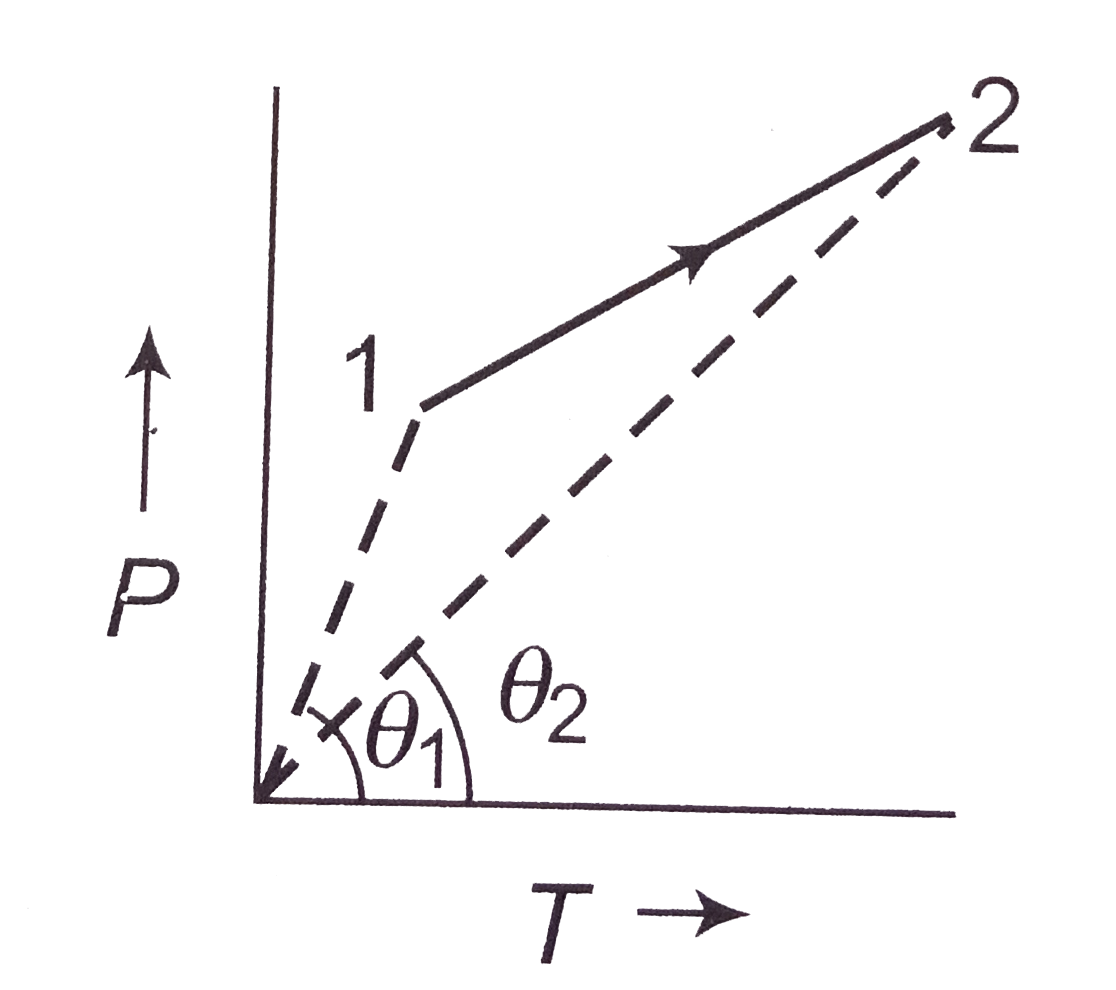
(a) Slope of incline line
tanθ=PT=nRV
In 1→2, θ is decreasing or tanθ is decreasing
PT=nRV is decreasing hence volume is increasing
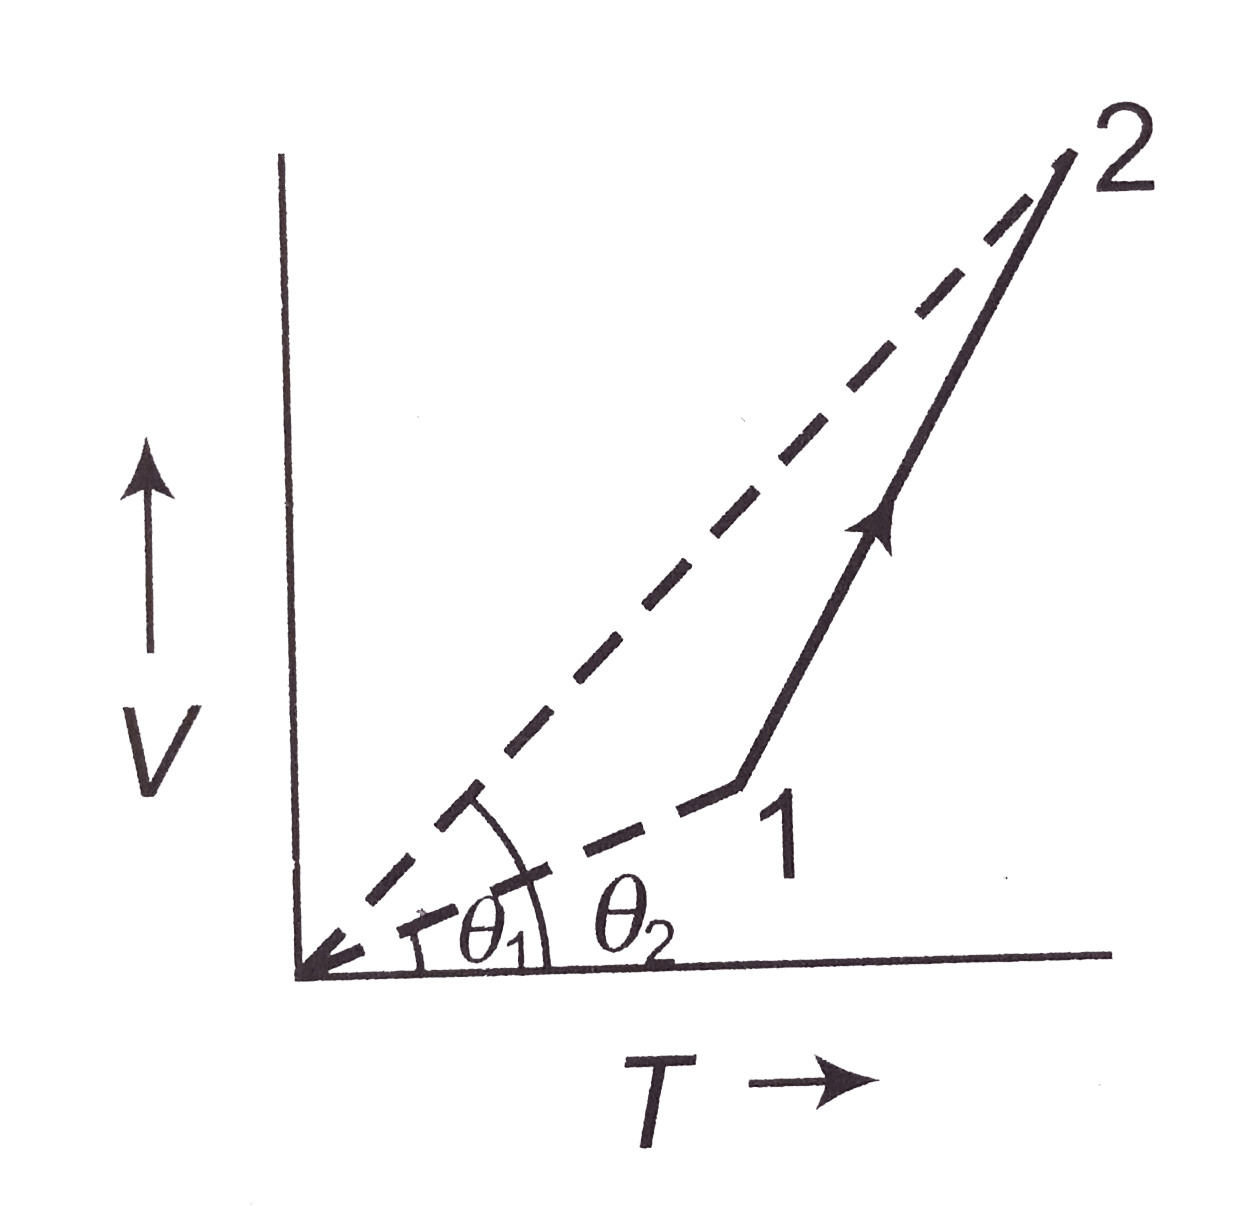
(b) Slope of inclined line
tanθ=VT=nRP
In 1→2, θ is increasing or tanθ is increasing
VT=nRP is increasing hence pressure is decreasing.
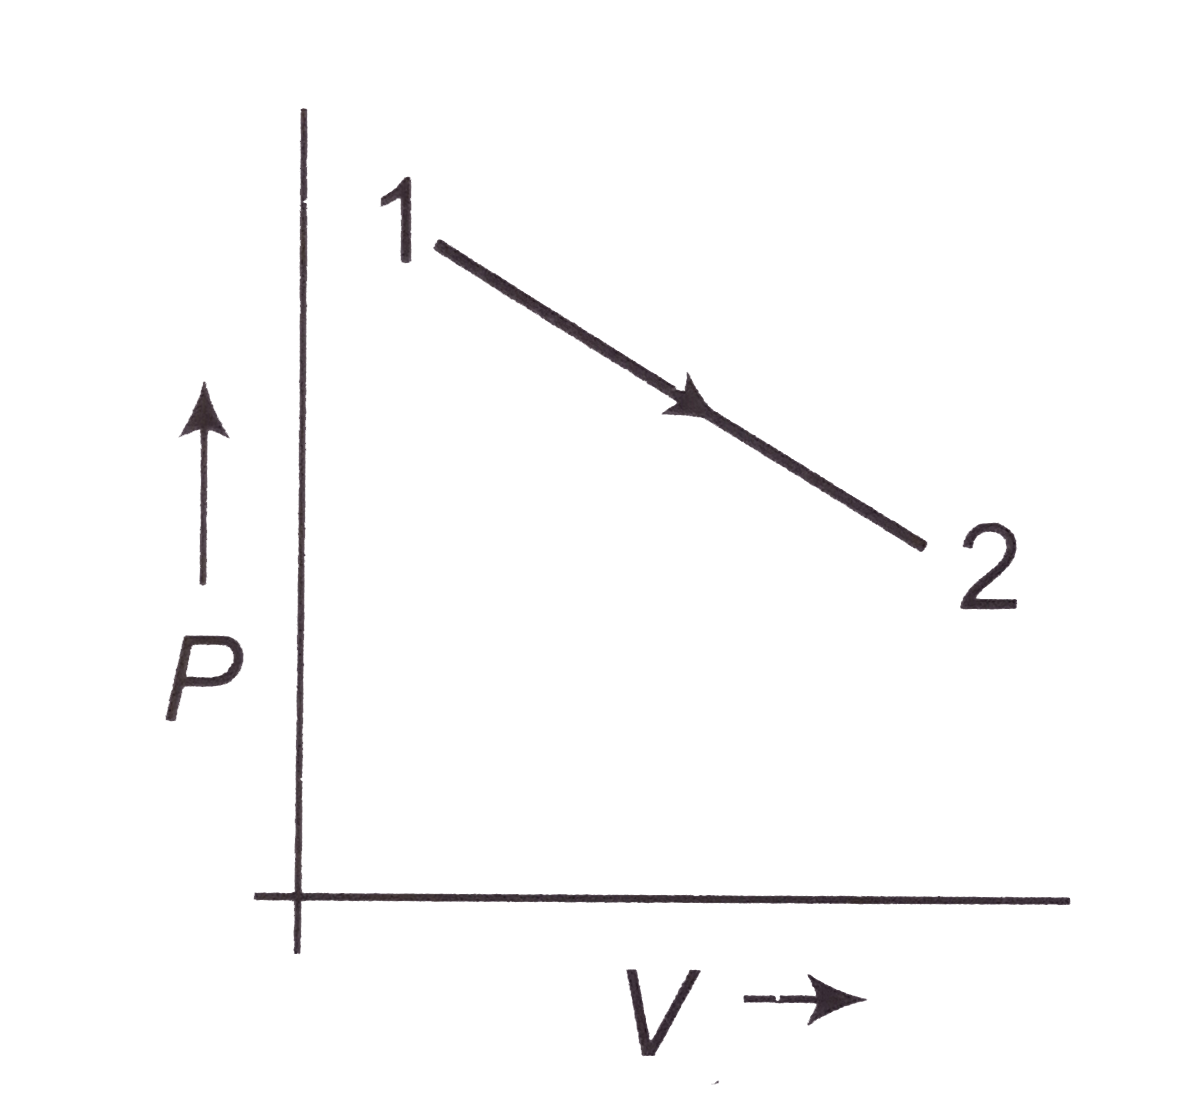
(c) The slope of straight line is negative and intercept is positive.
Positive.
The equation of line 1→2 will be
y=mx+C⇒P=−aV+b .(i)
PV=nRT⇒P=nRTV in (i)
nRTV−aV+b
T=−anRV2+bnRV
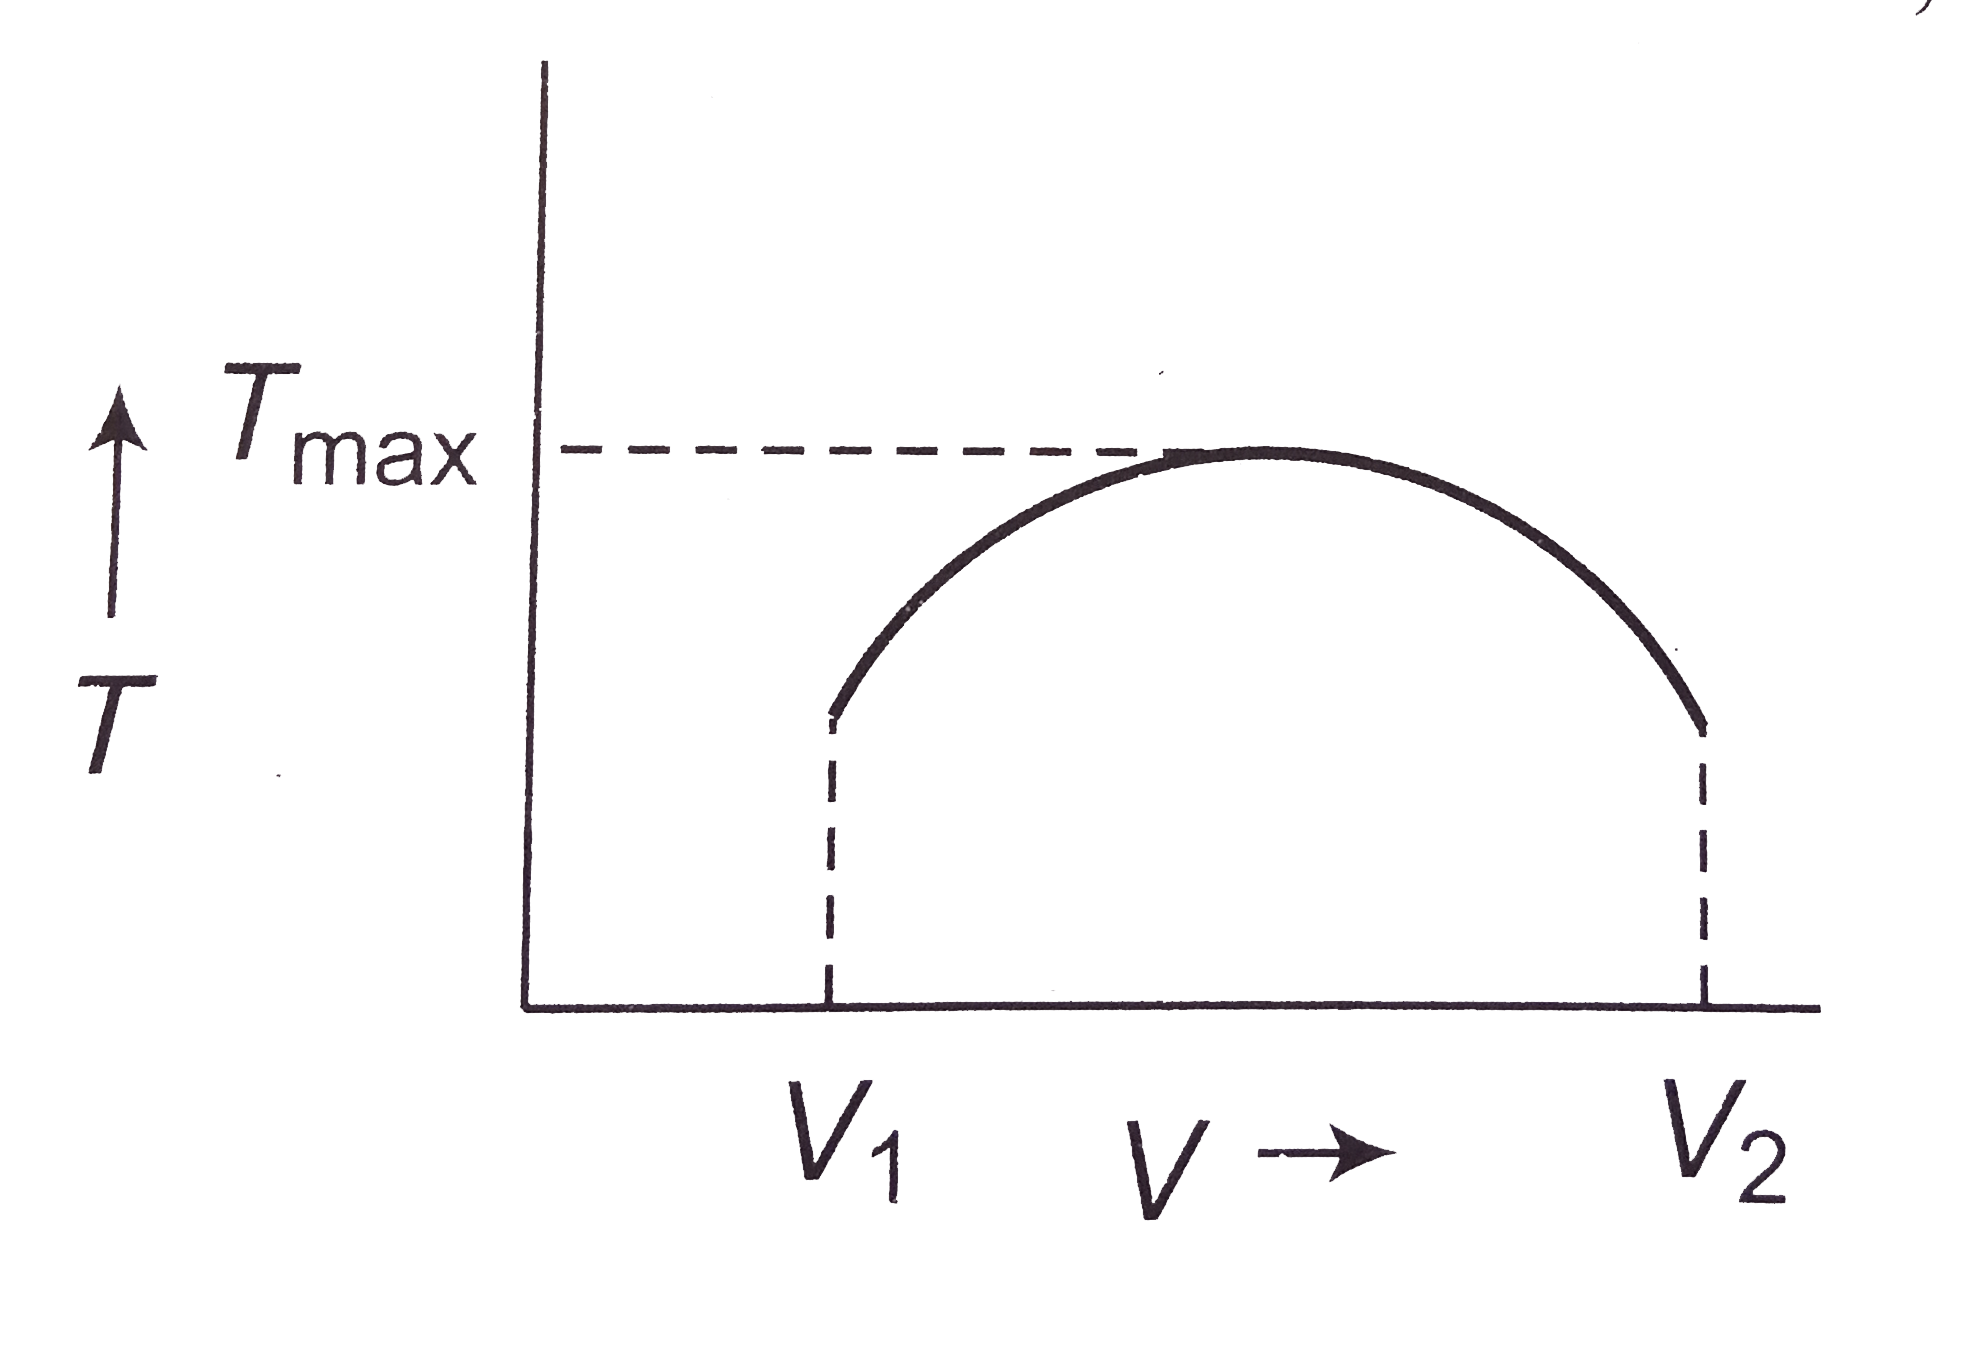
The T v/s V diagram will be parabola, open downward
During expansion, temperature increases, reaching maximum value and then decreases.
T will be maximum.
When dTdV=0⇒−2aVnR+bnR=0⇒V=b2a
Tmax=−anR.b24a2+bnR.b2a=b24nRa
Topper's Solved these Questions
Similar Questions
For given mass of an ideal gas at constant temperature
View SolutionThe three diagrams below depict three different processes for a given mass of an ideal gas. What information can be drawn regarding the change of (a) pressure, (b) volume and (c ) temperature of the gas from the plots as shown in Fig., respectively.
View Solution
Knowledge Check
For given mass of an ideal gas at constant temperature
AP vs V graph is a straight line passing through originBP vs 1V graph is a rectangular hyperbolaCPV vs P graph is a straight line passing through originDPV vs V graph is a straight lineThe given curve represents the variation of temperatue as a function of volume for one mole of an ideal gas. Which of the following curves best represents the variation of pressure as a function of volume ?
(##DCP_V03_C20_E01_099_Q01##).A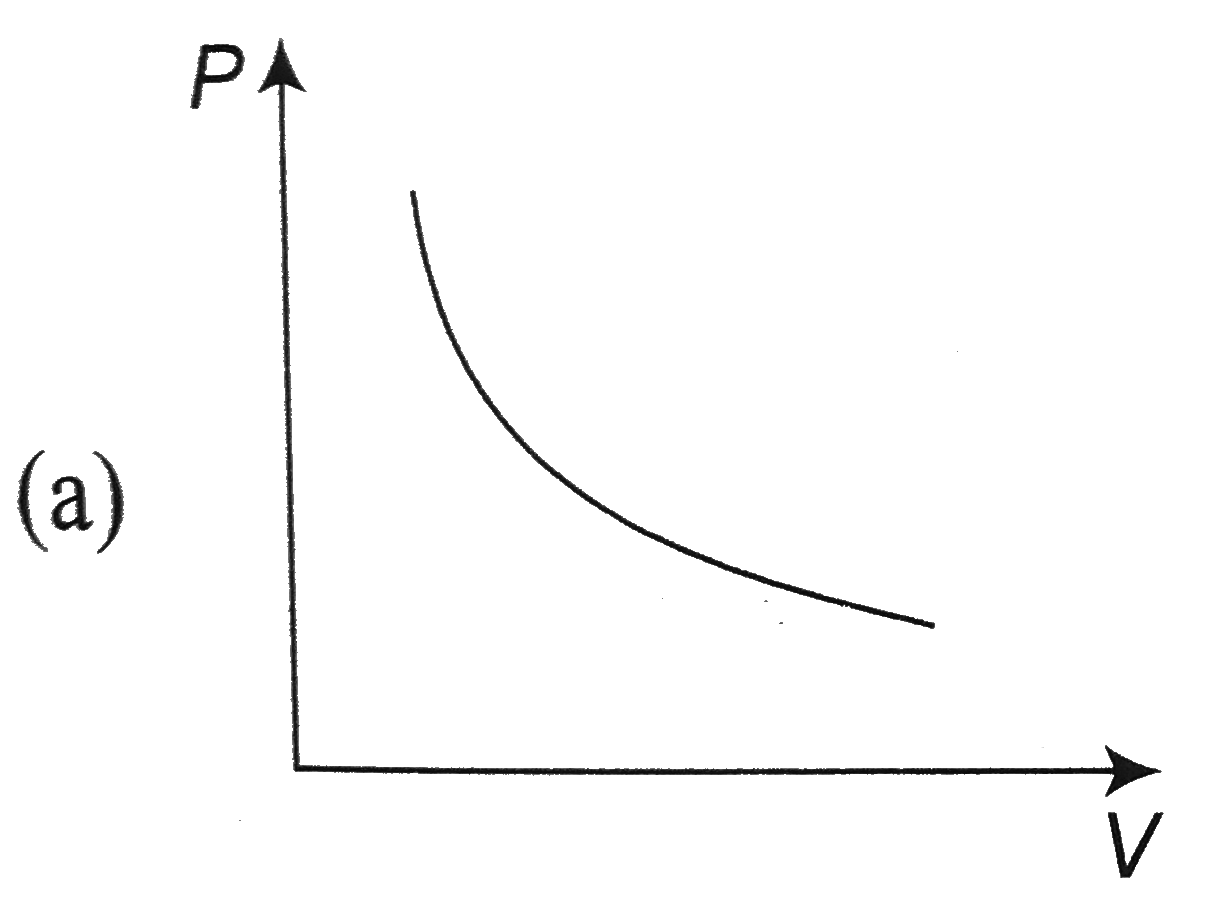 B
B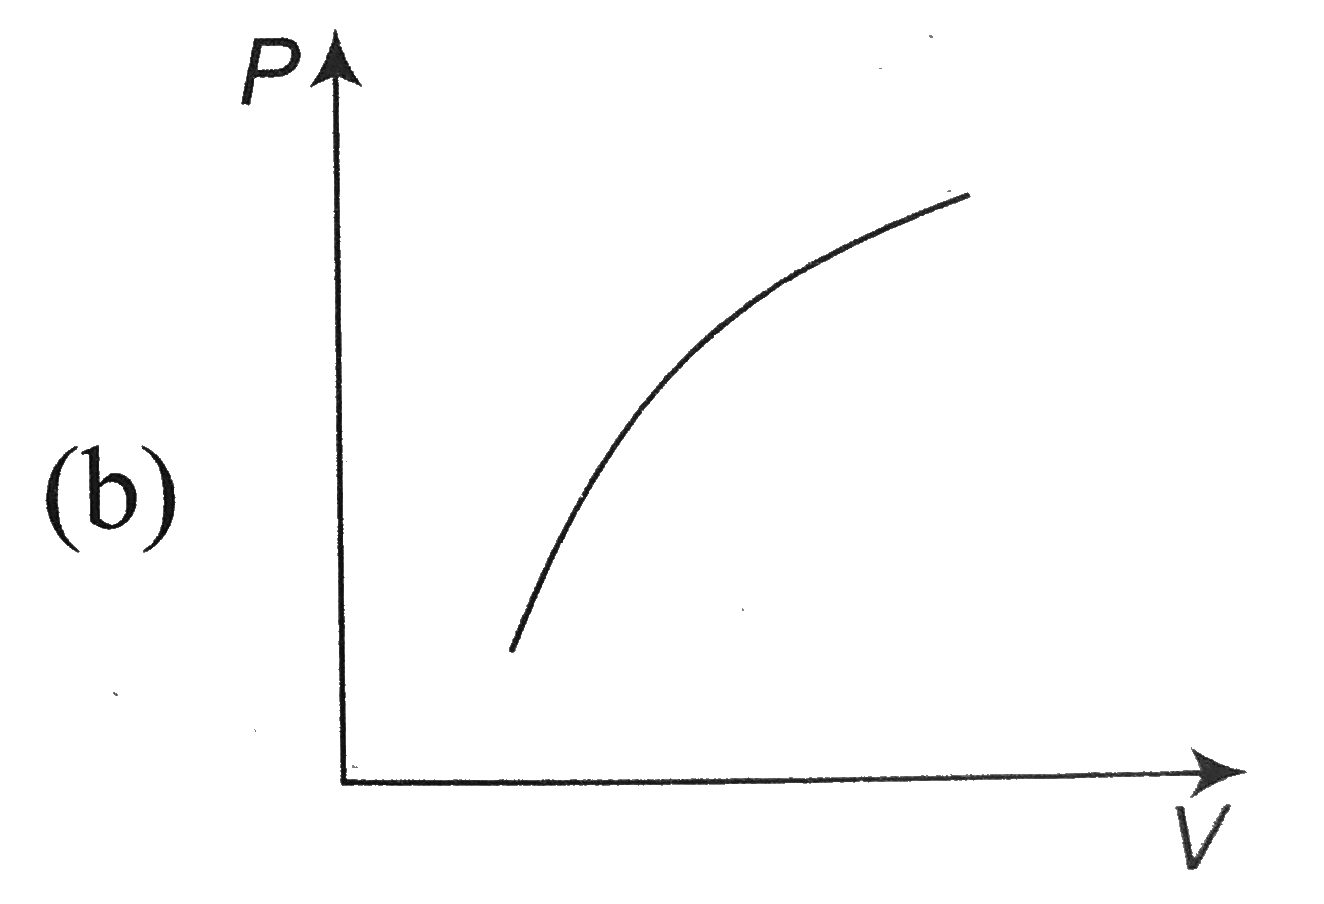 C
C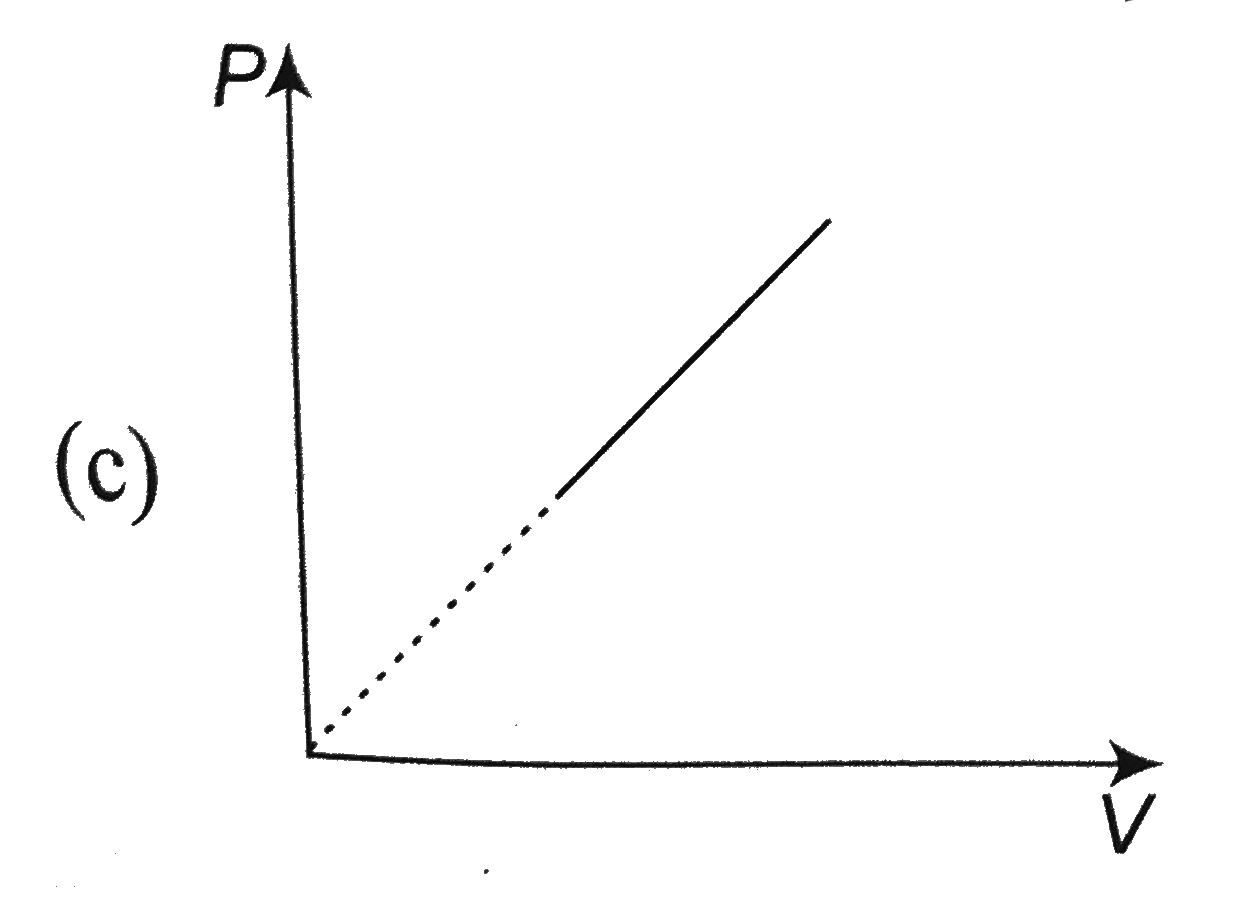 D
D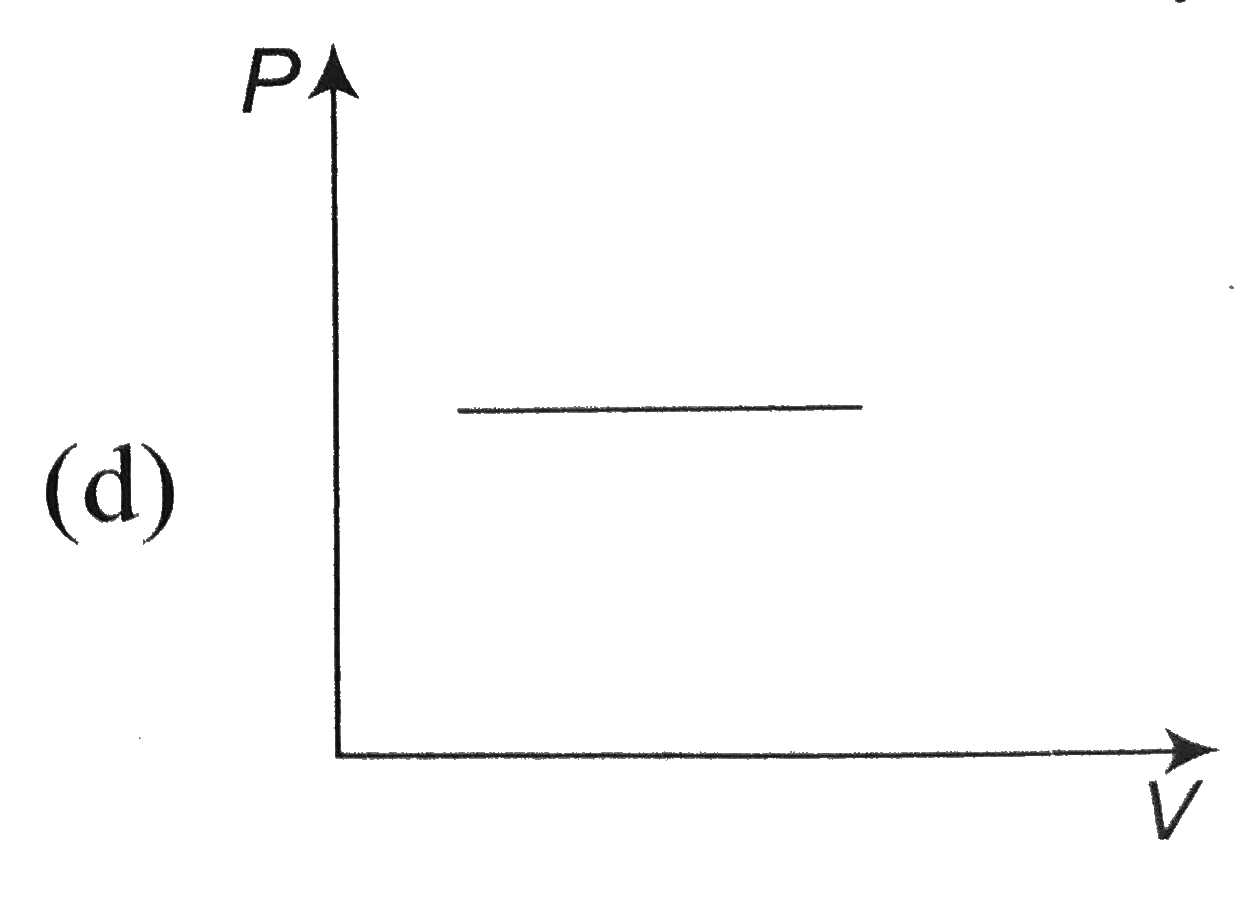
If heat energy is given to an ideal gas at constant pressure, then select the graph which best represents the variation of VT with temperature (T).
A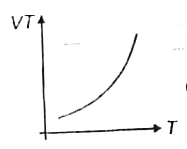 B
B C
C D
D
If ideal gas expand against vaccum, insulated container then what will be final volume, final pressure & final temperature
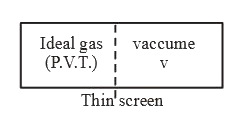
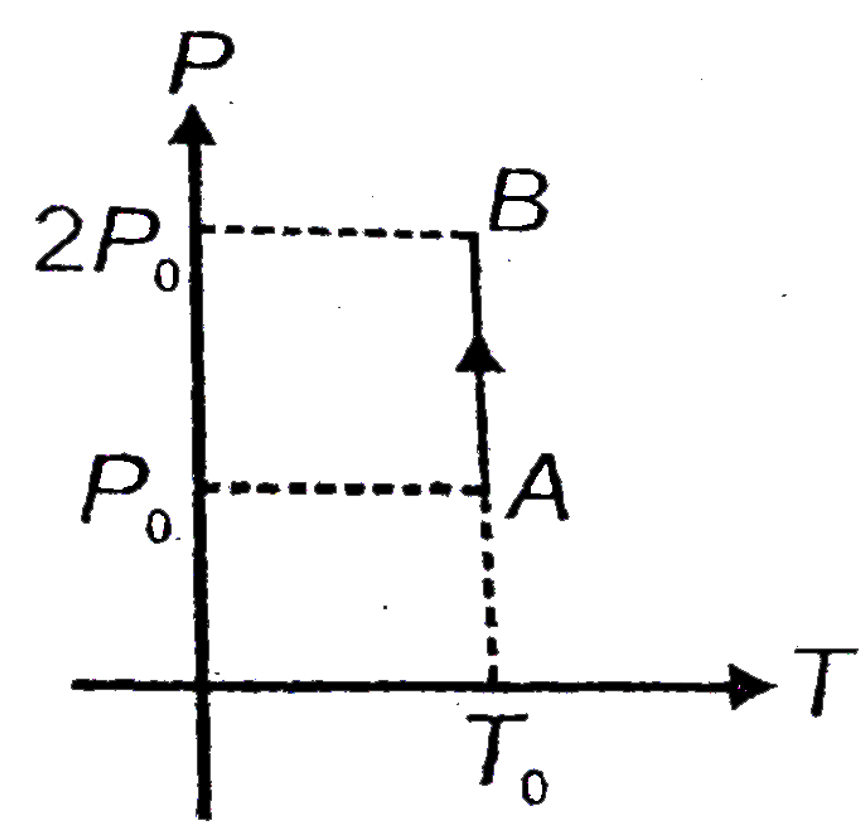
View SolutionFor a given mass of gas the variation of pressure versus temperature is shown in the figure. What is the ratio of volume of the gas at points A and B.
 .
.
View SolutionAt a given volume and temperature ,the pressure of a gas
View SolutionAt a given volume and temperature the pressure of a gas
View Solution4 moles of an ideal gas is at 0∘C . At constant pressure it is heated to double its volume, then its final temperature will be
View Solution
