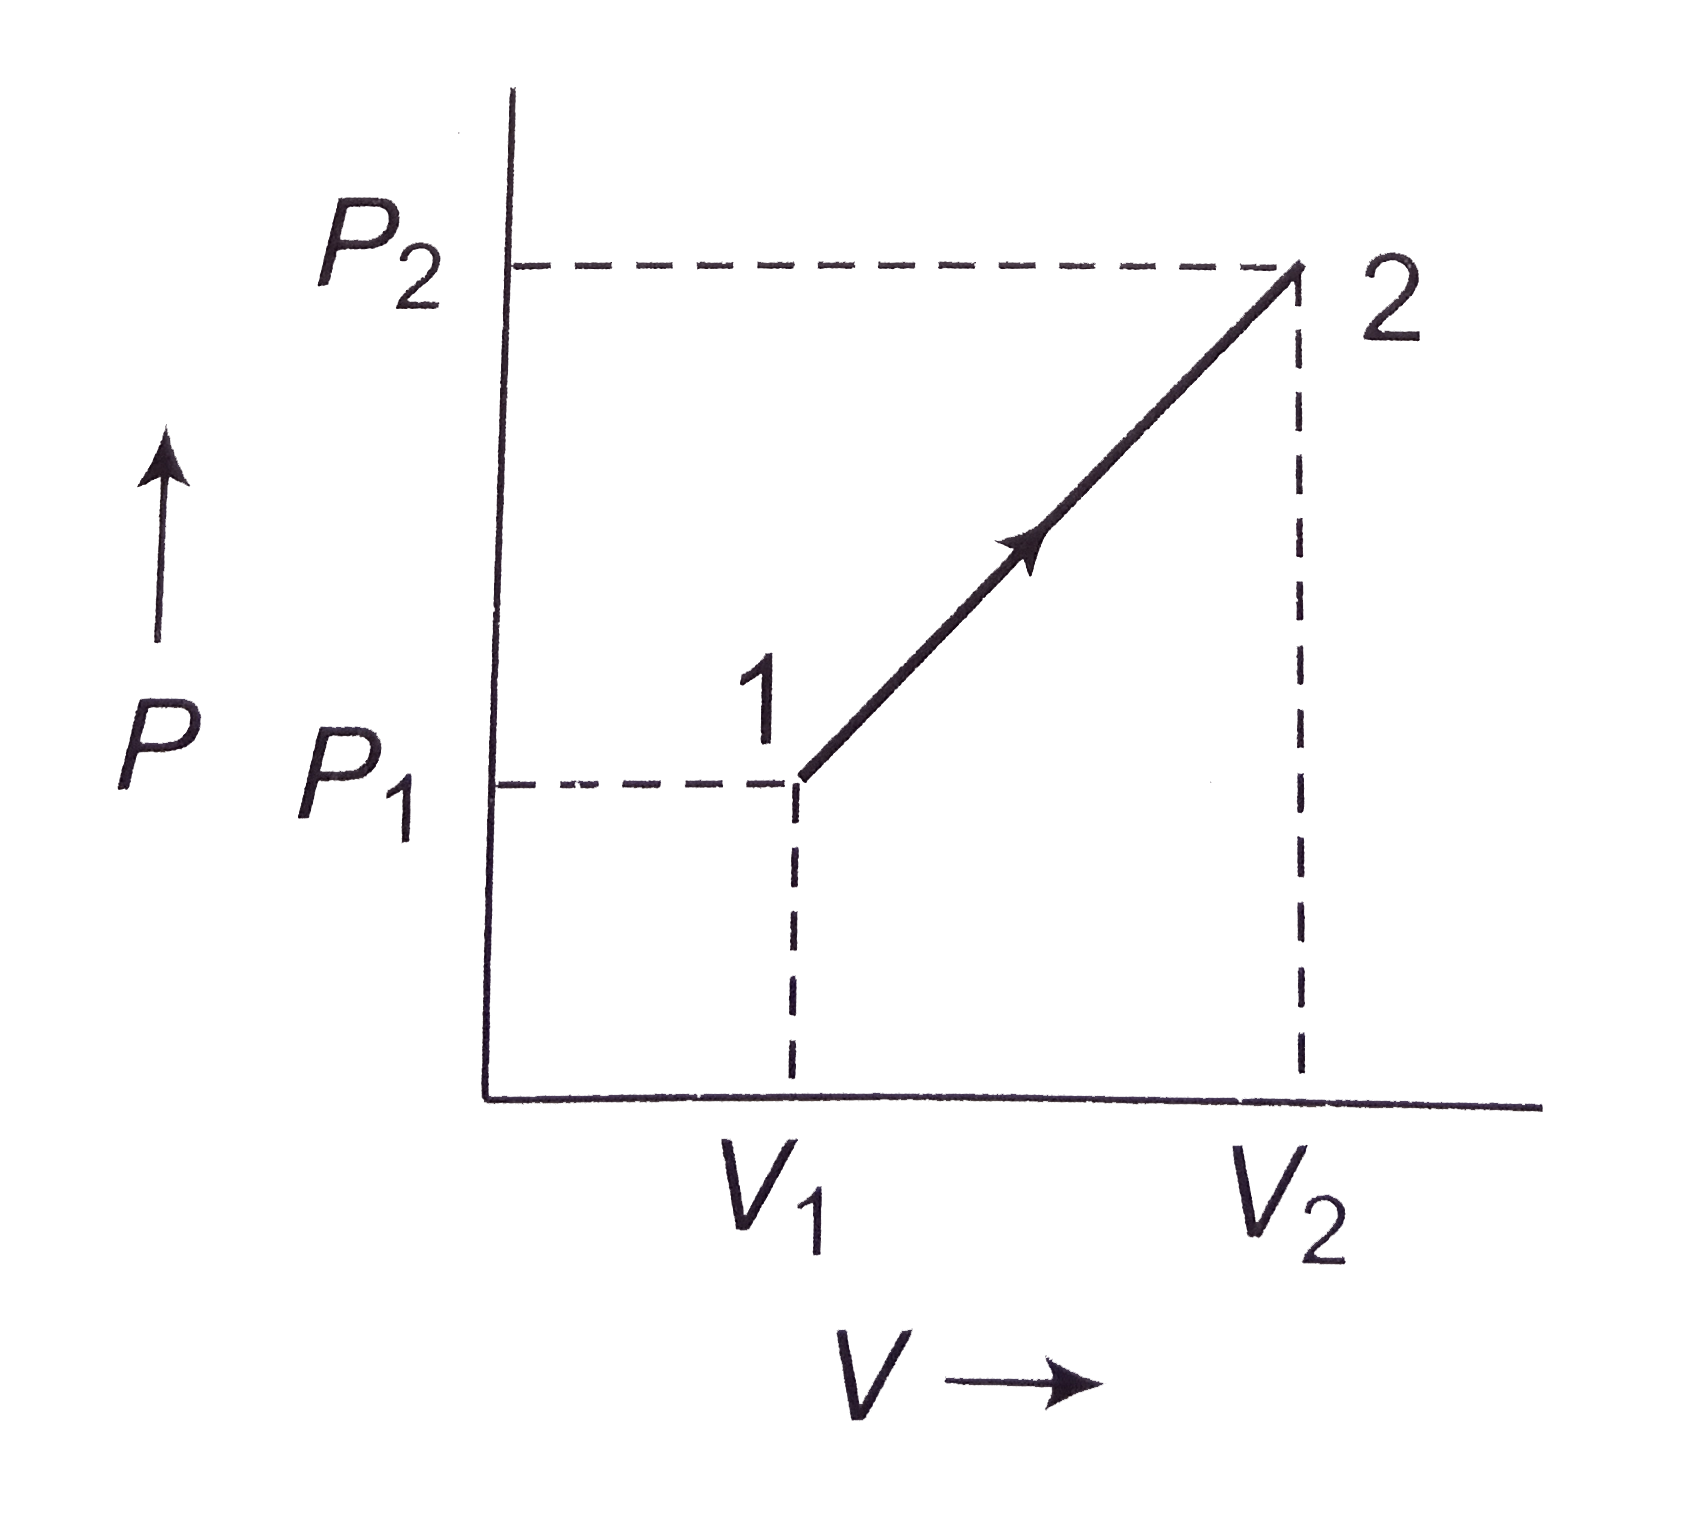
The pressure p and volume V of an ideal gas both increase in a process.
(i),(ii)
(ii),(iii)
(iii),(iv)
(i),(iv)
The correct Answer is:B

n=P1V1RT1=P2V2RT2
P2V2>P1V1
Hence, T2>T1 (ii) is O.K.
ΔW1→2=+ve (volume is increasing)
(iii) is O.K.
ΔQ=ΔU+ΔW,ΔU>0
(iv) is wrong
Topper's Solved these Questions
Similar Questions
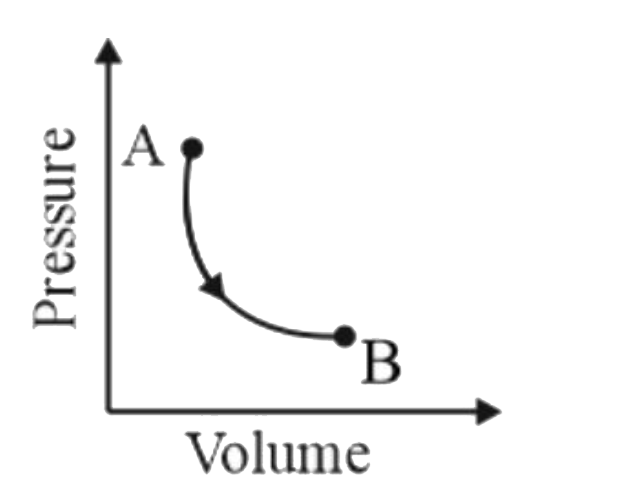
The pressure and volume of an ideal gas are related as pα1v2 for process A→B as shown in figure . The pressure and volume at A are 3p0andv0 respectively and pressure B is p0 the work done in the process A→B is found to be [x−√3]p0v0 find

View SolutionThe internal energy(U) ,pressure (P) and volume (V) of an ideal gas are related as U=3PV+4 .The gas is:
View Solution
Knowledge Check
The pressure P and volume V of an ideal gas both decreases in a process.
Asuch a process is not possible.BThe work done by the system is positive.CThe tempreture of the system must increase.DHeat supplied to the gas is equal to the change in internal energy.The product of pressure and volume of an ideal gas is
Aa constant independent of temperatureBdirectly prouortional to square of its temperatureCdirectly proportional to its temperatureDinversely proportional to its temperatureThe product of the pressure and volume of an ideal gas is
Aa constantBapproximately equal to the universal gas constantCdirectly proportional to its tempDinversely proportional to its temp
The internal energy (U) ,pressure (P) and volume V of an ideal gas are related as U=3PV+4 .The gas is
View SolutionThe product of the pressure and volume of an ideal gas is
View SolutionThe internal energy (U), pressure (P) and volume (V) of an ideal gas are related as U=3PV+4. The gas is :-
View SolutionIf increase in temperature and volume of air ideal gas is two times, then intitial pressure of P changes to:
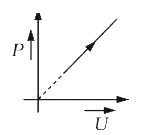
View SolutionThe given P-U graph shows the variation of internal energy of an ideal gas with increase in pressure. Which of the following pressure-volume graph is equivalent to this graph?

View Solution

