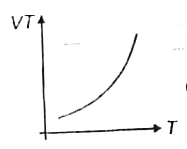
If heat energy is given to an ideal gas at constant pressure, then select the graph which best represents the variation of VT with temperature (T).


The correct Answer is:A
To solve the problem of how the volume (V) of an ideal gas varies with temperature (T) when heat energy is added at constant pressure, we can follow these steps:
1. Understand the Ideal Gas Law:
The ideal gas law is given by the equation:
PV=nRT
where P is pressure, V is volume, n is the number of moles, R is the universal gas constant, and T is the temperature.
2. Constant Pressure Condition:
Since heat is added at constant pressure, we can denote this constant pressure as P. Thus, we can rewrite the ideal gas law as:
V=nRTP
Here, n and R are constants, and P is also constant.
3. Direct Proportionality:
From the equation above, we can see that volume V is directly proportional to temperature T:
V∝T
This means that as temperature increases, volume also increases.
4. Expressing Volume in Terms of Temperature:
We can express this relationship mathematically as:
V=kT
where k=nRP is a constant.
5. Finding the Relationship Between VT and T:
To find the relationship between VT and T, we multiply both sides of the equation V=kT by T:
VT=kT2
This indicates that VT is proportional to T2.
6. Identifying the Graph:
The equation VT=kT2 represents a quadratic relationship, which is a parabola opening upwards. Therefore, the graph of VT versus T will be a curve that starts from the origin and increases as T increases.
Conclusion:
The graph that best represents the variation of VT with temperature T is a parabola opening upwards.
---
The ideal gas law is given by the equation:
PV=nRT
where P is pressure, V is volume, n is the number of moles, R is the universal gas constant, and T is the temperature.
Since heat is added at constant pressure, we can denote this constant pressure as P. Thus, we can rewrite the ideal gas law as:
V=nRTP
Here, n and R are constants, and P is also constant.
From the equation above, we can see that volume V is directly proportional to temperature T:
V∝T
This means that as temperature increases, volume also increases.
We can express this relationship mathematically as:
V=kT
where k=nRP is a constant.
To find the relationship between VT and T, we multiply both sides of the equation V=kT by T:
VT=kT2
This indicates that VT is proportional to T2.
The equation VT=kT2 represents a quadratic relationship, which is a parabola opening upwards. Therefore, the graph of VT versus T will be a curve that starts from the origin and increases as T increases.
The graph that best represents the variation of VT with temperature T is a parabola opening upwards.
Topper's Solved these Questions
- KINETIC THEORYBook:AAKASH INSTITUTEChapter:KINETIC THEORYExercise:EXERCISE (ASSIGNMENT) SECTION - C Previous Years Questions
Explore 21 Videos
- KINETIC THEORYBook:AAKASH INSTITUTEChapter:KINETIC THEORYExercise:EXERCISE (ASSIGNMENT) SECTION - D Assertion - Reason Type Questions
Explore 10 Videos
- KINETIC THEORYBook:AAKASH INSTITUTEChapter:KINETIC THEORYExercise:EXERCISE (ASSIGNMENT) SECTION - A Objective Type Questions
Explore 30 Videos
- GRAVITATION Book:AAKASH INSTITUTEChapter:GRAVITATION Exercise:ASSIGNMENT SECTION - D (ASSERTION-REASON TYPE QUESTIONS)
Explore 16 Videos
- LAWS OF MOTIONBook:AAKASH INSTITUTEChapter:LAWS OF MOTIONExercise:Assignment (SECTION-D) (Assertion-Reason Type Questions)
Explore 15 Videos
Similar Questions
Knowledge Check
If an ideal gas is heated at constant pressure :
Athe volume increasesBthe mass of gas remains sameCthe kinetic energy of the molecules increasesDattraction forces between gas particles increasesHeat supplied to an ideal gas sample at constant Pressure :
Aif gas is diatomic then Q:ΔU=7:5Bif gas is diatomic then Q:W=7:2Cif gas is monoatomic then Q:ΔU=5:3Dif gas is monoatomic then ΔU:W=3:2If 21 J of heat energy is supplied to an ideal diatomic gas at constant pressure, then the change in its energy is
A10 JB12 JC15 JD18 J
For fixed mass of an ideal gas a constant temperature. Which is correct graph ?
View SolutionIf a gas, at constant temperature and pressure expands, then its
View SolutionFor a closed container containing 10 moles of an ideal gas, at constant pressure of 0.82 atm, which graph correctly represent, variation of log V us log T where volume is in litre and temp. in kelvin :
View SolutionThe graph which represents the variation of mean kinetic energy of moleules with temperature ∘C is ?
View Solutionwhich of the following graph represents the variation of resistivity (ρ) with temperature (T) for copper?
View Solution

