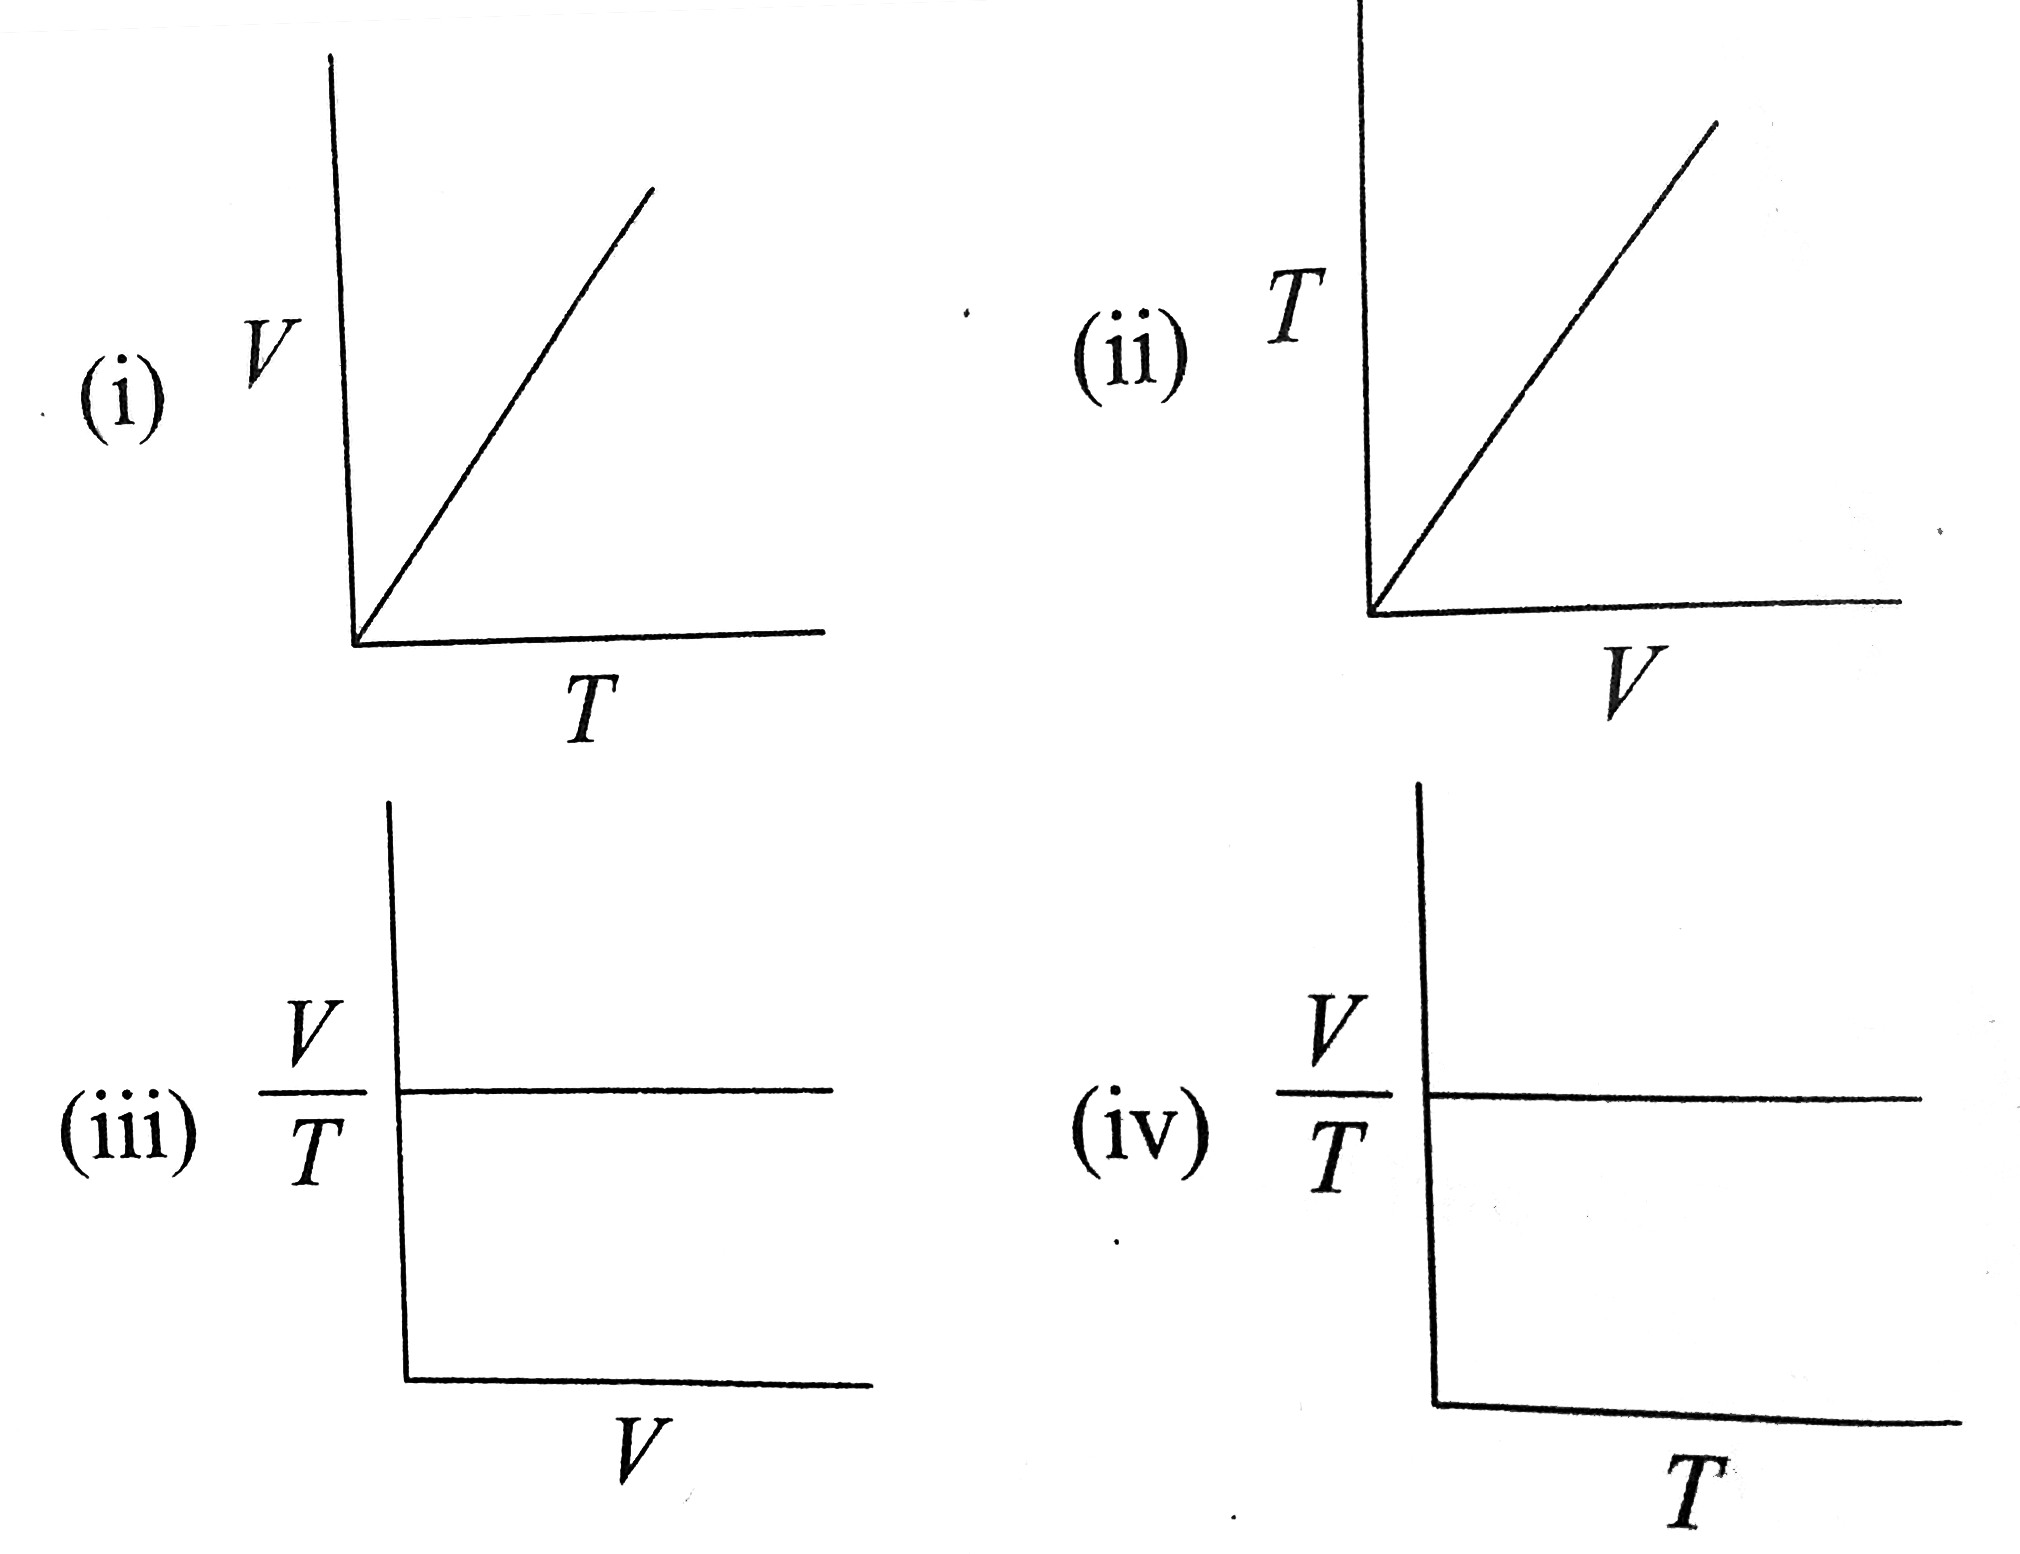
Within elastic limit, which of the following graphs correctly represents the variation of extension in the length of wire with the external load?
straight line with negative slope
straight line with zero slope
Straight line with positive slope
None of the above
The correct Answer is:C
Step by step video, text & image solution for Within elastic limit, which of the following graphs correctly represents the variation of extension in the length of wire with the external load? by Physics experts to help you in doubts & scoring excellent marks in Class 11 exams.
Updated on:21/07/2023Topper's Solved these Questions
- MECHANICAL PROPERTIES OF SOLIDSBook:NARAYNAChapter:MECHANICAL PROPERTIES OF SOLIDSExercise:LEVEL-I (C.W)
Explore 37 Videos
- MECHANICAL PROPERTIES OF SOLIDSBook:NARAYNAChapter:MECHANICAL PROPERTIES OF SOLIDSExercise:LEVEL-II (C.W)
Explore 32 Videos
- MECHANICAL PROPERTIES OF SOLIDSBook:NARAYNAChapter:MECHANICAL PROPERTIES OF SOLIDSExercise:LEVEL-II (H.W)
Explore 24 Videos
- MECHANICAL PROPERTIES OF FLUIDSBook:NARAYNAChapter:MECHANICAL PROPERTIES OF FLUIDSExercise:EXERCISE - III
Explore 30 Videos
- MOTION IN A PLANEBook:NARAYNAChapter:MOTION IN A PLANEExercise:Level-II(H.W)
Explore 31 Videos
Similar Questions
Knowledge Check
Which of the following graph is correctly represented?
A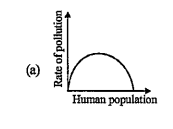 B
B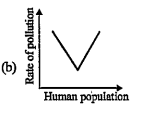 C
C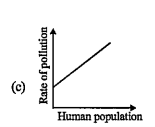 D
D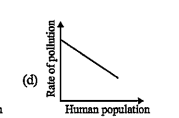
Which of the following graphs best represents the variation of acceleration 'a' with displacement x?
A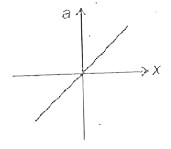 B
B C
C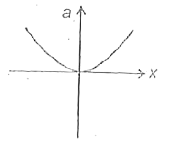 D
D
Which of the following graphs represents freundlich adsorption isotherm?
A B
B C
C D
D
Which of the following graphs correctly represents the variation of particle momentum with associated de Broglie wavelength?
View SolutionWhich of the following graphs correctly represents the variation of β=−(dV/dP)/V with P for an ideal gas at constant temperature?
View SolutionWhich of the following graphs correctly represents the variation of β=−dV/dPV
with P for an ideal gas at constant temperature?
View SolutionWhich of the following graphs represents the variation of activity (A) of a radioactive substance with time (t).
View SolutionWhich of the following graph correctly represents the variation of molar conductance (Δm) with dilution for a strong electrolyte ?
View Solution


