Which of the following graphs correctly represents the variation of particle momentum with associated de Broglie wavelength?
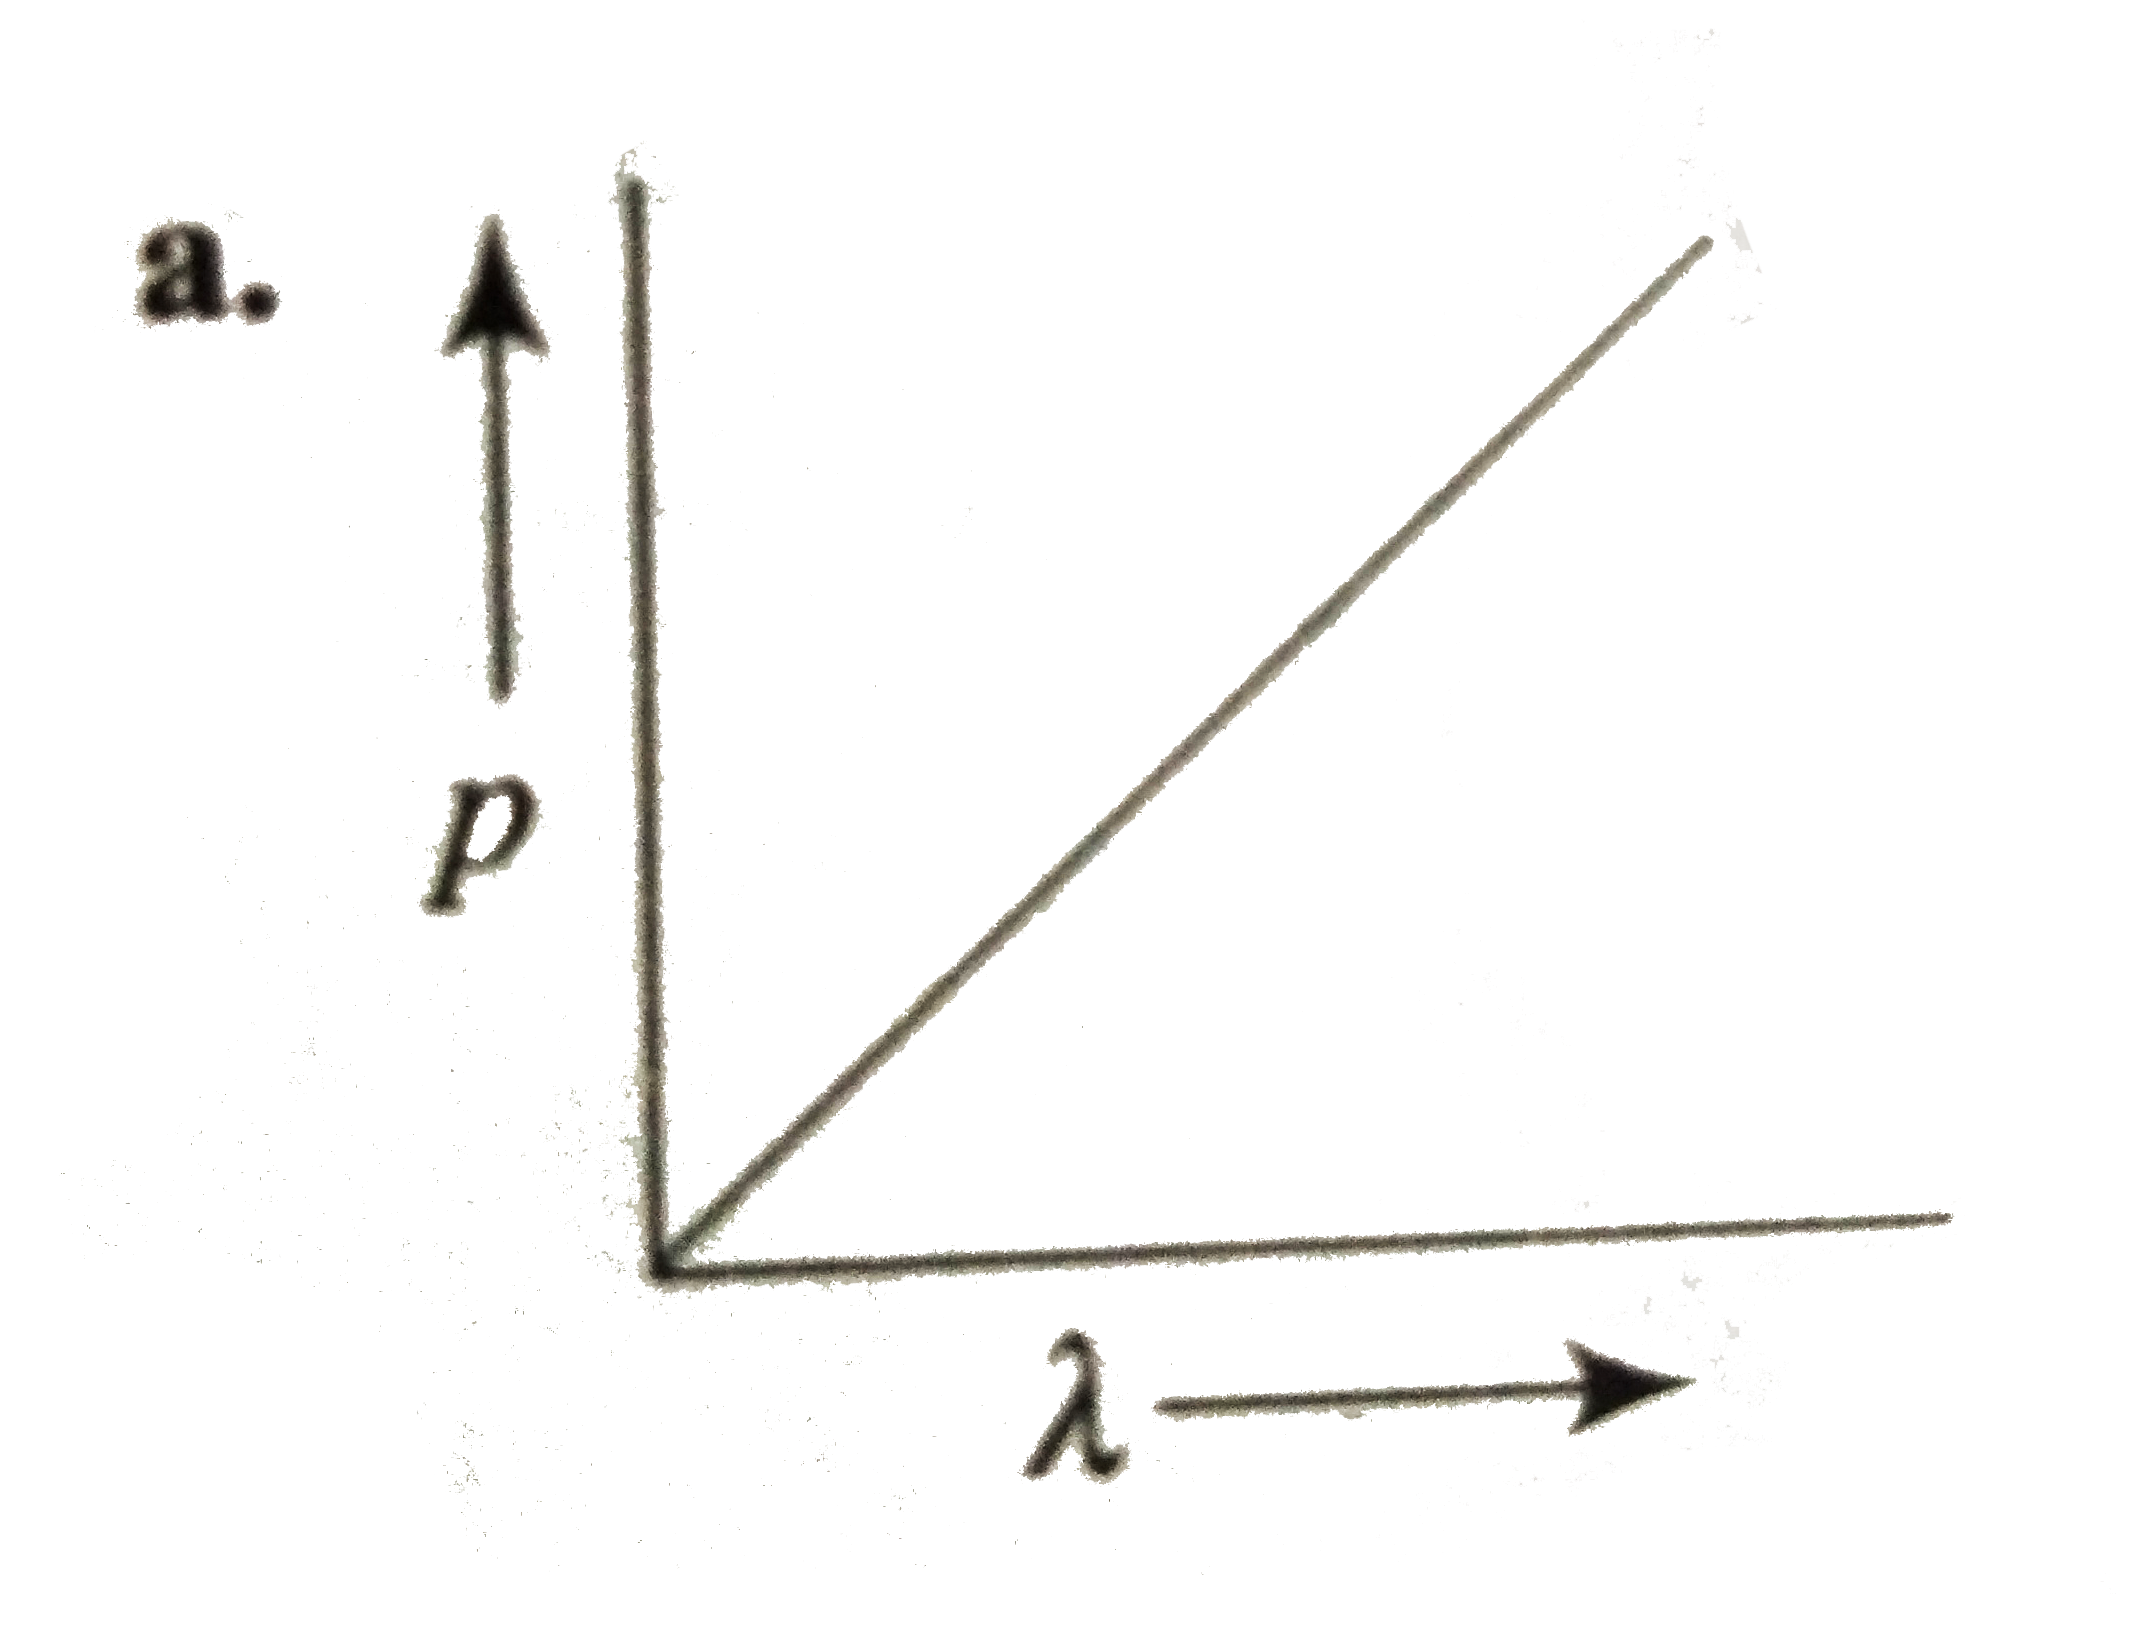
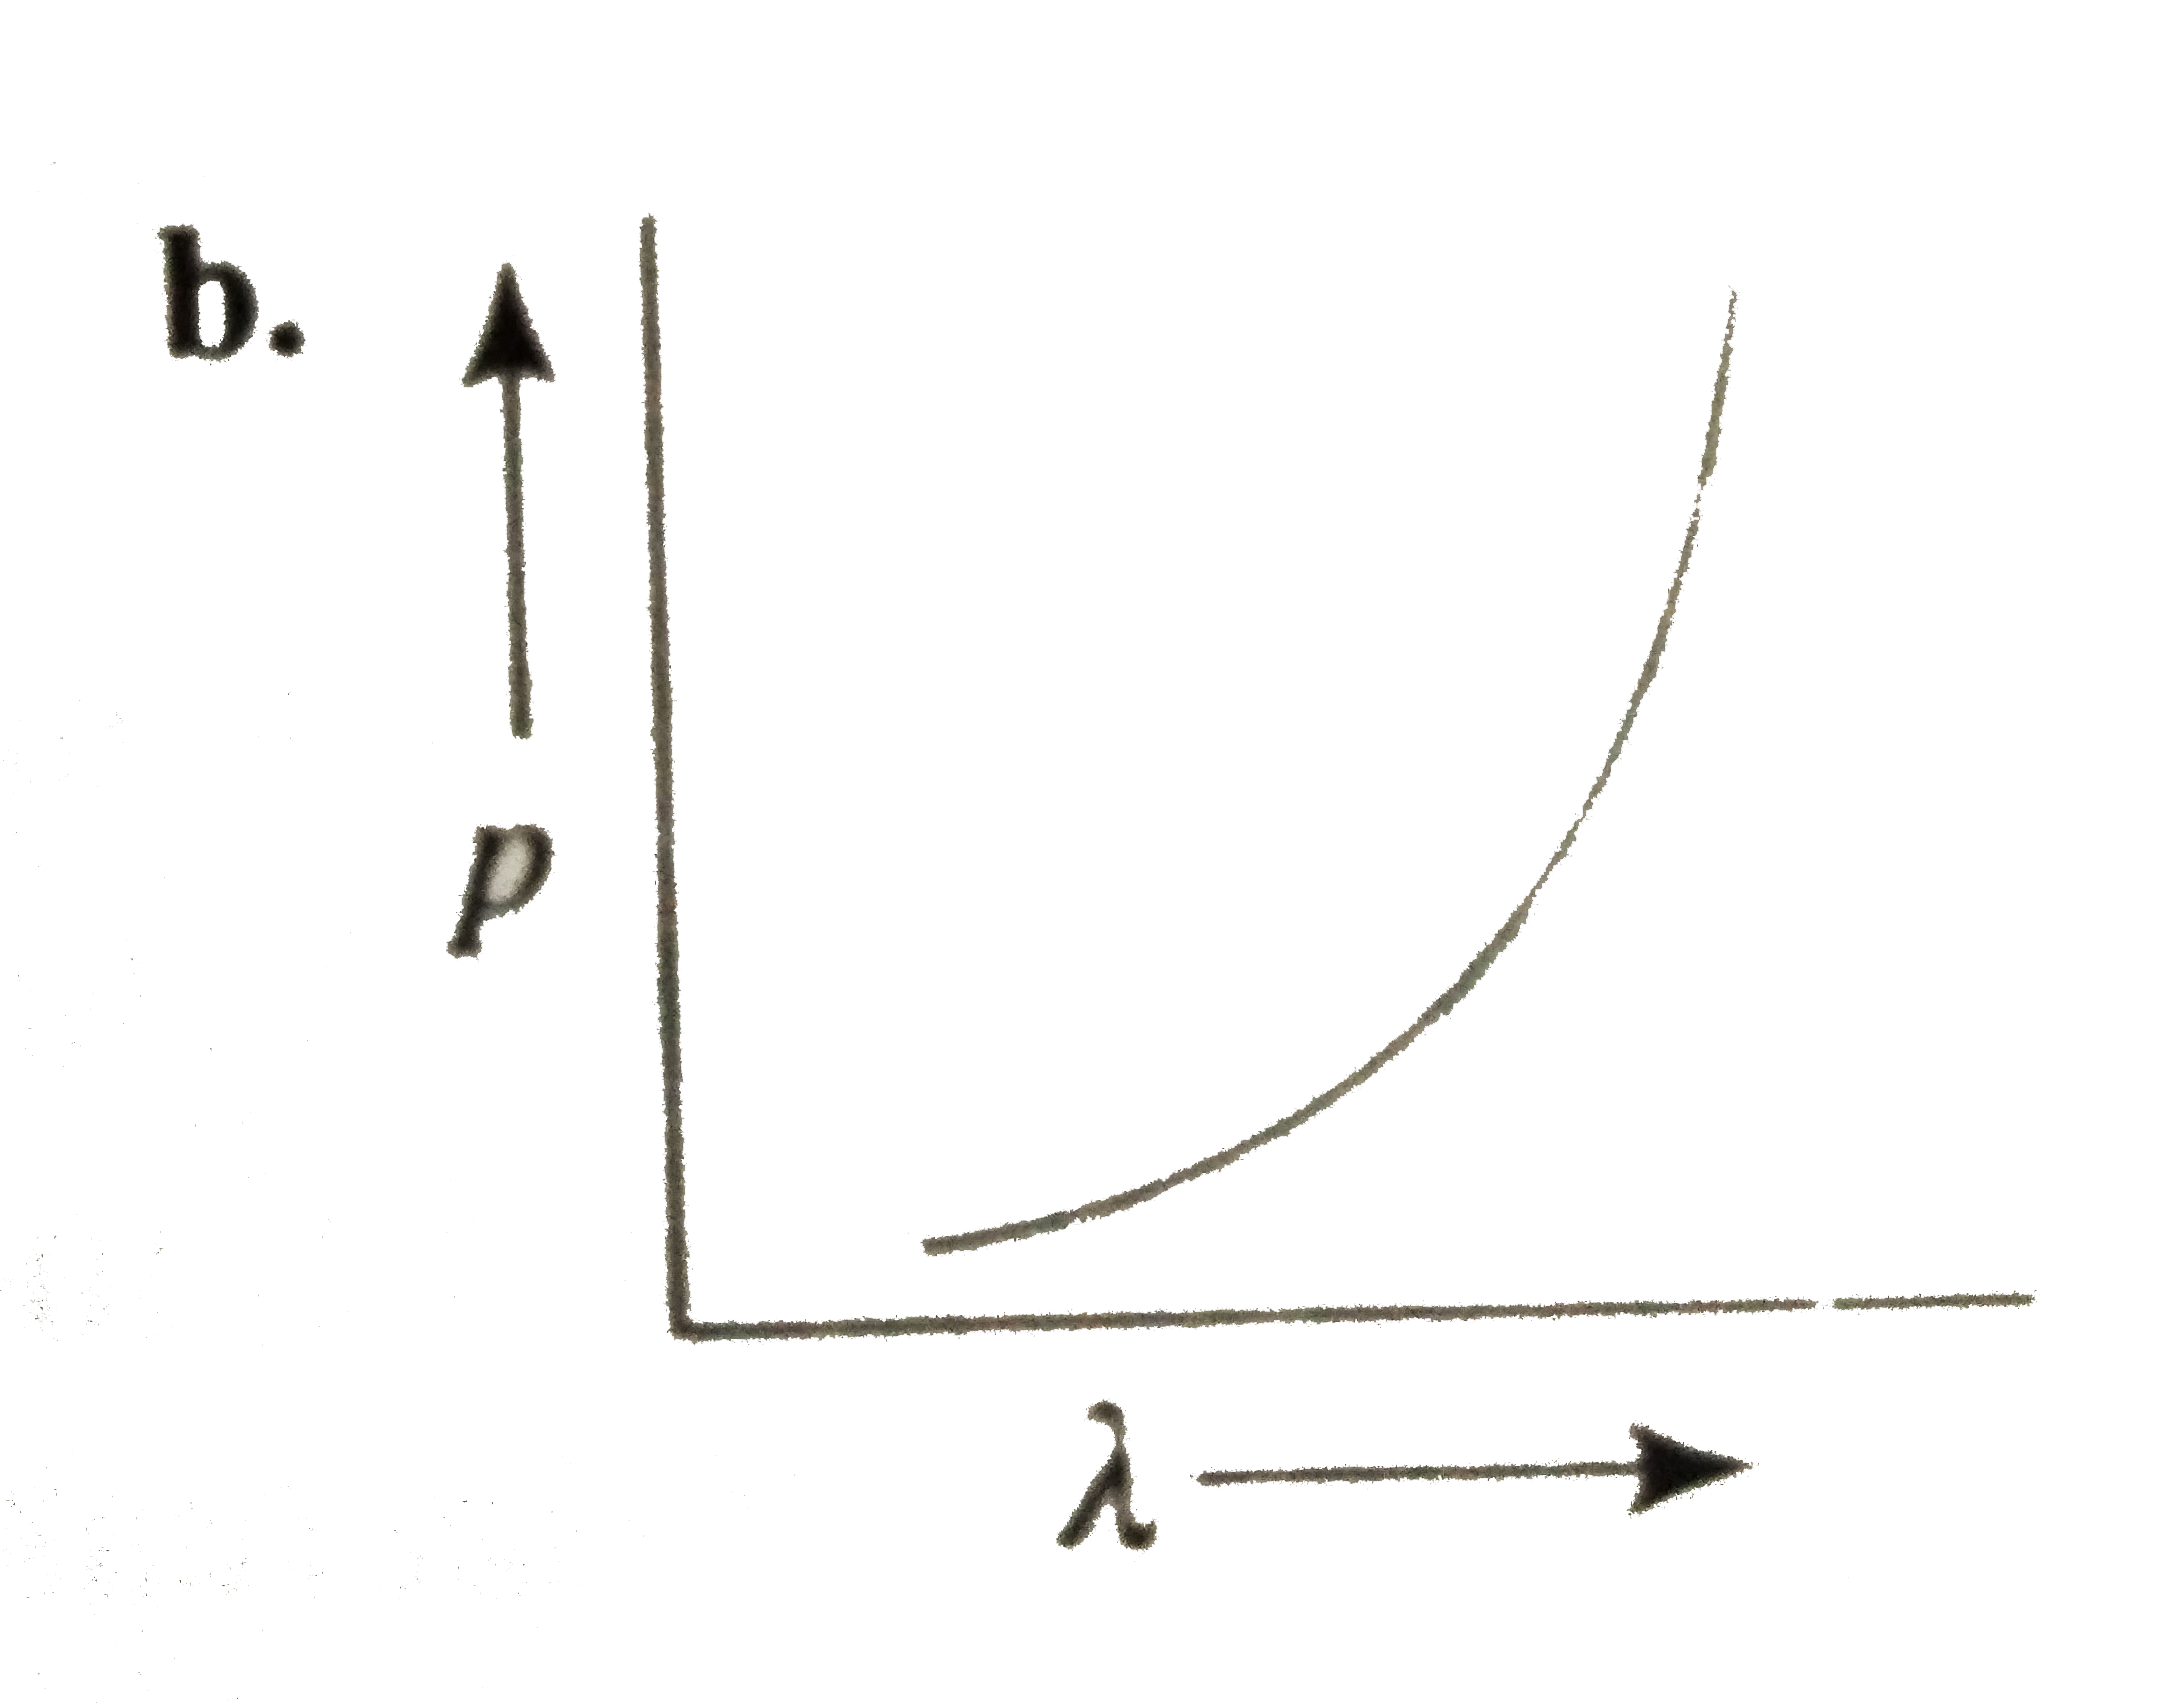
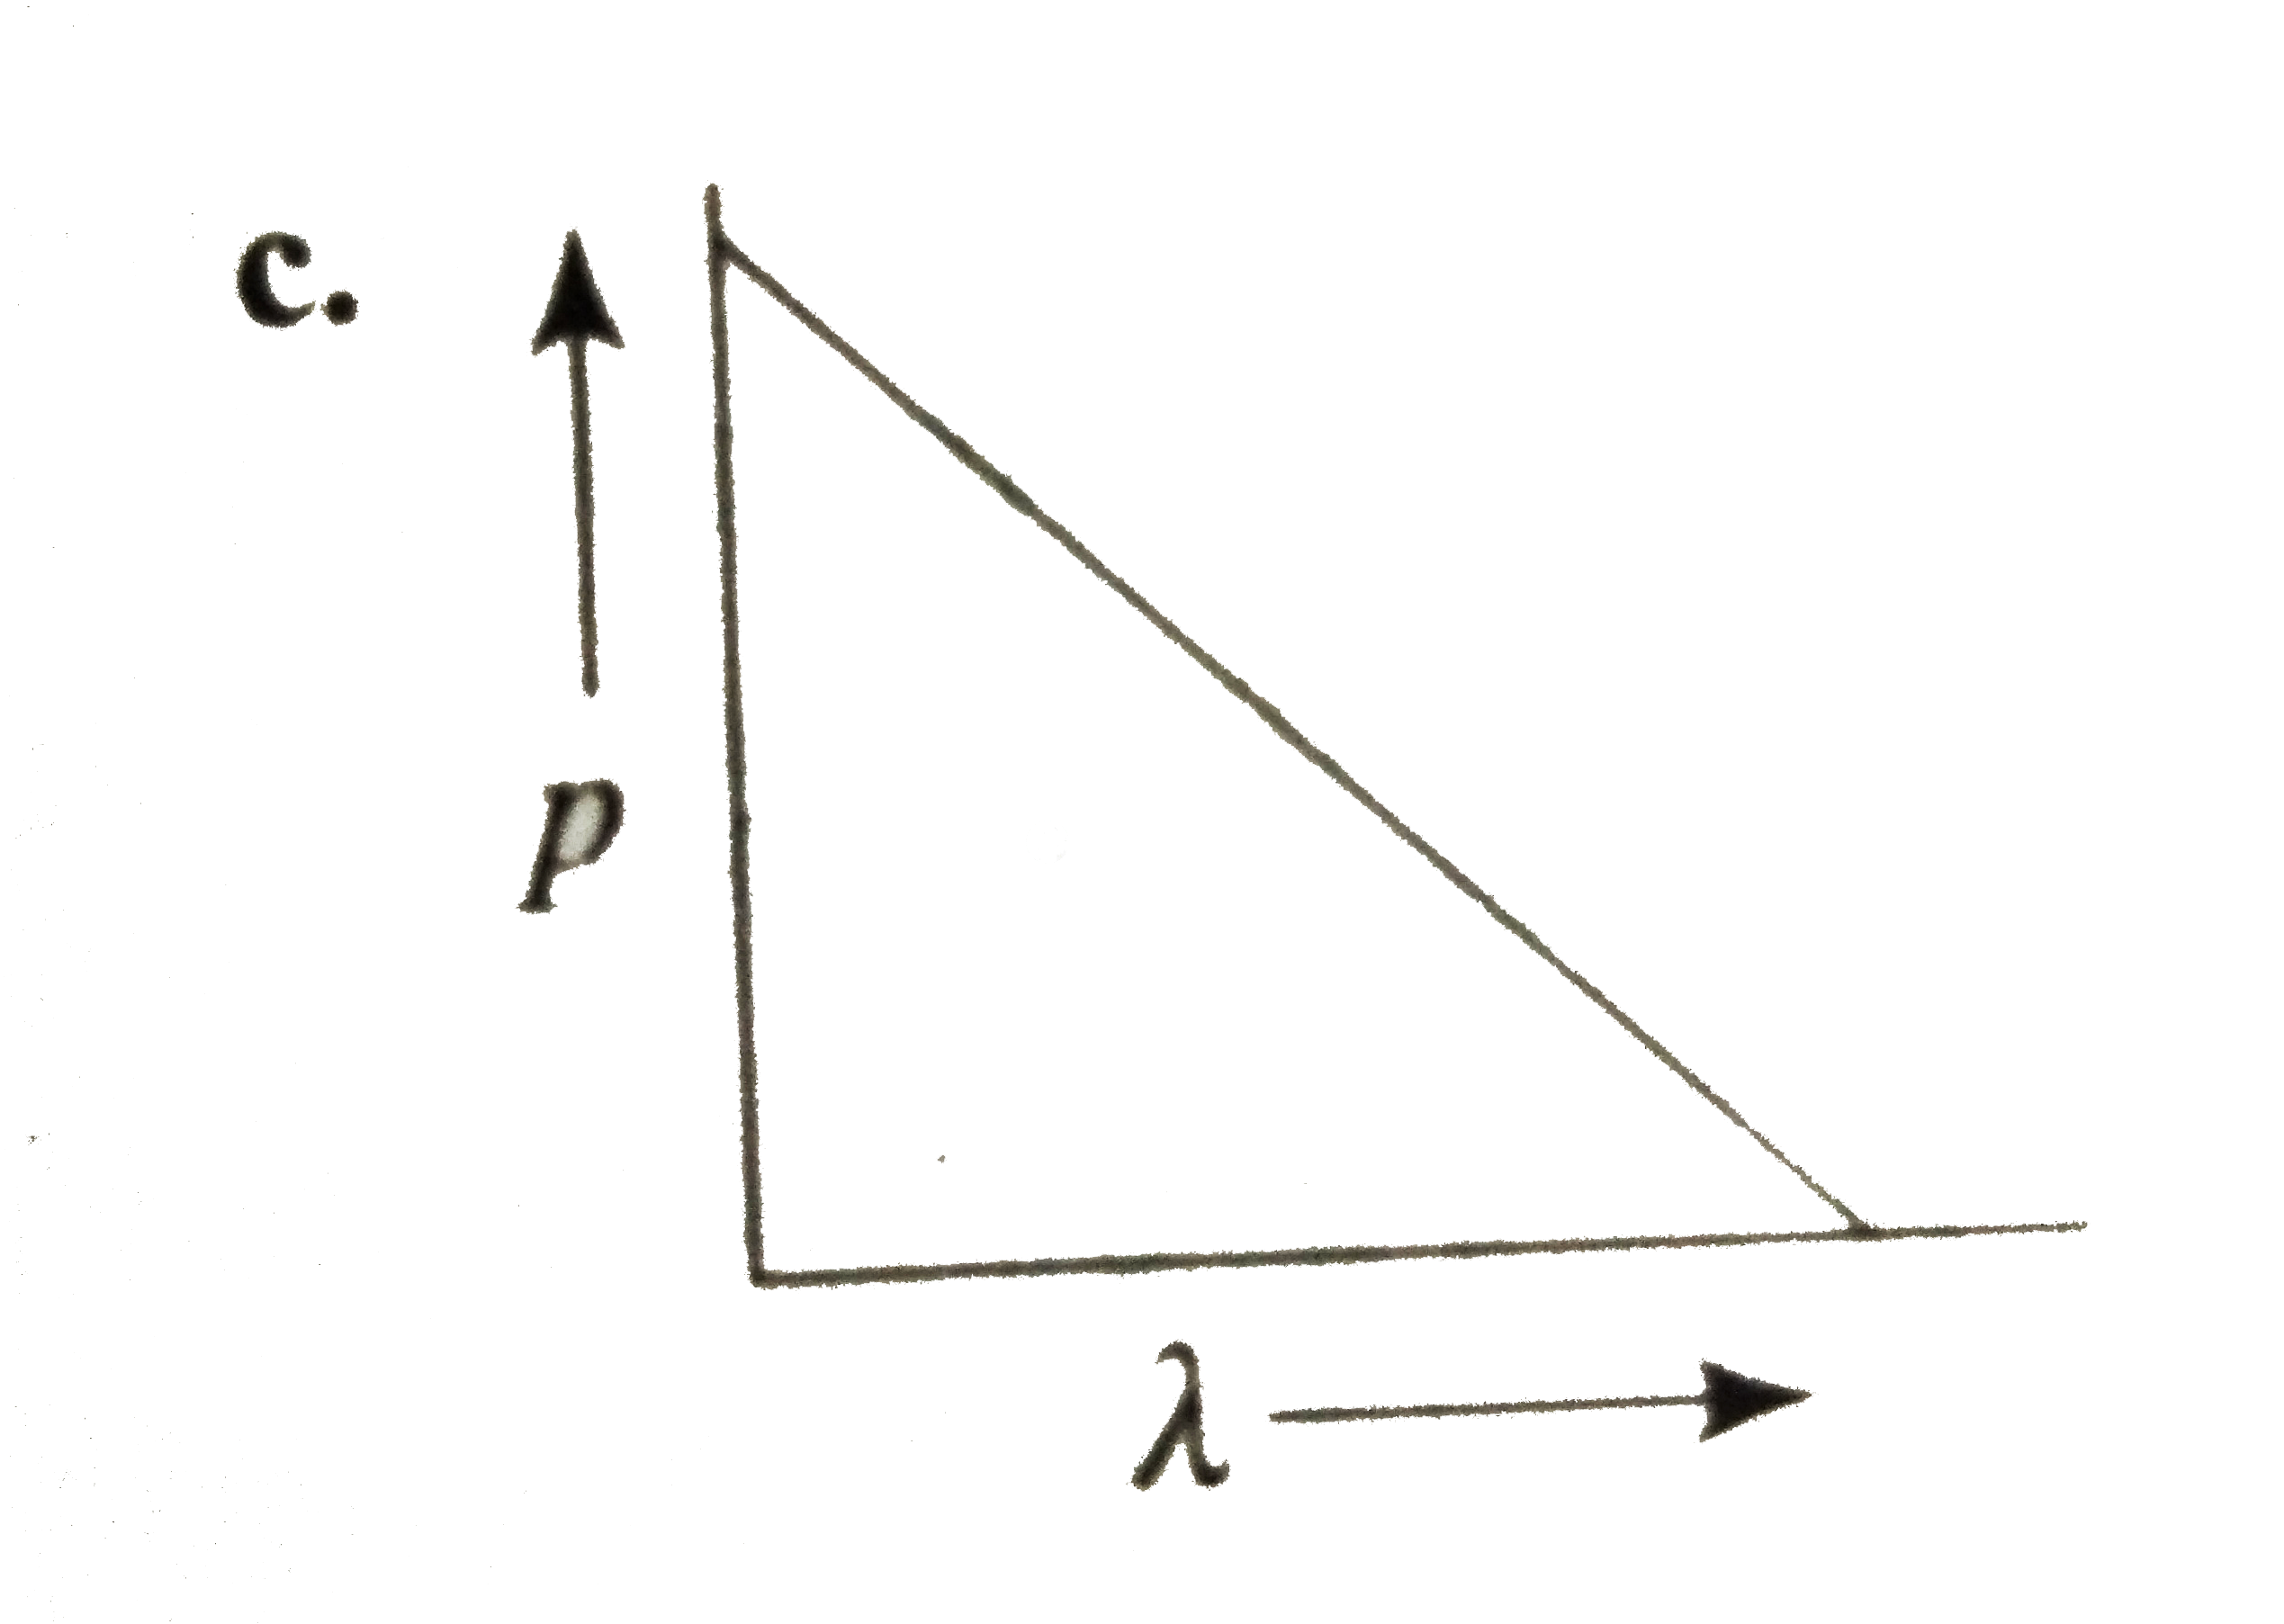
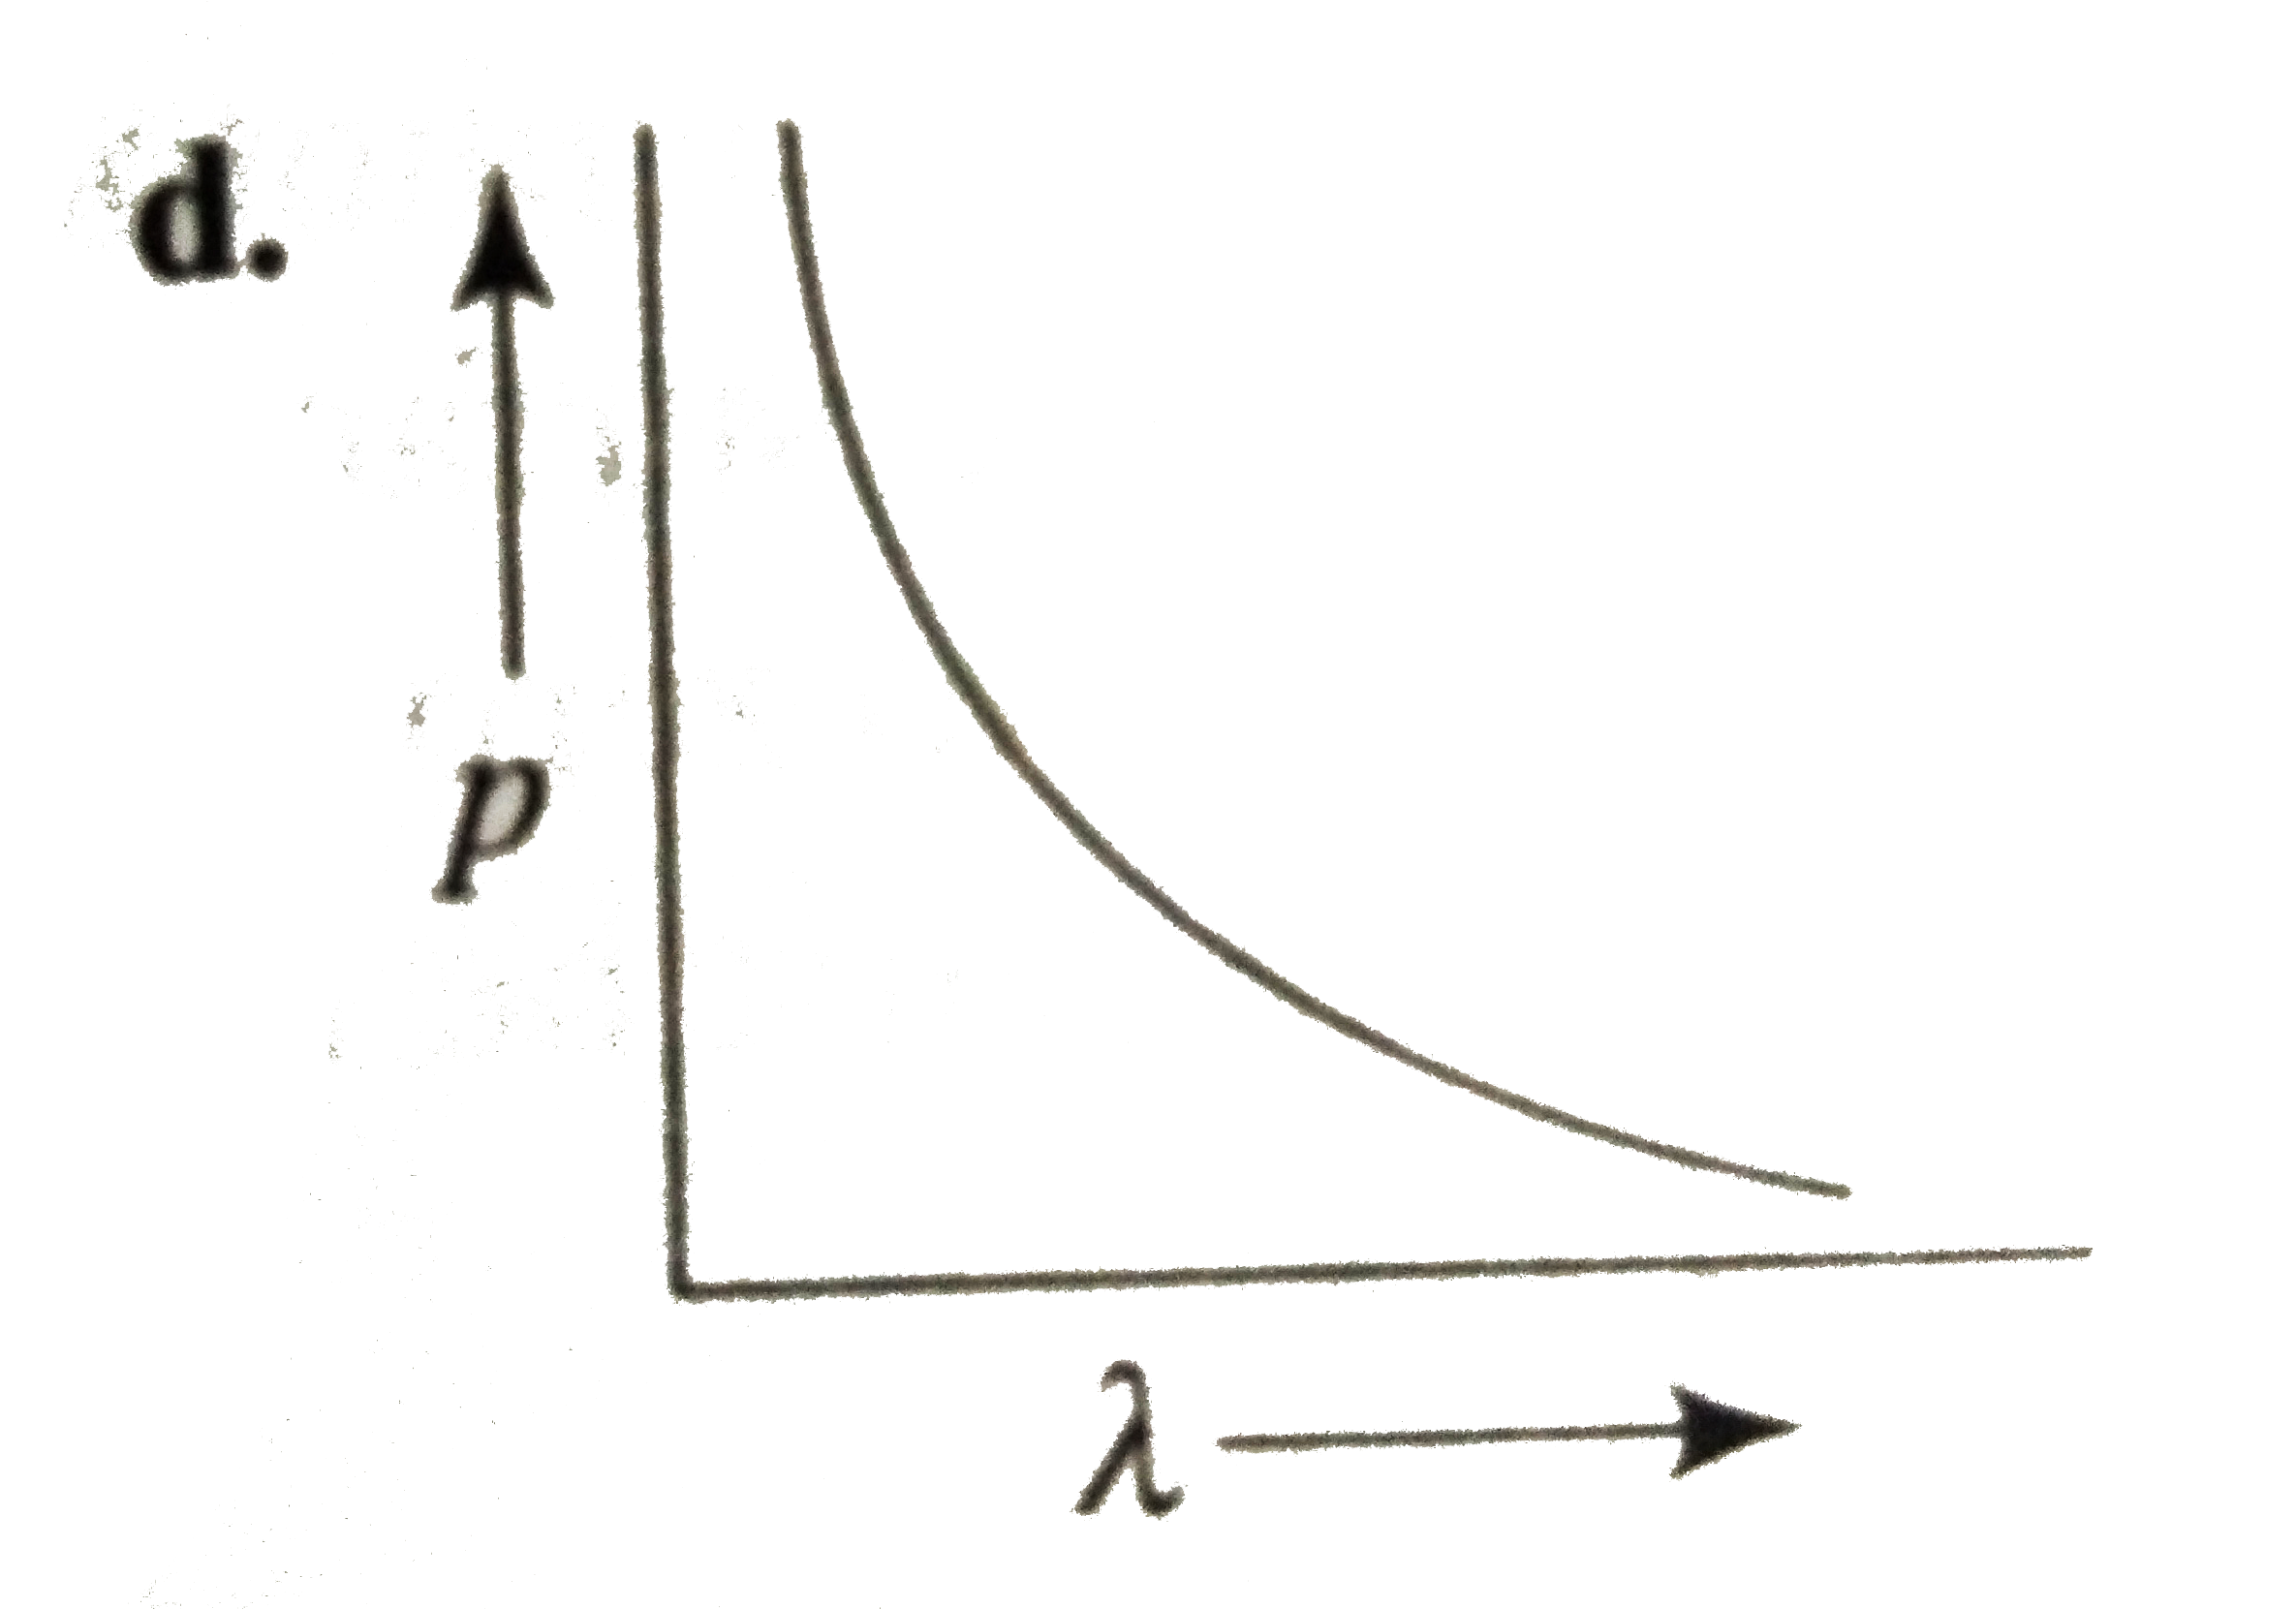
The correct Answer is:D
To solve the question regarding the variation of particle momentum with associated de Broglie wavelength, we need to understand the relationship between momentum (p) and wavelength (λ) as described by the de Broglie hypothesis.
1. Understand de Broglie's Relation: According to de Broglie’s hypothesis, the momentum (p) of a particle is inversely proportional to its wavelength (λ). This relationship can be expressed mathematically as:
p=hλ
where h is Planck's constant.
2. Rearranging the Equation: From the above equation, we can rearrange it to show the relationship between momentum and wavelength:
λ=hp
This indicates that as the momentum increases, the wavelength decreases, and vice versa.
3. Graphical Representation: The relationship p=hλ can be interpreted as a hyperbolic relationship. If we plot momentum (p) on the y-axis and wavelength (λ) on the x-axis, we can see that the graph will be a rectangular hyperbola, as both p and λ cannot be zero.
4. Characteristics of the Graph: The graph will approach the axes but will never touch them, indicating that neither momentum nor wavelength can be zero. As momentum increases, the wavelength decreases, creating the hyperbolic shape.
5. Conclusion: The correct graph representing the variation of particle momentum with associated de Broglie wavelength is a rectangular hyperbola.
p=hλ
where h is Planck's constant.
λ=hp
This indicates that as the momentum increases, the wavelength decreases, and vice versa.
Topper's Solved these Questions
- PHOTOELECTRIC EFFECTBook:CENGAGE PHYSICSChapter:PHOTOELECTRIC EFFECTExercise:Multiple Correct
Explore 10 Videos
- PHOTOELECTRIC EFFECTBook:CENGAGE PHYSICSChapter:PHOTOELECTRIC EFFECTExercise:Linked Comprehension
Explore 44 Videos
- PHOTOELECTRIC EFFECTBook:CENGAGE PHYSICSChapter:PHOTOELECTRIC EFFECTExercise:Subjective
Explore 16 Videos
- NUCLEIBook:CENGAGE PHYSICSChapter:NUCLEIExercise:QUESTION BANK
Explore 59 Videos
- RAY OPTICSBook:CENGAGE PHYSICSChapter:RAY OPTICSExercise:DPP 1.6
Explore 12 Videos
Similar Questions
Which of following graphs correctly represents the variation of particle momentum with de-Broglie wavelength?
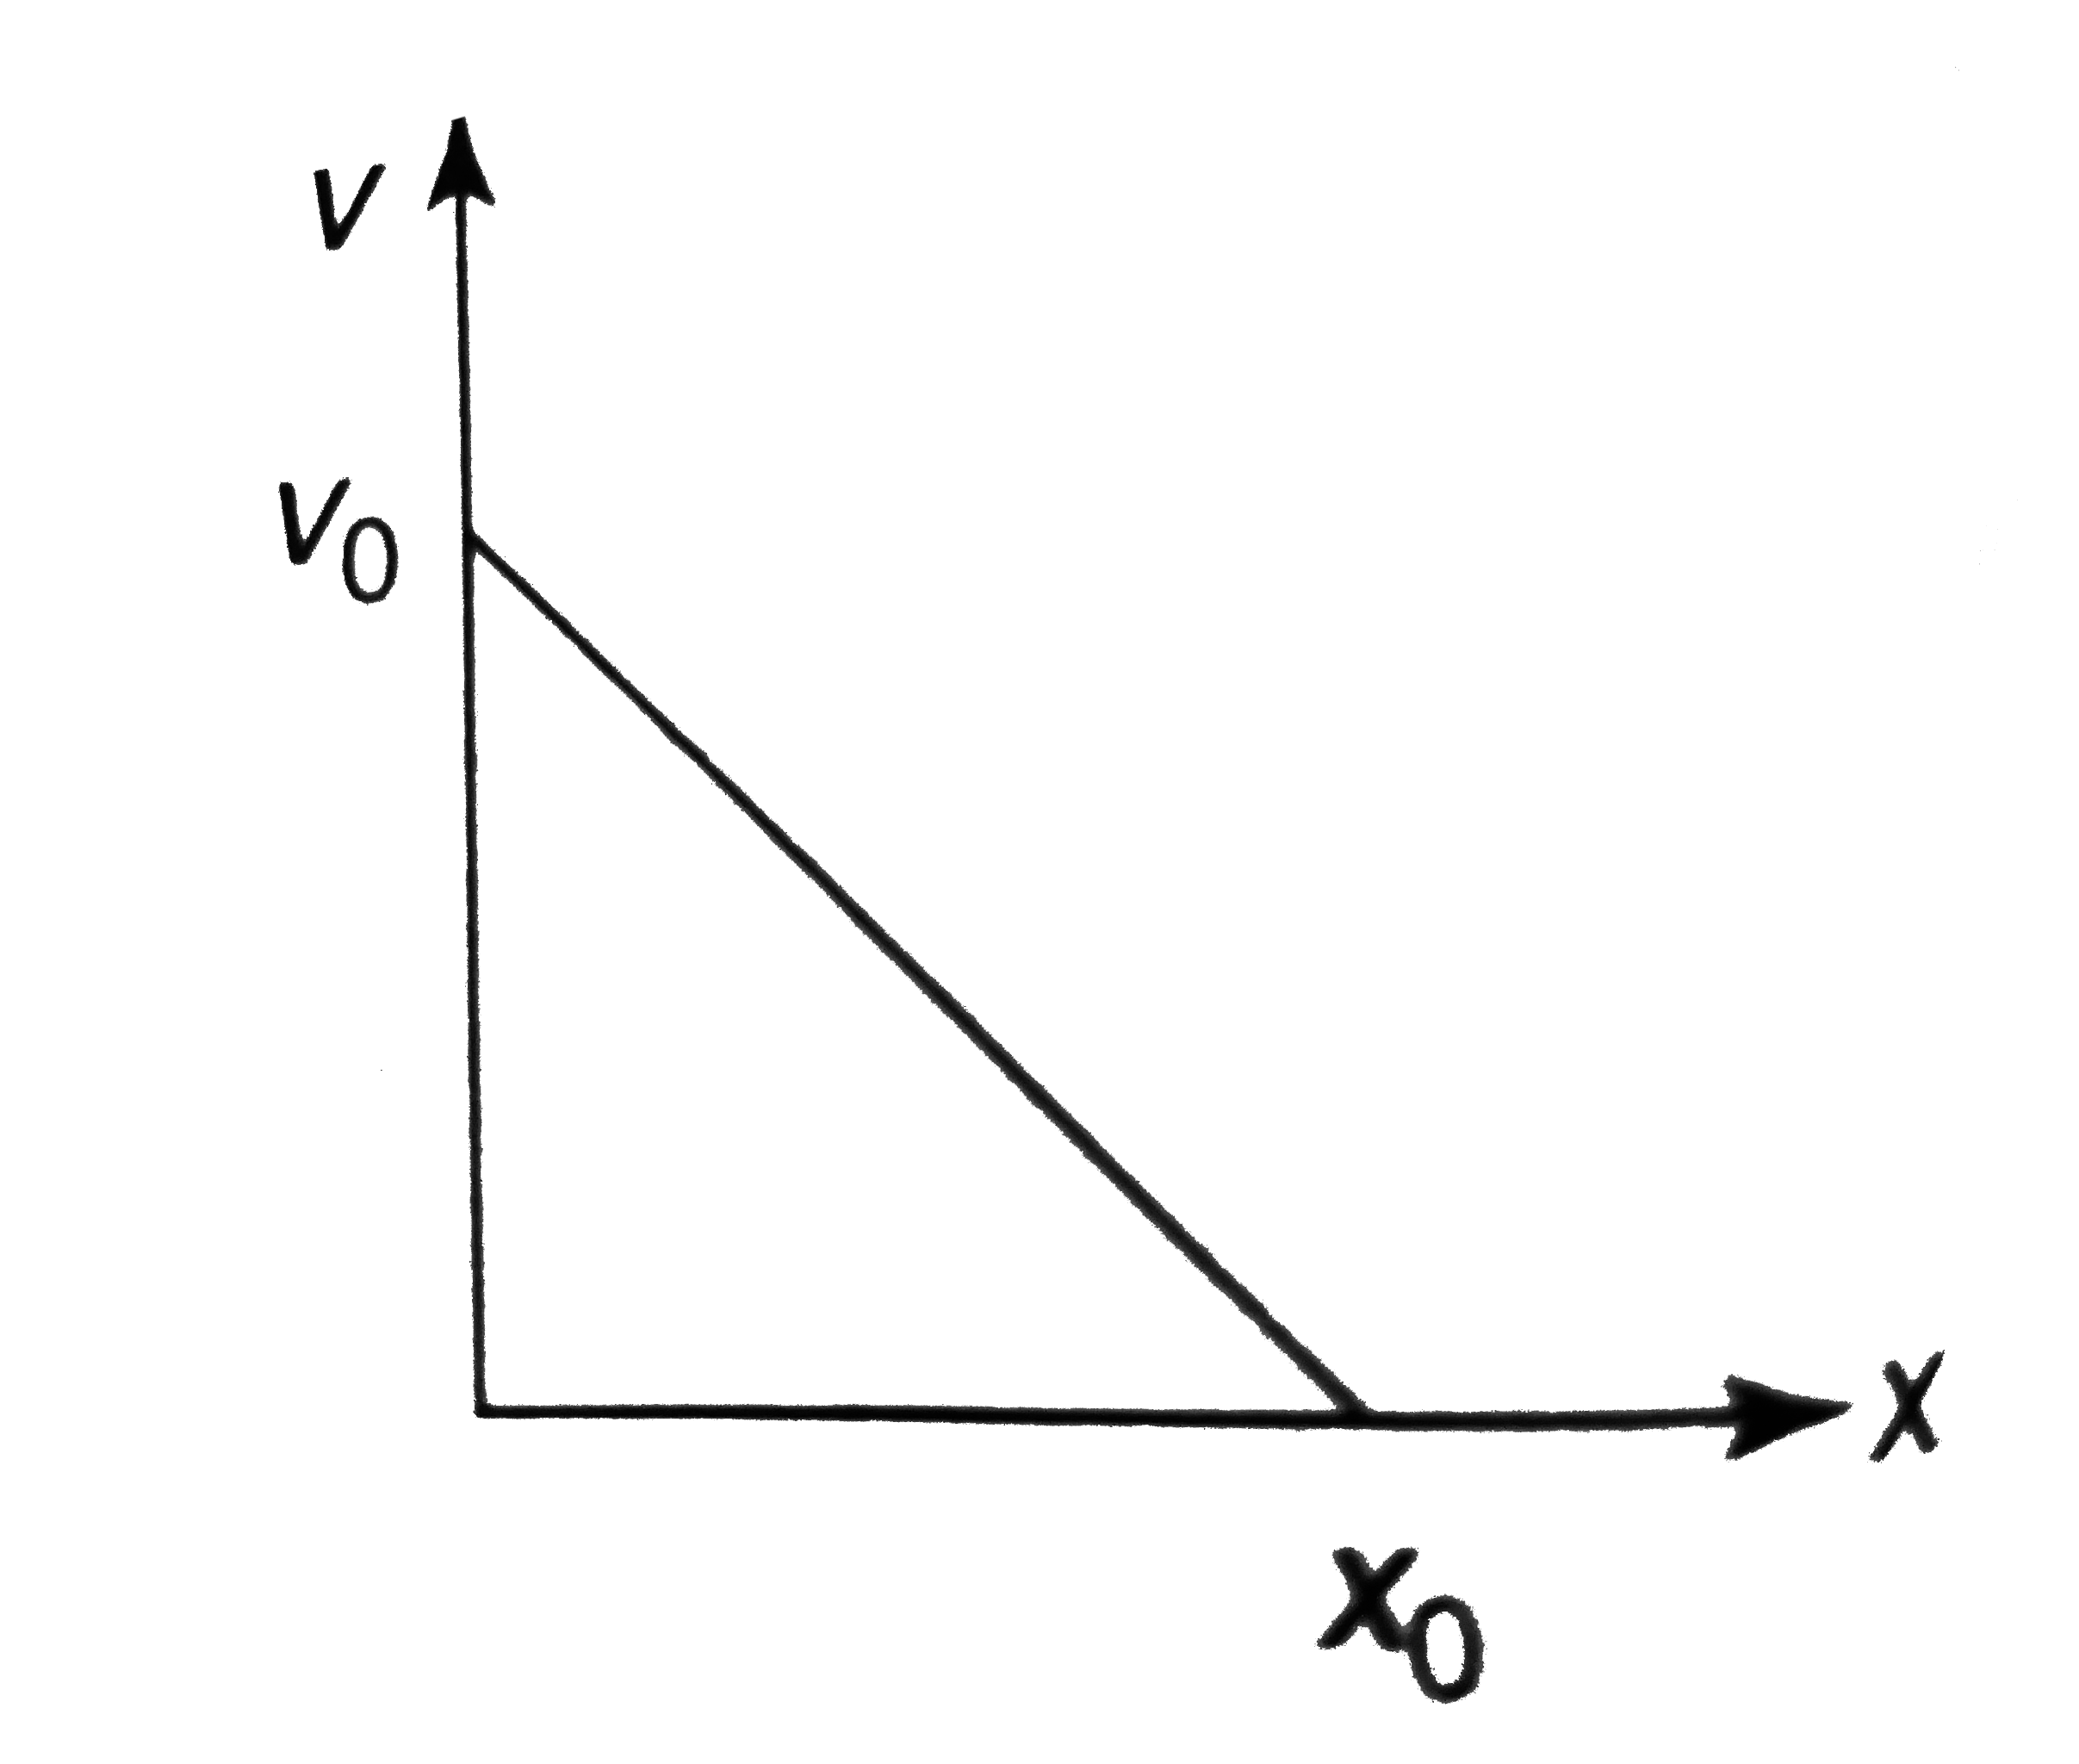
View SolutionThe velocity -displacement graph of a particle is as shown in the figure. Which of the following graphs correctly represents the variation of acceleration with displacement?

View Solution
Knowledge Check
Which of the following figure represents the variation of particle momentum and the associated de - Broglie wavelength ?
A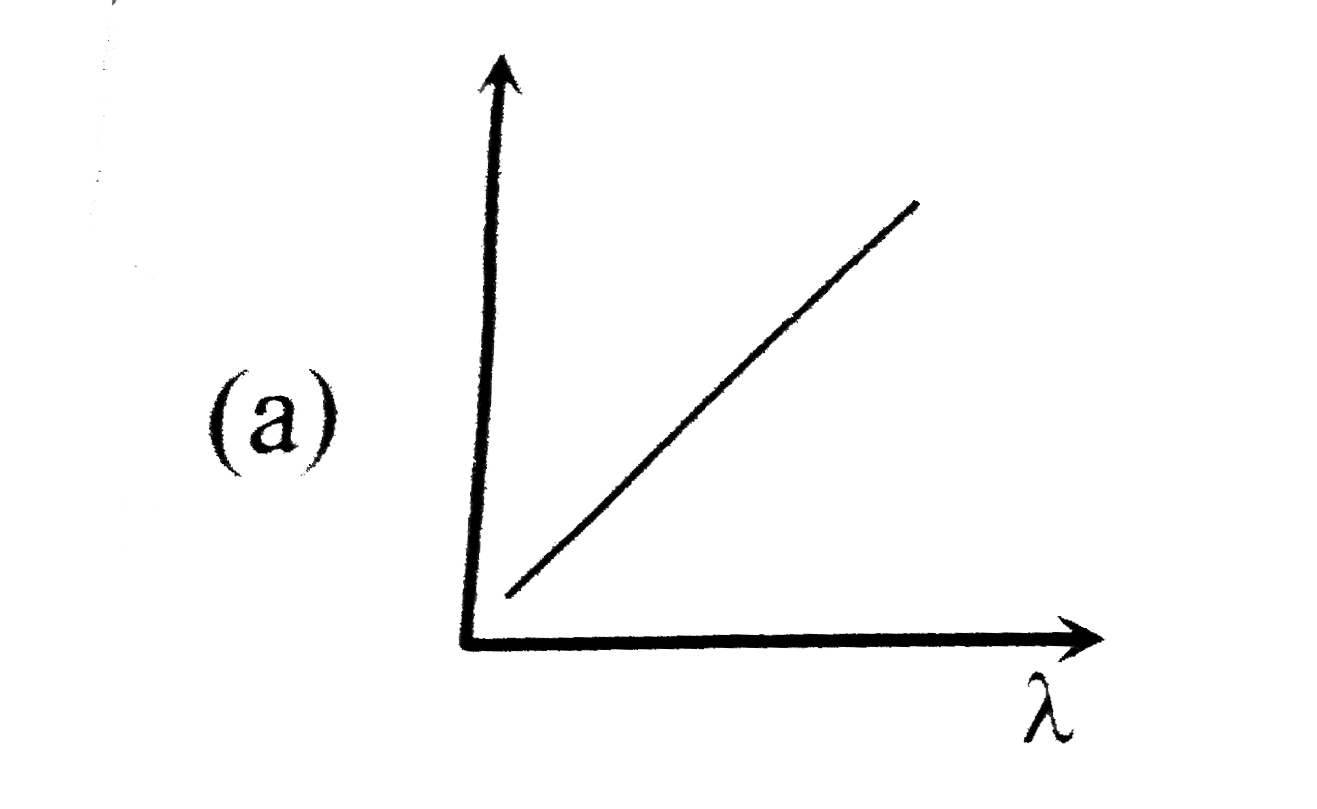 B
B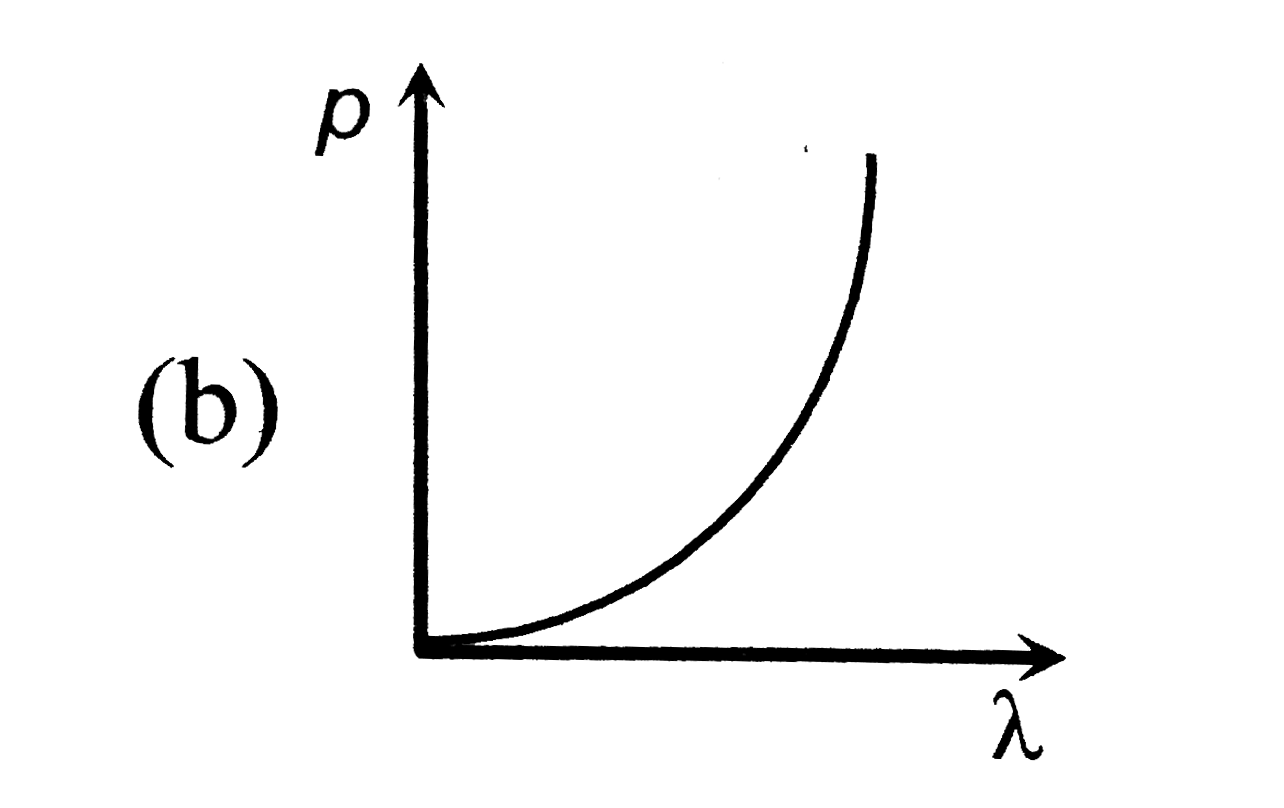 C
C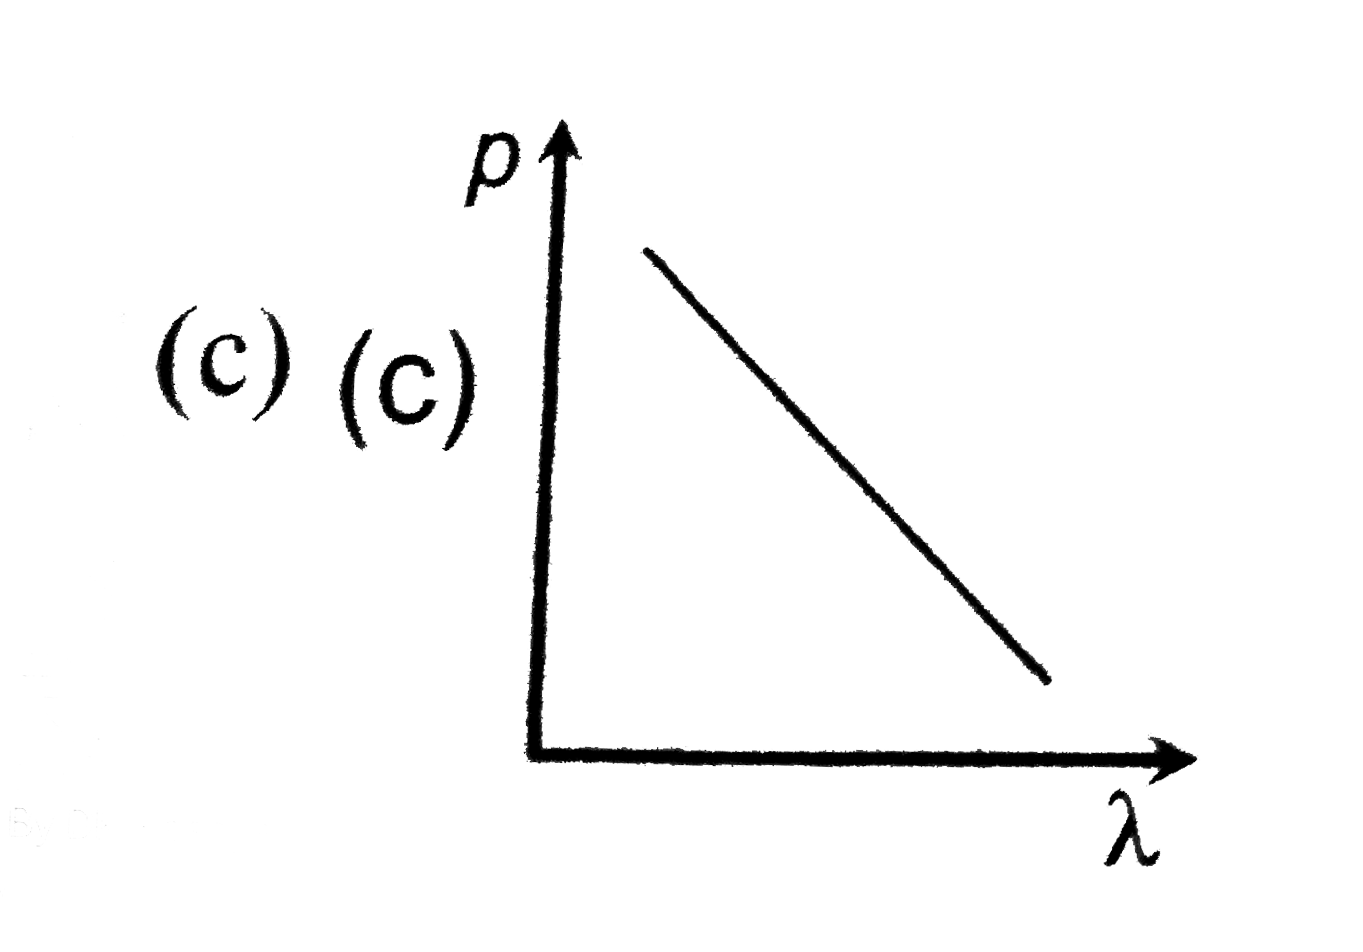 D
D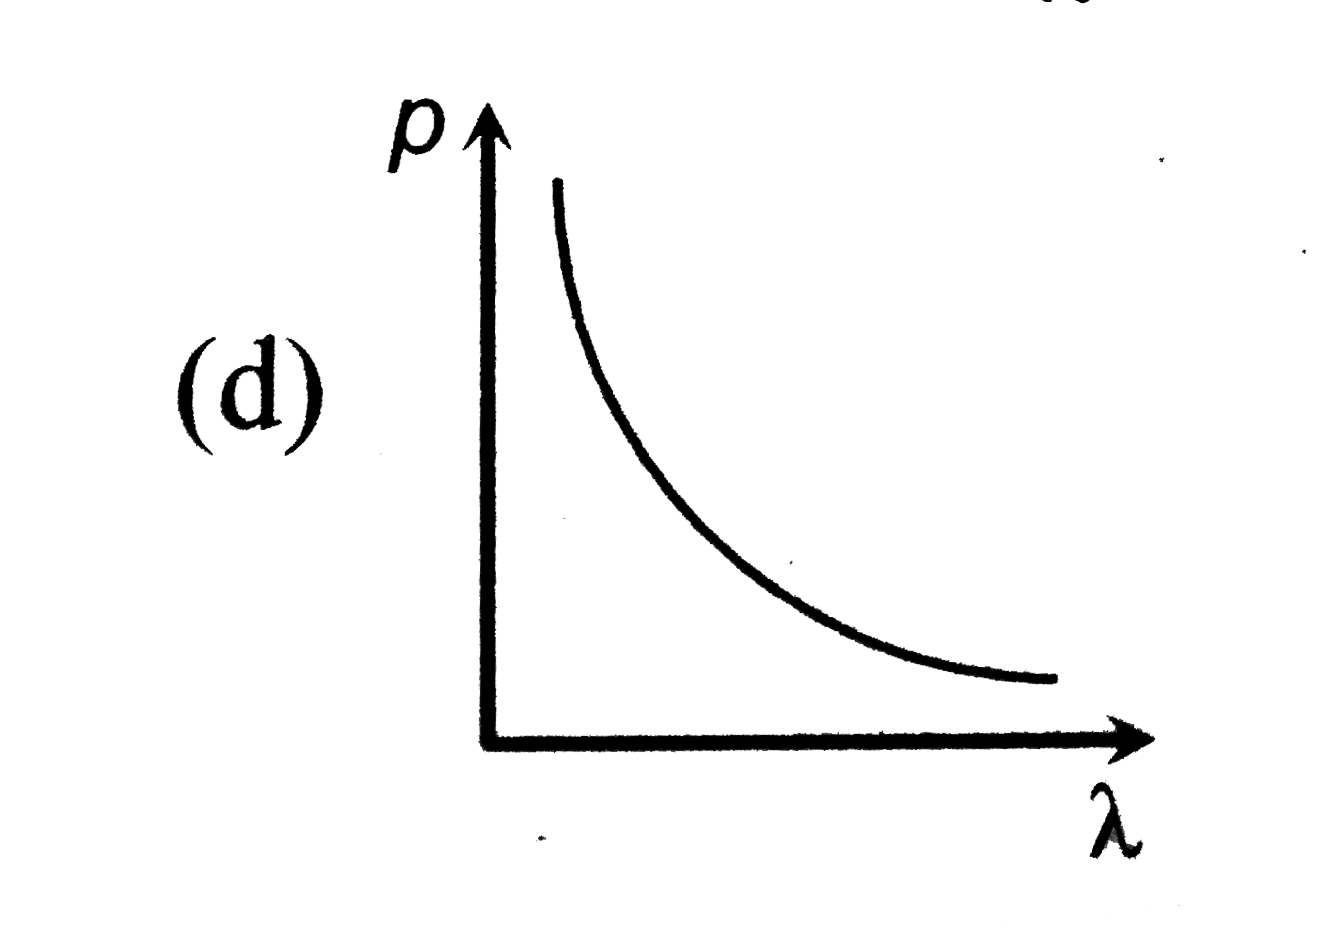
Which of the following graph represent the variation of particle momentum and associated de Broglie wavelength?
A B
B C
C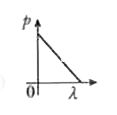 D
D
Which of the following figure represents the variation of particle momentum and the associated de - Broglie wavelength ?
A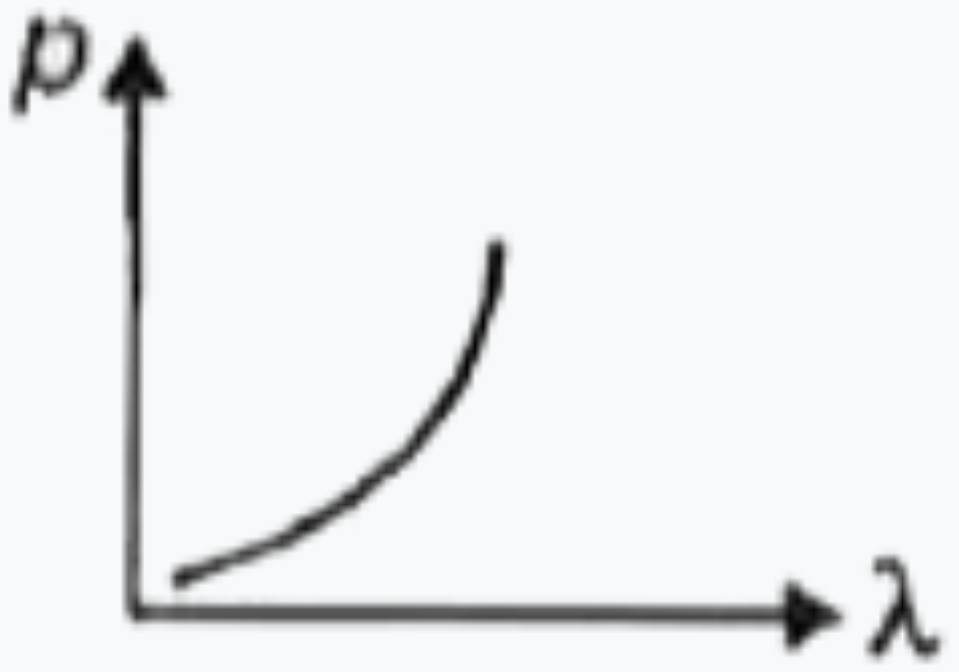 B
B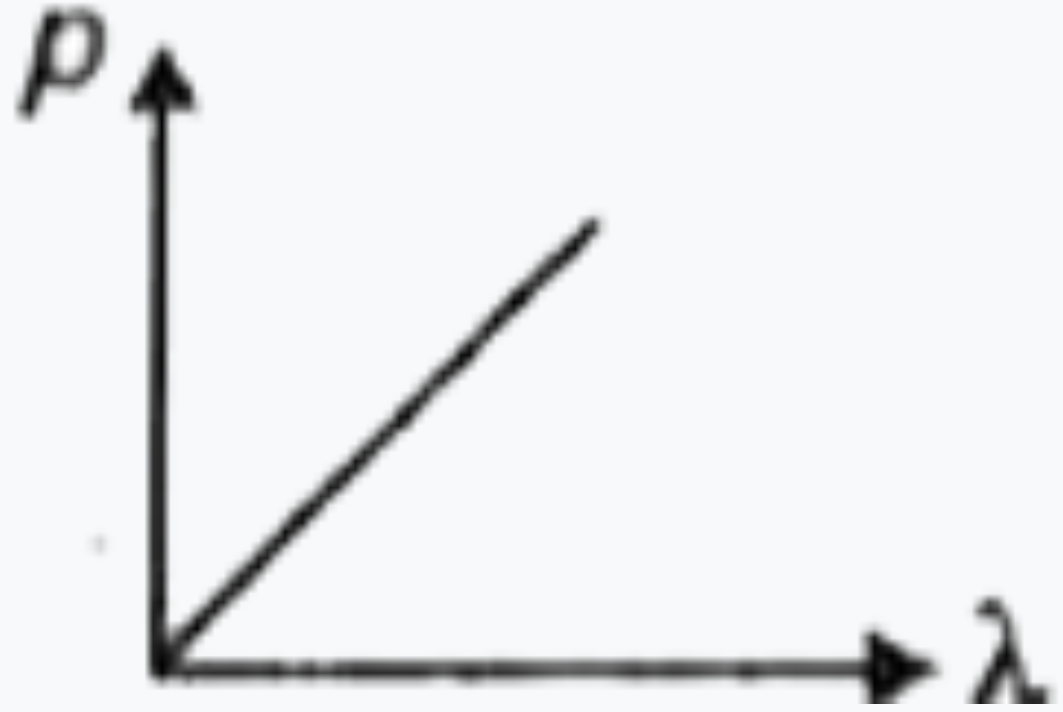 C
C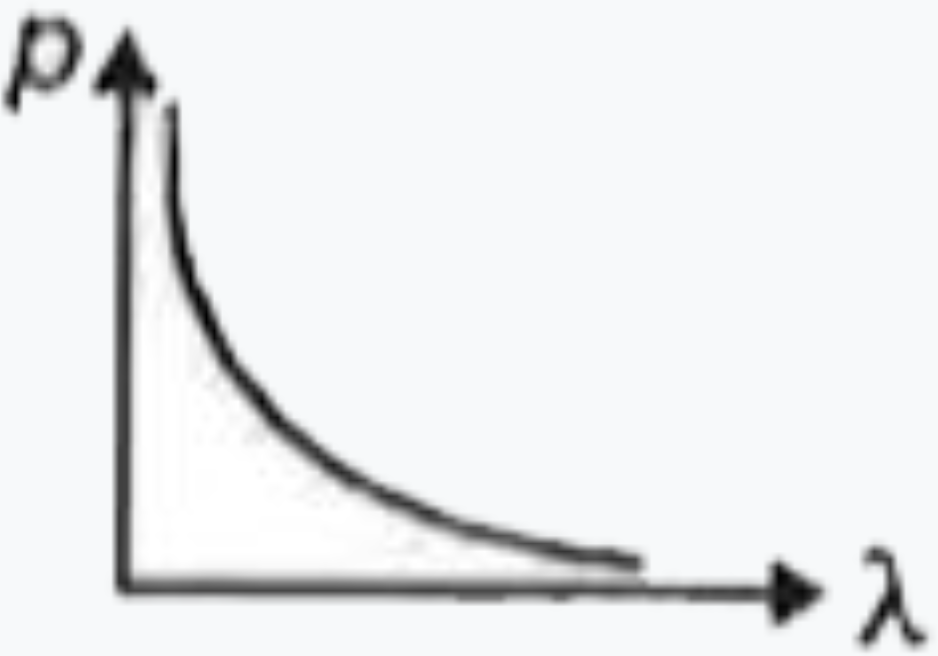 D
D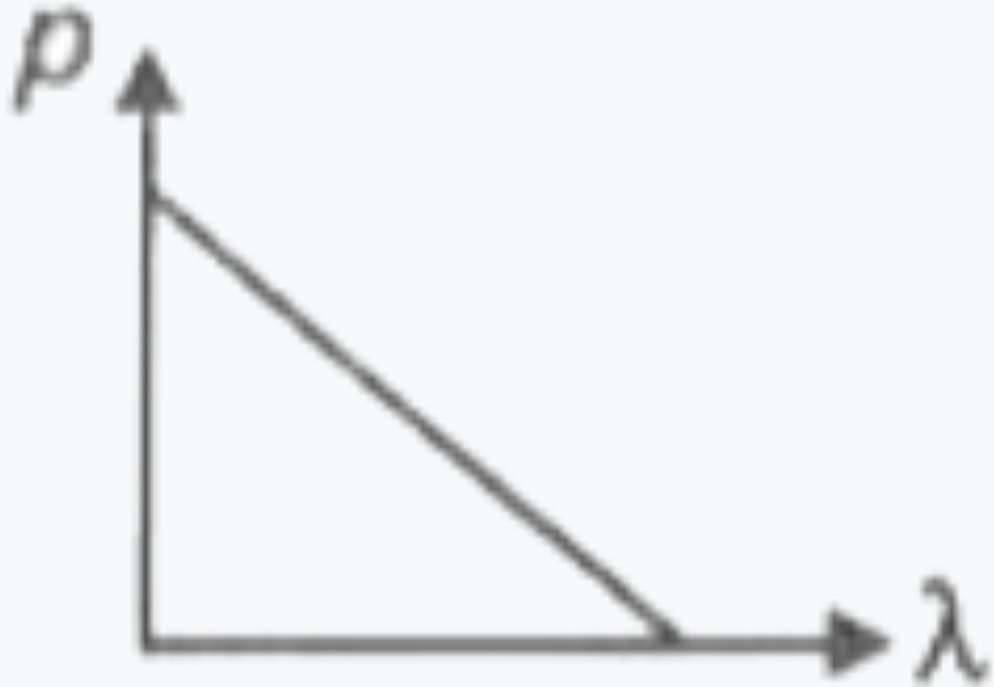
Which of the following figure represents the variation of particle momentum and the associated de - Broglie wavelength ?
View SolutionThe given graph shows the variation of velocity with displacement. Which one of the graphs given below correctly represents the variation of acceleration with displacement ?
View SolutionWhich one of the following correctly represents the variation between linear momentum (P) and kinetic energy (E) ofa body?
View SolutionThe momentum of a particle associated with de-Broglie's wavelength of 6Å is
View SolutionWhich of the following is correct regarding de-Broglie wavelength?
View Solution

