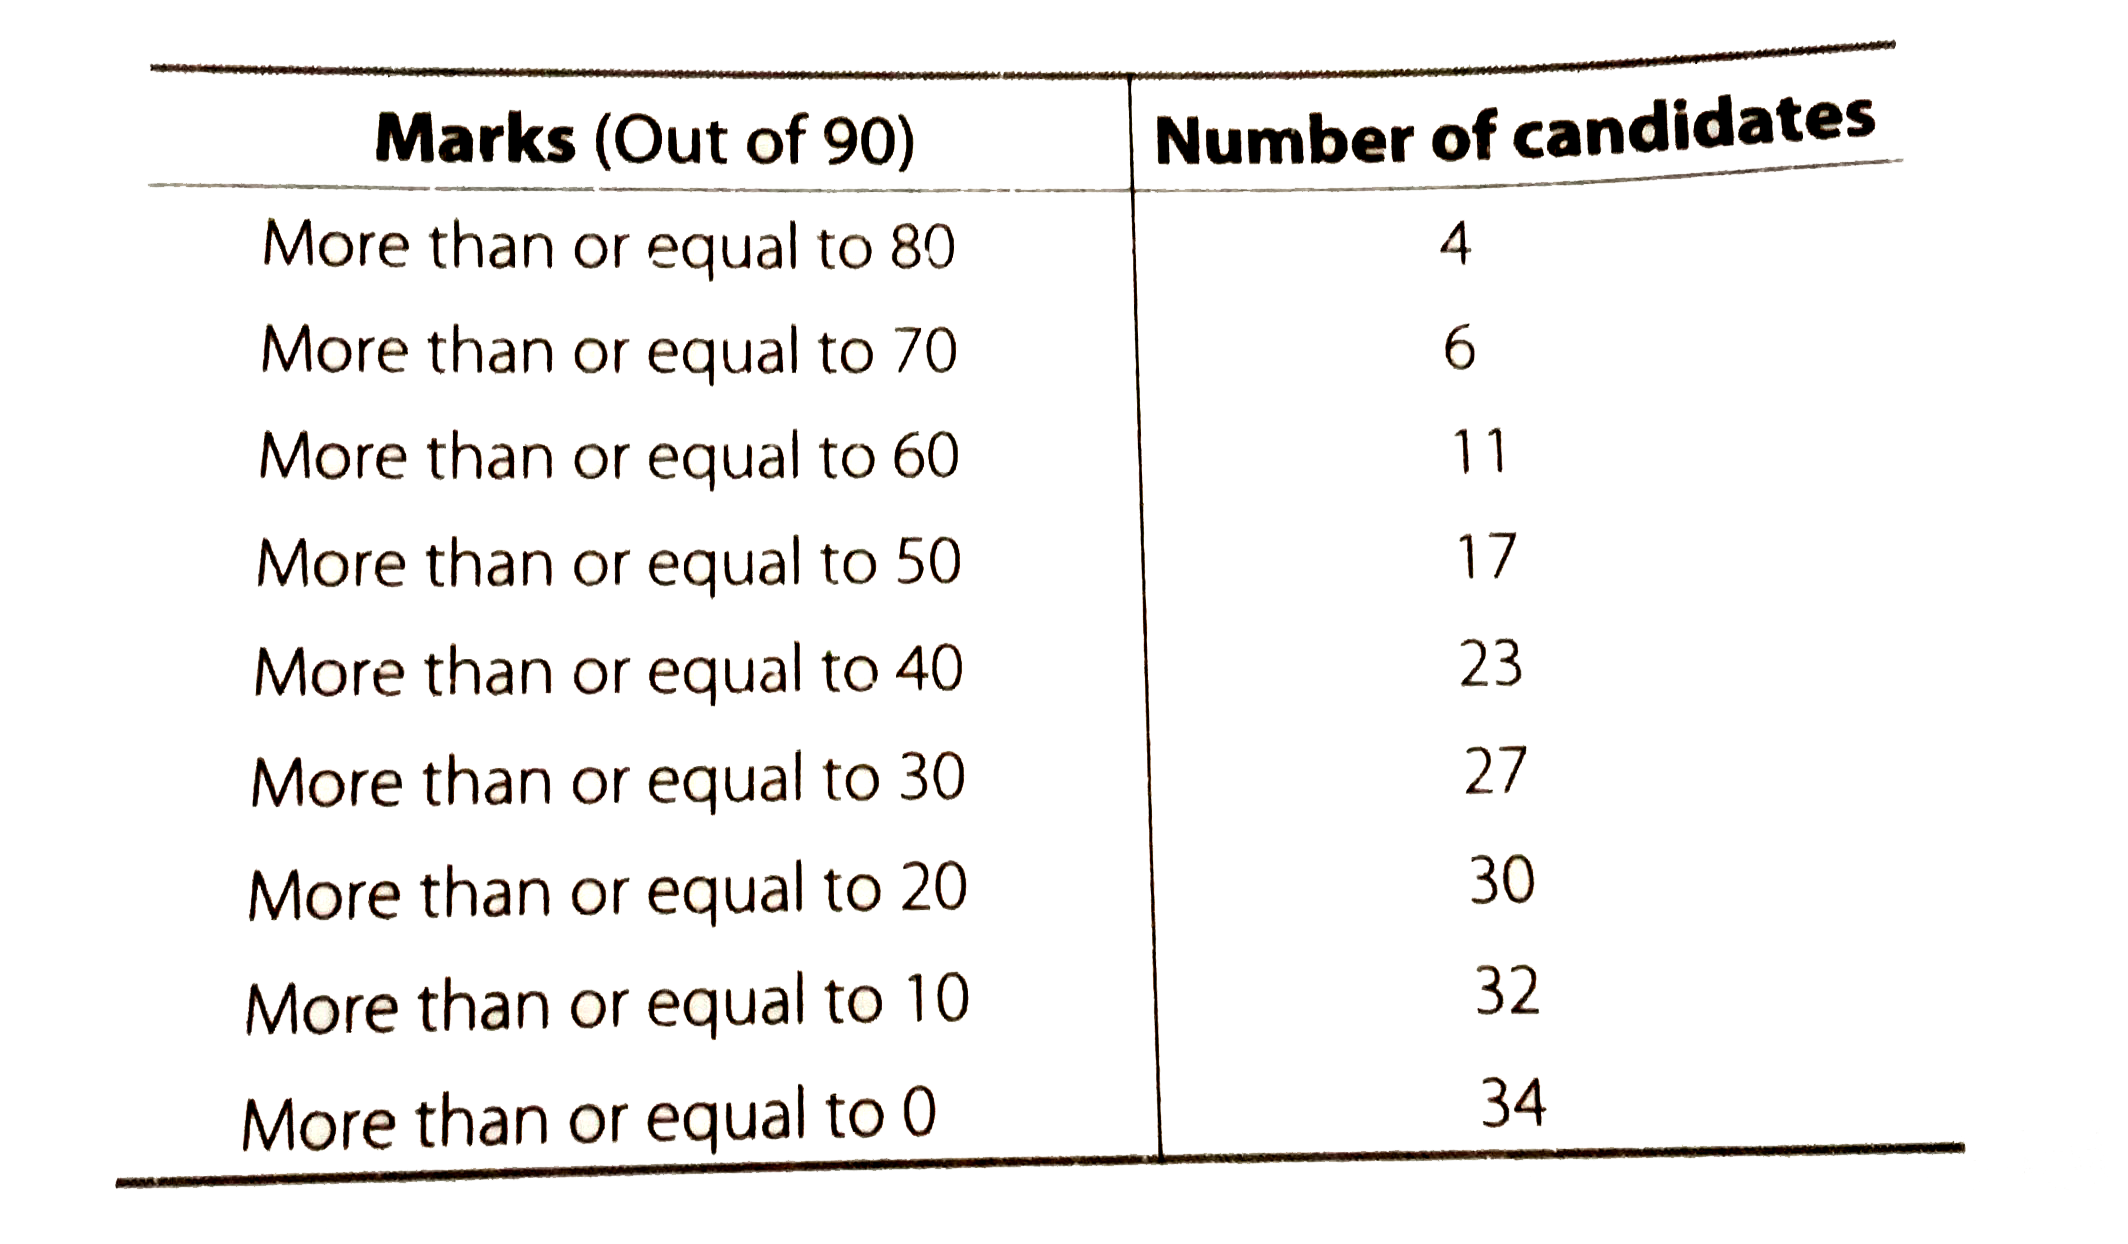
The following table shows the frequency distribution of the time required for each worker to complete a work. From the table find the mean time required to complete the job for a worker.

The correct Answer is:25.3hrs
Step by step video & image solution for The following table shows the frequency distribution of the time required for each worker to complete a work. From the table find the mean time required to complete the job for a worker. by Maths experts to help you in doubts & scoring excellent marks in Class 10 exams.
Updated on:21/07/2023Topper's Solved these Questions
- STATISTICSBook:TARGET PUBLICATIONChapter:STATISTICSExercise:Apply your knowledge
Explore 5 Videos
- STATISTICSBook:TARGET PUBLICATIONChapter:STATISTICSExercise:Chapter Assessment
Explore 15 Videos
- STATISTICSBook:TARGET PUBLICATIONChapter:STATISTICSExercise:Multiple Choice Questions
Explore 14 Videos
- SIMILARITY Book:TARGET PUBLICATIONChapter:SIMILARITY Exercise:Chapter Assessment
Explore 19 Videos
- TRIGONOMETRY Book:TARGET PUBLICATIONChapter:TRIGONOMETRY Exercise:Chapter Assessment
Explore 18 Videos
Similar Questions
Knowledge Check
15 men complete a work in 16 days. If 24 men are employed, then the time required to complete that work will be
A7 daysB8 daysC10 daysD12 daysIf 40 workers can complete a task in 24 days, then, find the time taken by 16 workers to complete twice the work.
A125 daysB122 daysC120 daysD116 days
State True or False: The Total Elapsed is the time required to complete all the jobs i.e. entire task.
View SolutionThe following table given the information of frequency distribution of weekly wages of 150 workers of a company . Find the mean of the weekly wages by 'step deviation' method .

View SolutionThe following table gives the information of frequency distribution of weekly wages of 150 workers of a company. Find the mean of the weekly wages by 'step deviation' method.

View SolutionThe following table gives the information of frequency distribution of weekly wages of 150 workers of a company .Find the mean ofg the weekly wages by 'step devition'Method.

View SolutionThe following table shows the frequency table of daily wages of 50 workers in a trading company. Find the mean wages of a worker, by assumed mean method.

View SolutionThe following table shows the weights of 12 workers in a factor
:Find the mean weight

View Solution


