The following table shows the household expenditure of family on different items. Draw a pie chart to represent the given data.
Step by step video solution for The following table shows the household expenditure of family on different items. Draw a pie chart to represent the given data. {:("Item","Rent","Food","Cloting","Education","Others"),("Expenditure",25%,30%,10%,15%,20%):} by Maths experts to help you in doubts & scoring excellent marks in Class 10 exams.
Updated on:21/07/2023Topper's Solved these Questions
- STATISTICSBOOK - TARGET PUBLICATIONCHAPTER - STATISTICSEXERCISE - Try this
2 Videos
- STATISTICSBOOK - TARGET PUBLICATIONCHAPTER - STATISTICSEXERCISE - Multiple Choice Questions
14 Videos
- SIMILARITY BOOK - TARGET PUBLICATIONCHAPTER - SIMILARITY EXERCISE - Chapter Assessment
19 Videos
- TRIGONOMETRY BOOK - TARGET PUBLICATIONCHAPTER - TRIGONOMETRY EXERCISE - Chapter Assessment
18 Videos
Similar Questions
The following table shows the percentage of people having different blood groups. Draw a pie chart to represent the given data.
Blood groupABCDPercentage of people20452015
View SolutionThe following data shows the expenditure of a person on different items during a month. Represent the data by a pie-chart. Items of expenditure, Rent, Education, Food, Clothing, Others Amount (in Rs.), 2700, 1800, 2400, 1500, 2400
View Solution
Knowledge Check
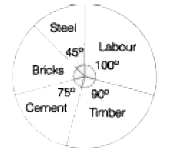
The following pie chart represents a total expenditure of 540000 on different items in constructing a flat in a town. The percentage of the total expenditure spent on steel and cement is
 A0.3323B0.25C3313%D30%
The monthly family expenditure (in percentage) on different items are as follows:
∣∣∣FoodRentClothTransportEducationOthers 38 19 18 − 9 6∣∣∣
If the total monthly expenditure is Rs 9000, then what is the expenditure on transport?ARs 180BRs 1000CRs 900DRs 360
The following data represents the approximate percentage of water in various oceans. Prepare a pie chart for the given data.
Pacific40%Atlantic30%Indian20%Others10%
View SolutionThe following table shows how a student spends his pocket money during the course of a month. Represent it by a pie-diagram. Items, Food, Entertainment, Other expenditure, Savings Expenditure, 40%, 25%, 20%, 15%
View SolutionThe following pie chart represents a total expenditure of 540000 on different items in constructing a flat in a town. Which is the item of maximum expenditure?

View SolutionFollowing is the break up of the expenditure of a family on different items of consumption.: Items, Food, Clothing, Rent, Education, Fuel etc., Medicine, Misc. Expenditure (in Rs), 1600, 200, 600, 150, 100, 80, 270 Draw a pie-diagram to represent the above data.
View SolutionThe following table shows the expenditure incurred by a publisher in publishing a book: Items, Paper, Printing, Binding, Advertishing, Misc. Expenditure (in %), 35%, 20%, 10%, 5%, 30% Present the above data in the form of a pie-chart.
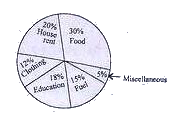
View SolutionThe following pie-chart shows the monthly expenditure of a family on food, house rent clothing, education, fuel and miscellaneous Study the pie-chart

Total percentage of expenditure on house rent, clothing and fuel is greater than the percentage of expenditure on food by
View Solution
