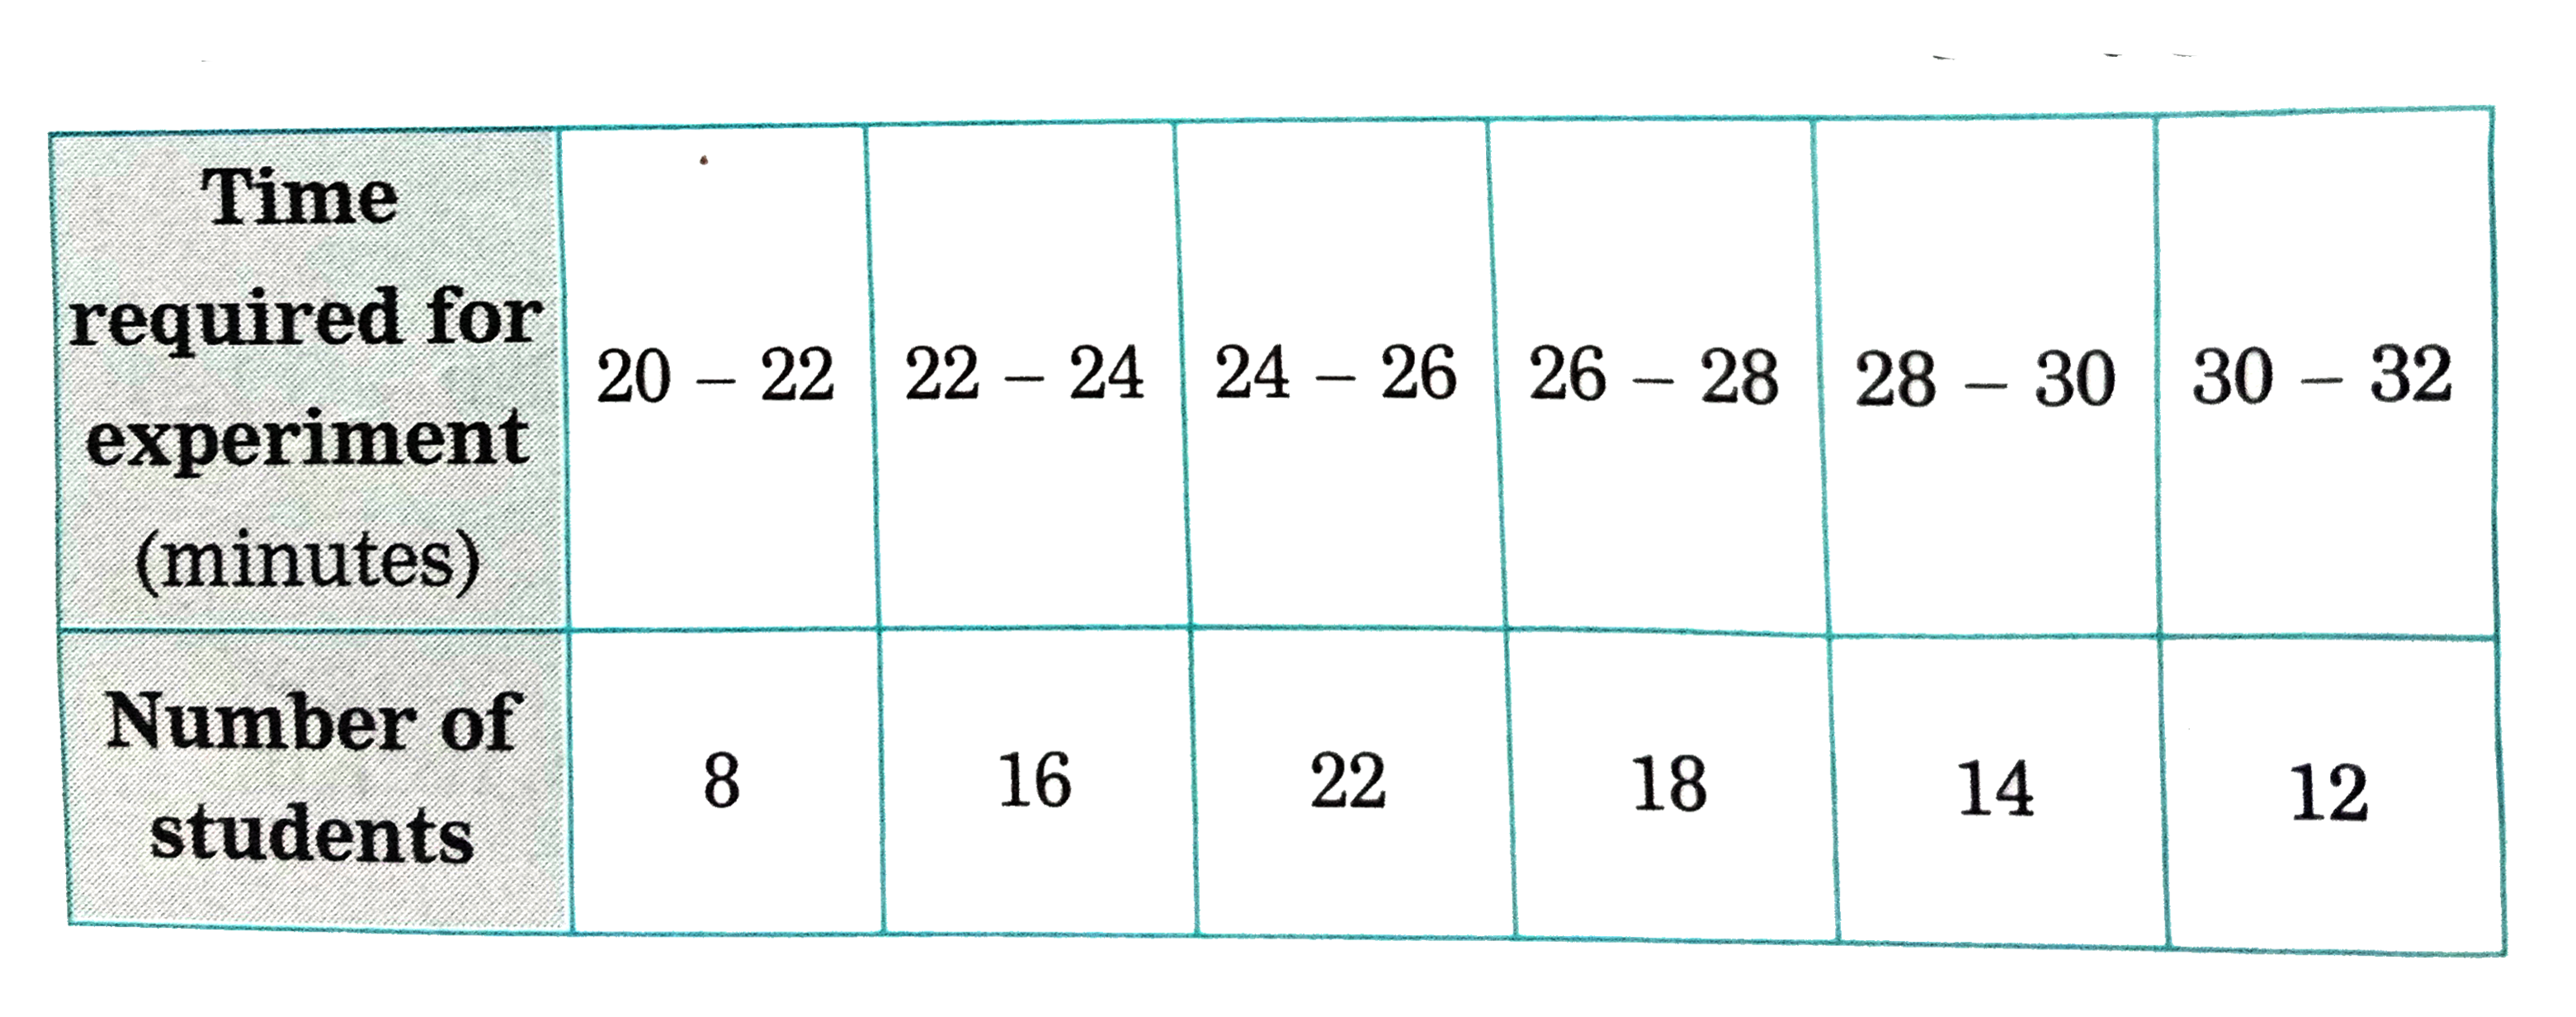
The time required for some students to complete a science experiment and the number of students is shown in the following grouped frequency distribution table. Draw the frequency polygon with the help of histogram using given information :
Time required for experiment ( minutes)20−2222−2424−2626−2828−3030−32Number of students61420161210
Step by step video & image solution for The time required for some students to complete a science experiment and the number of students is shown in the following grouped frequency distribution table. Draw the frequency polygon with the help of histogram using given information : {:("Time required for experiment ( minutes)",20-22,22-24,24-26,26-28,28-30,30-32),("Number of students",6,14,20,16,12,10):} by Maths experts to help you in doubts & scoring excellent marks in Class 10 exams.
Updated on:21/07/2023Topper's Solved these Questions
Similar Questions
The time required for students to do a science experiment and the number of students is shown in the following grouped frequency distribution table. Show information by a histogram and also by a frequency polygon.

View SolutionDraw a histogram representing the following information :
NAV( Rupees)8−1010−1212−1414−1616−18Number of mutual funds2040302515
View SolutionDetermine median value of the following series using graphic method :
Marks0−55−1010−1515−2020−2525−3030−3535−40Number of students 4 6 10 10 22 25 18 5
View SolutionDraw an ogive to represent the following frequency distribution: Class-interval: 0-4 5-9 10-14 15-19 20-24 No. of students: 2 6 10 5 3
View SolutionFind the missing frequency in the following distribution if N=100 and M=30.
Marks0−1010−2020−3030−4040−5050−60Number of Students 10 ? 25 30 ? 10
View SolutionFind the mean deviation about arithmetic mean of the following frequency distribution.Marks 0−10,10−20,20−30,30−40,40−50 No. of Students 5,8,15,16,6
View SolutionCalculate the median from the following series :
Age (Years)55−6050−5545−5040−4535−4030−3525−3020−25Number of Students 7 13 10 15 30 33 28 14
View SolutionDistribution of marks obtained by 100 student of a class is given below . Find out the median marks
Marks051015202530354045Number of Students46155812281435
View SolutionIf the arithmetic mean of the data given below is 28 , find (a) the missing frequency , and (b) the median of the series :
Profit per Retail Shop (inRs.)0−1010−2020−3030−4040−5050−60Number of Retail Shops 12 18 27 f 17 6
View SolutionGiven below are the number of students in 30 class rooms in a school. Construct a frequency distribution table for this data with a class interval of 4.
25 30 24 18 20 24 32 35 22 2022 32 40 28 30 25 26 29 34 1538 28 19 16 15 20 24 30 26 18
View Solution

