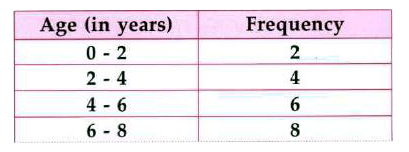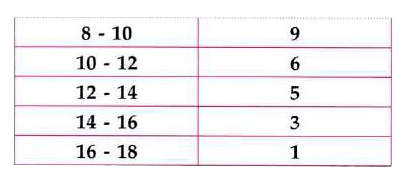
The above data is to be shown by a frequency polygon. The coordinates of the points to show number of students in the class 4−6 are _______ .
A
(4,8)
B
(3,5)
C
(5,8)
D
(8,4)
Video Solution
Text Solution
The correct Answer is:C
|
Answer
Step by step video & image solution for The above data is to be shown by a frequency polygon. The coordinates of the points to show number of students in the class 4-6 are _______ . by Maths experts to help you in doubts & scoring excellent marks in Class 10 exams.
Updated on:21/07/2023Topper's Solved these Questions
Similar Questions
Knowledge Check
No . of trees planted by each student1−34−67−910−12No. of student 7864
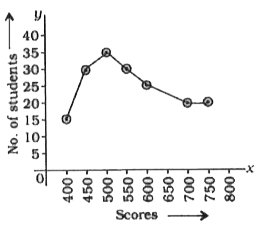
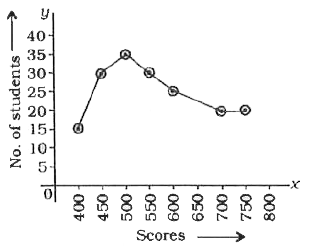
The above data is to be shown by a frequency polygon . The co-ordinates of points to show number of students in the class 4-6 are ___________A(4,8)B(3,5)C(5,8)D(8,4)The adjoining diagram is frequency polygon for the socores of students in a test. What is the total number of students appeared in the test ?
 A180B200C250D150
The adjoining diagram is frequency polygon for the scores of students in a test. What is the total number of students appeared in the test ?
 A180B200C175D150
Show the following data by a frequency polygon.

View SolutionDraw a frequency polygon to represent the following data.

View SolutionConstruct a frequency polygon for the following data.


View SolutionPresent the following data in the form of a frequency polygon :

View SolutionDraw the frequency polygon to represent the following data.

View Solution


