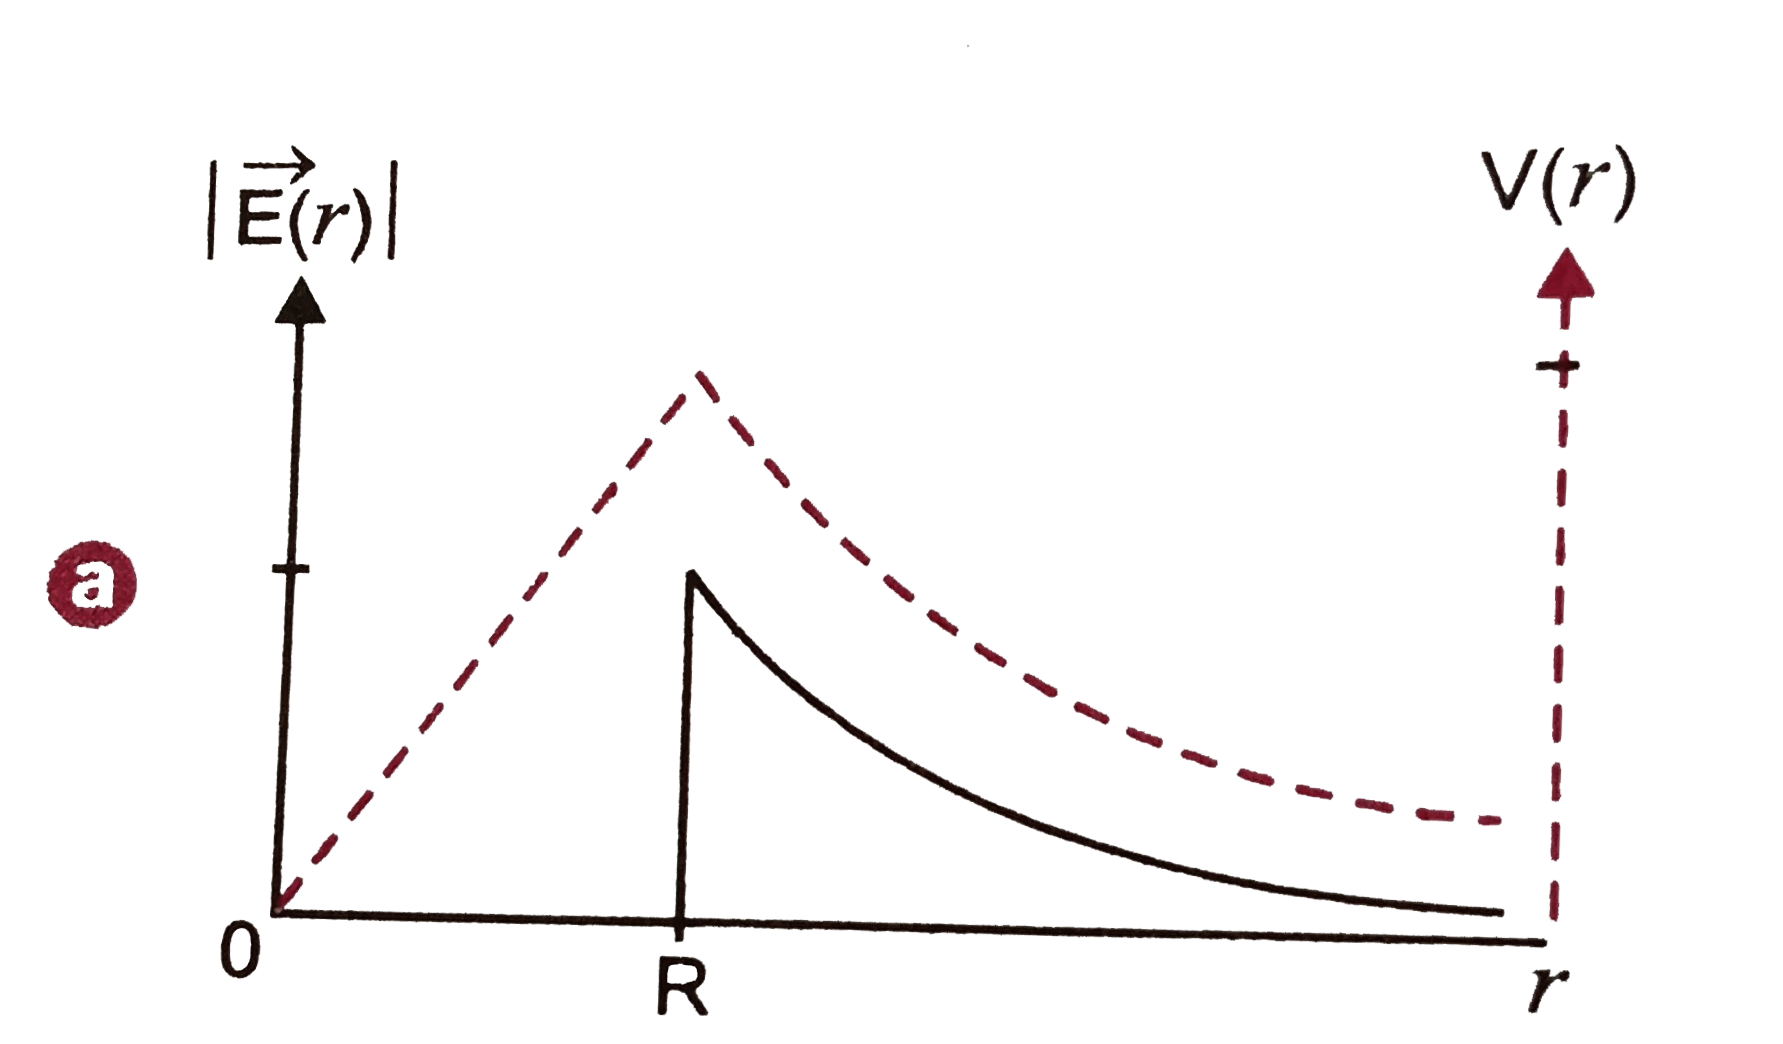
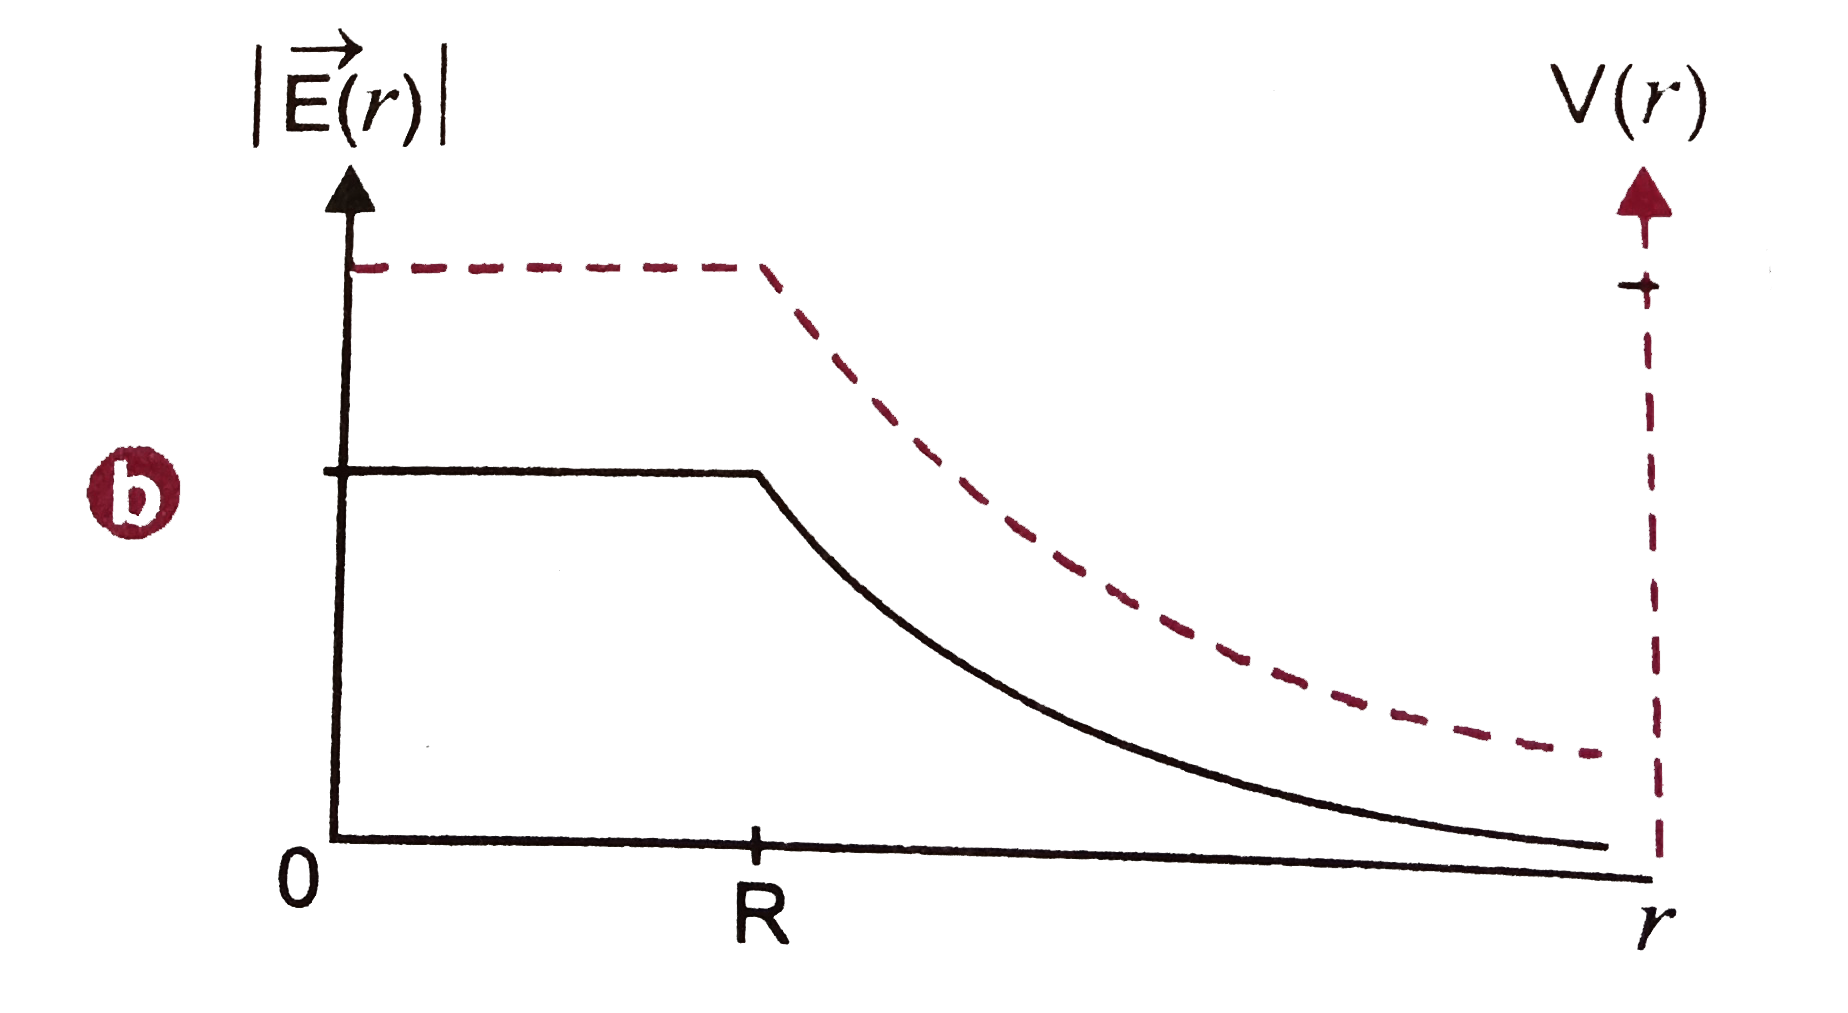
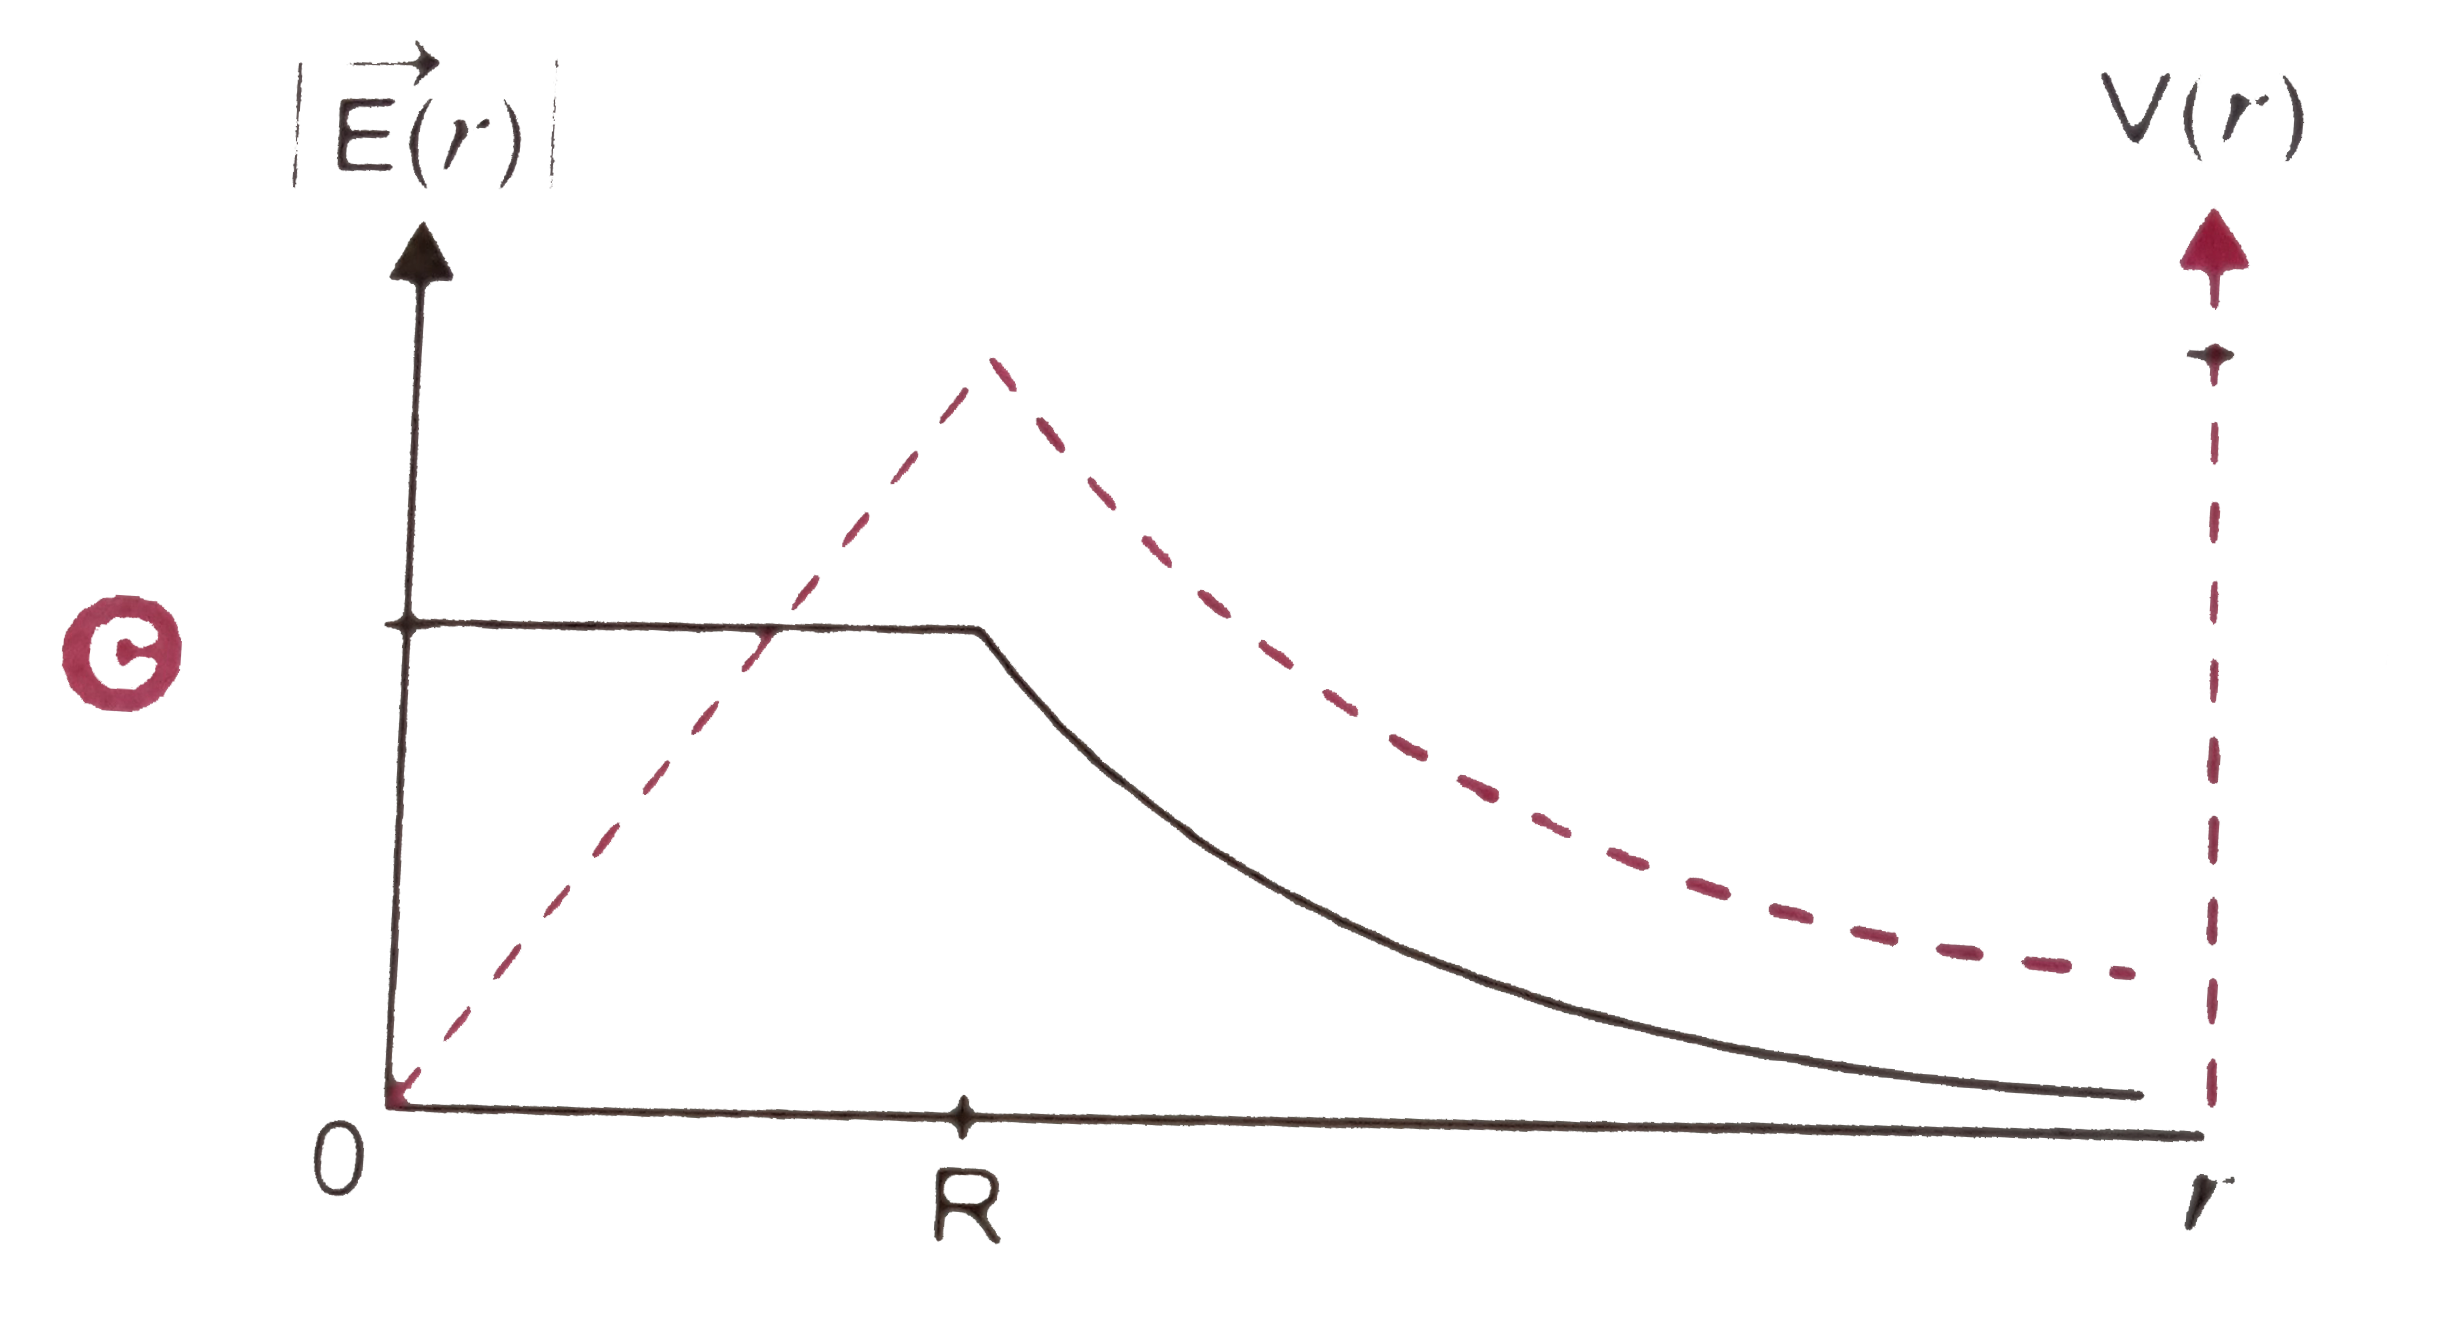
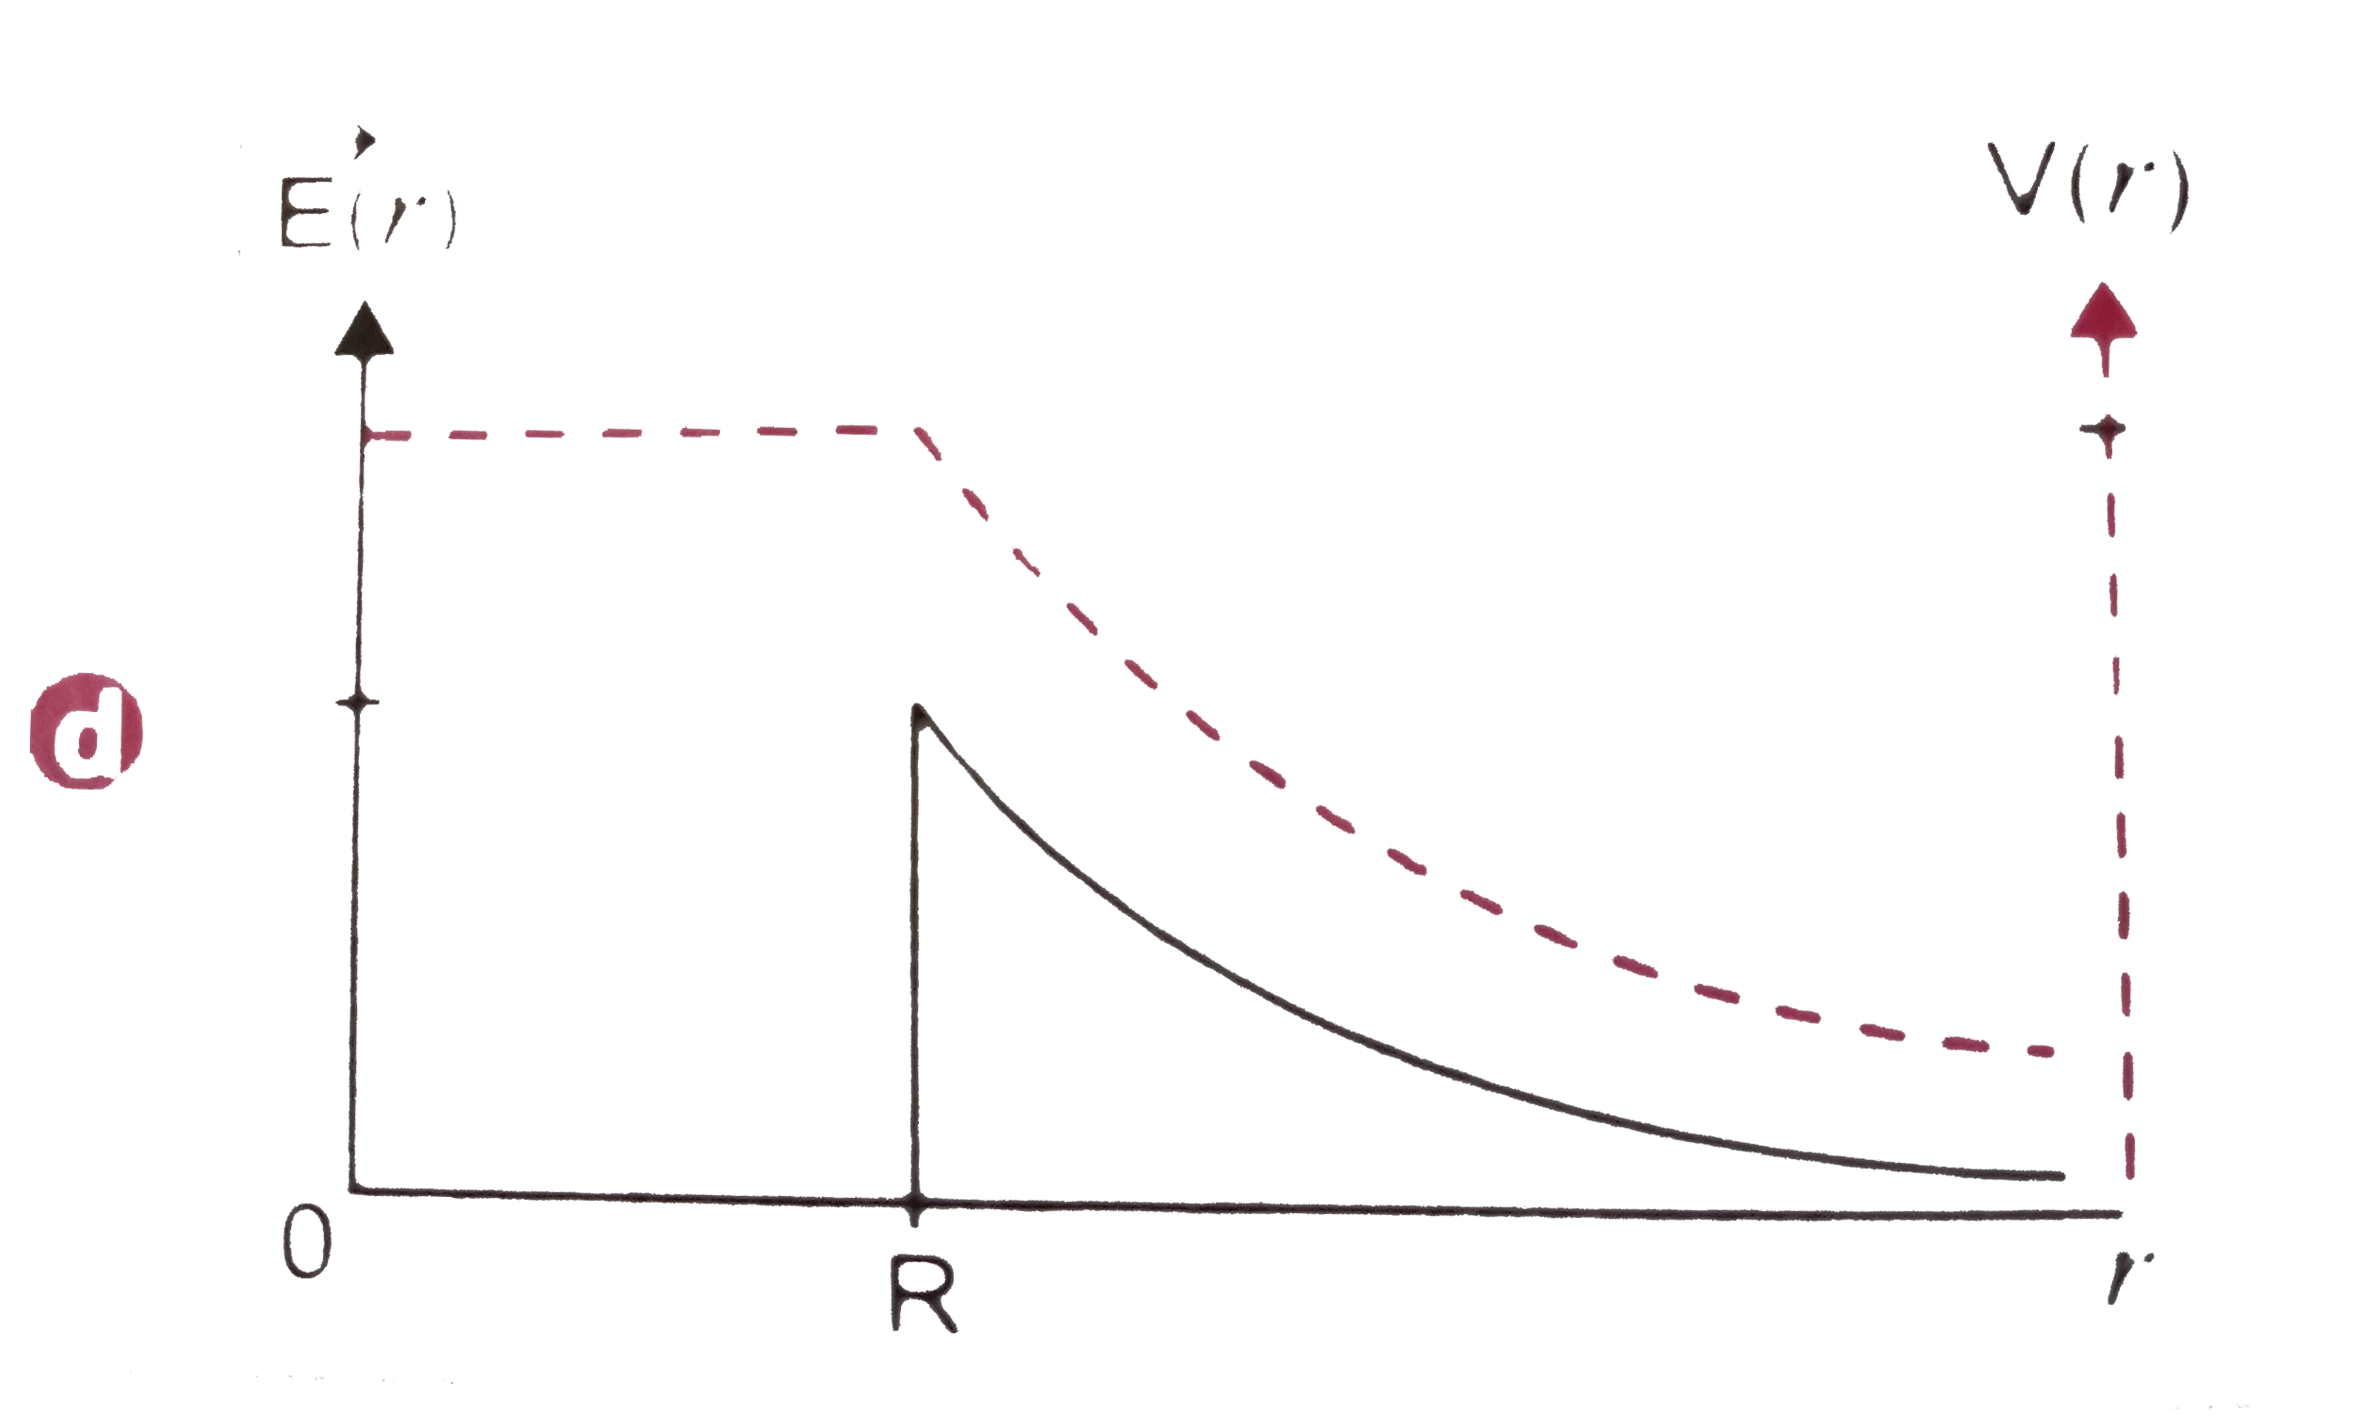
Conisder a thin spherical shell of radius R with centre at the origin, carrying uniform poistive surface charge denisty. The variation of the magnitude of the electric field ∣∣→E(r)∣∣ and the electric potential V(r) with the distance r from the centre, is best represented by which graph?
The correct Answer is:D
As is known from theory,inside a uniform spherical surface charge distibutiaon, electric field, →E=0 and electric potential V = constant.
At points outside the charge distribution,
E∝1r2 and V∝1r
Choice (d) is correct.
Topper's Solved these Questions
- ELECTROSTATICSBOOK - PRADEEPCHAPTER - ELECTROSTATICSEXERCISE - FILL IN THE BLANKS
8 Videos
- ELECTROSTATICSBOOK - PRADEEPCHAPTER - ELECTROSTATICSEXERCISE - PROBLEMS FOR PRACTICE
8 Videos
- ELECTROSTATICSBOOK - PRADEEPCHAPTER - ELECTROSTATICSEXERCISE - VALUE BASED QUESTIONS
7 Videos
- ELECTRONIC DEVICESBOOK - PRADEEPCHAPTER - ELECTRONIC DEVICESEXERCISE - Fill in the Blanks
1 Videos
- MAGNETIC EFFECT OF CURRENT AND MAGNETISMBOOK - PRADEEPCHAPTER - MAGNETIC EFFECT OF CURRENT AND MAGNETISMEXERCISE - Competition Focus (Multiple Choice Questions)
2 Videos
Similar Questions
Draw a graph of electric field E(r) with distance r from the centre of the shell for 0≤r≤0 .
View SolutionAn isolated solid metal sphere of radius R is given an electric charge. The variation of the intensity of the electric field with the distance r from the centre of the sphere is best shown by
View Solution
Knowledge Check
Consider a thin spherical shell of radius R with its centre at the origin, carrying uniform positive surface charge density. The variation of the magnitude of the electric field ∣∣→E(r)∣∣ and the electric potential V (r ) with the distance r from the center is best represented by which graph, Fig.
Altimg src="https://d10lpgp6xz60nq.cloudfront.net/physics_images/PR_XII_V01_C01_E01_319_O01.png" width="30%"gtBltimg src="https://d10lpgp6xz60nq.cloudfront.net/physics_images/PR_XII_V01_C01_E01_319_O02.png" width="30%"gtCltimg src="https://d10lpgp6xz60nq.cloudfront.net/physics_images/PR_XII_V01_C01_E01_319_O03.png" width="30%"gtDltimg src="https://d10lpgp6xz60nq.cloudfront.net/physics_images/PR_XII_V01_C01_E01_319_O04.png" width="30%"gtA thin spherical shell of radius R has charge Q spread uniformly over its surface. Which of the following graphs most closely represents the electric field E(r) produced by the shell in the range 0≤r<∞, where r is the distance from the centre of the shell?
A B
B C
C D
D
The dependence of electric potential V on the distance 'r' from the centre of a charged spherical shell is shown by :
A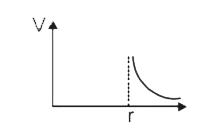 B
B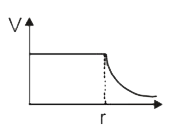 C
C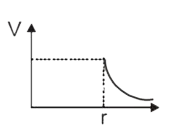 D
D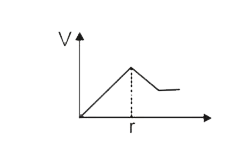
The volume charge density of a sphere carrying charge Q and of radius R is proportional to the square of the distance from the centre. The ratio of the magnitude of the electric field at a distance 2R from the centre to that at a distance of R2 from the centre is
View SolutionConsider a thin spherical shell of radius R consisting of uniform surface charge density σ. The electric field at a point of distance x from its centre and outside the shell is
View SolutionA thin spherical shell of radius R has charge Q spread uniformly over its surface. Which of the following graphs most closely represents the electric field E(r) produced by the shell in the range 0≤r<∞, where r is the distance from the centre of the shell?
View SolutionThe electric field due to uniformly charged sphere of radius R as a function of the distance from its centre is represented graphically by
View SolutionA non-conducting solid sphere of radius R is uniformly charged. The magnitude of the electric filed due to the sphere at a distance r from its centre
View Solution
