p−T curve for a cyclic process is as shown
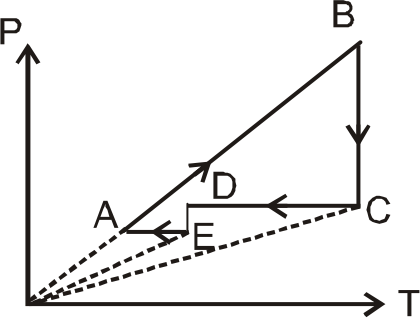
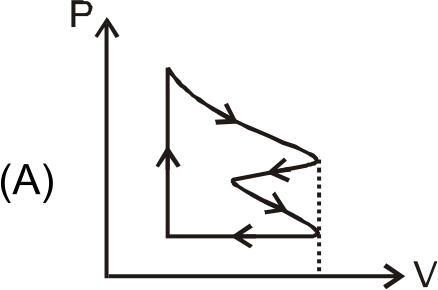
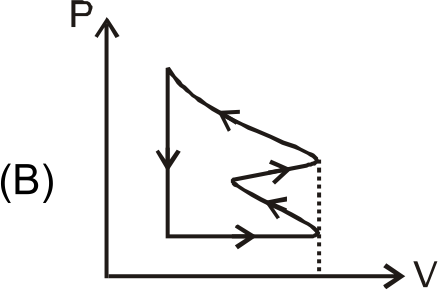
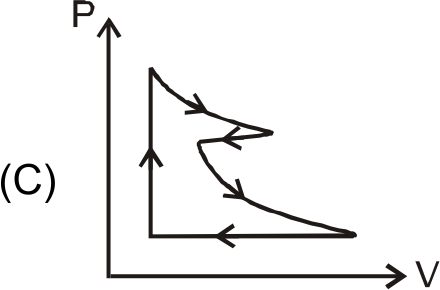
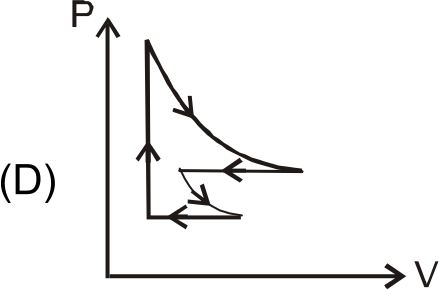
P−V graph for this process will be:
A
B
C
D
Video Solution
Text Solution

PV=nRT
⇒ Slope of the joining origin to that point ∝1V
as the slope of line OE is greater than the slope of line OC. So, volume at 'E' is less than that at 'C'. So, ans is (D)
|
Topper's Solved these Questions
Similar Questions
Knowledge Check
The slope of P-V graph for isochoric process is
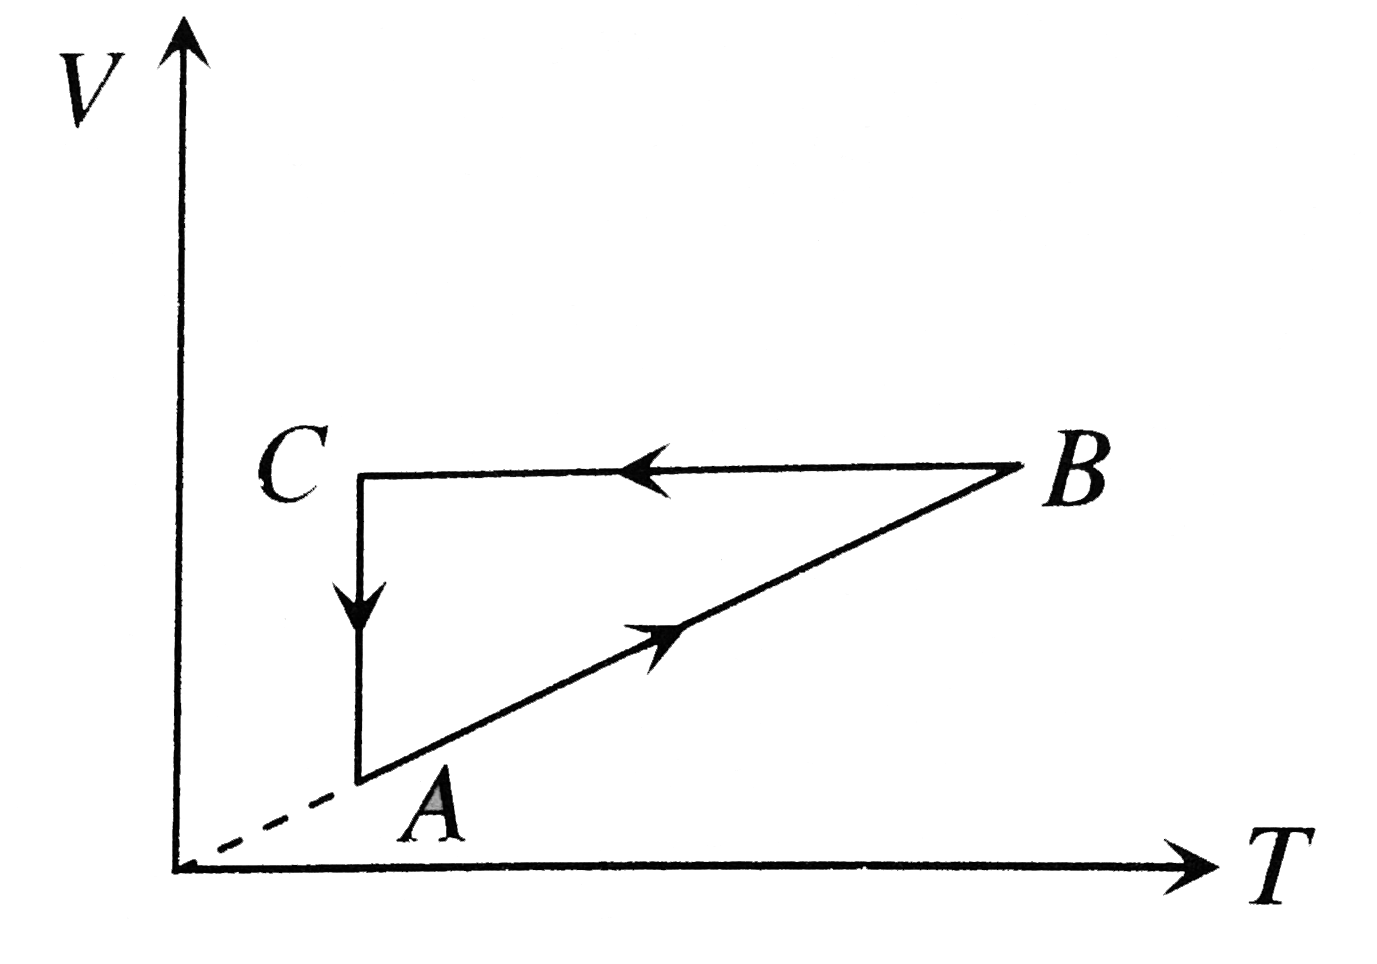
AZeroBInfiniteCOneDTwoA cyclic process ABCA is shown in the V−T diagram process on the P−V
 A
A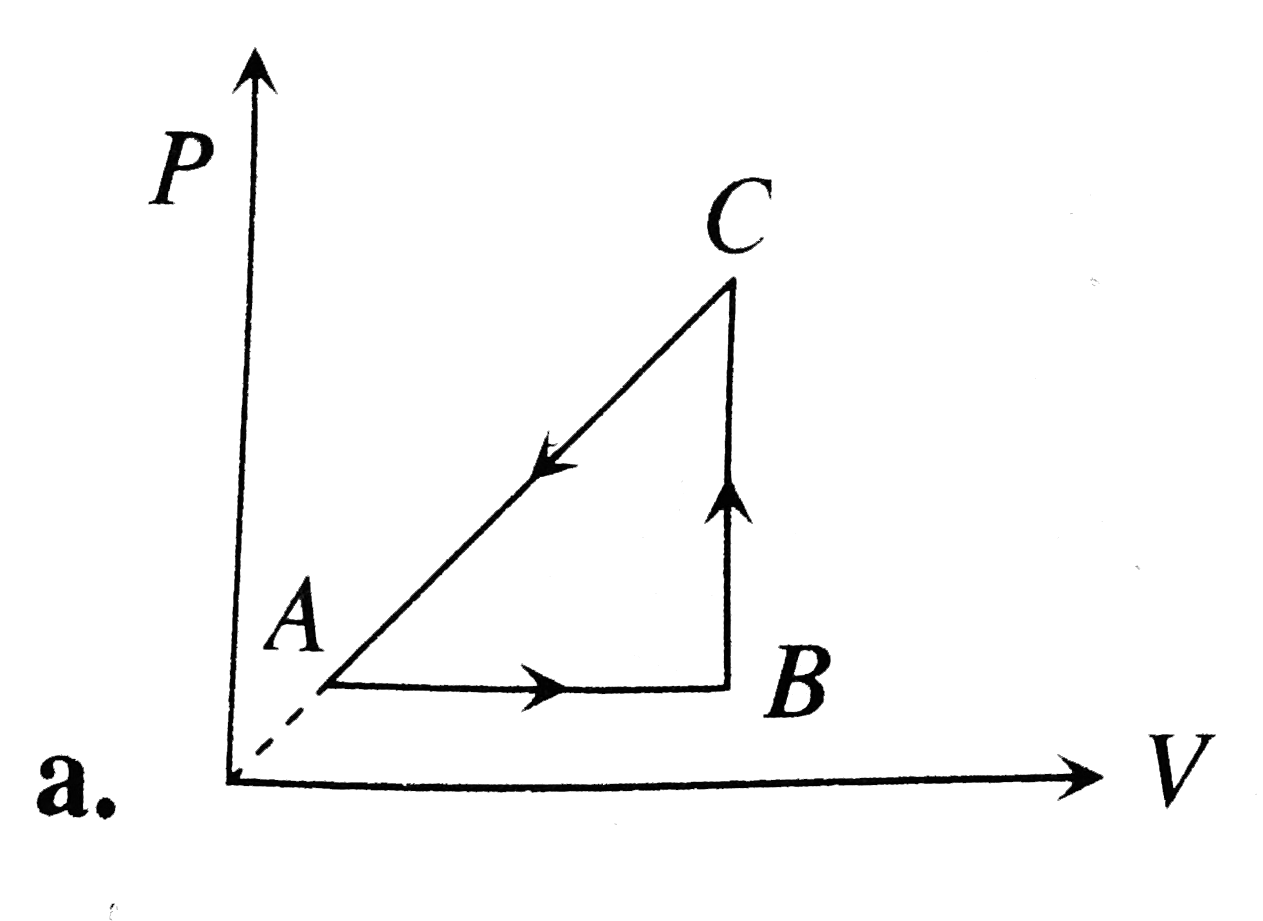 B
B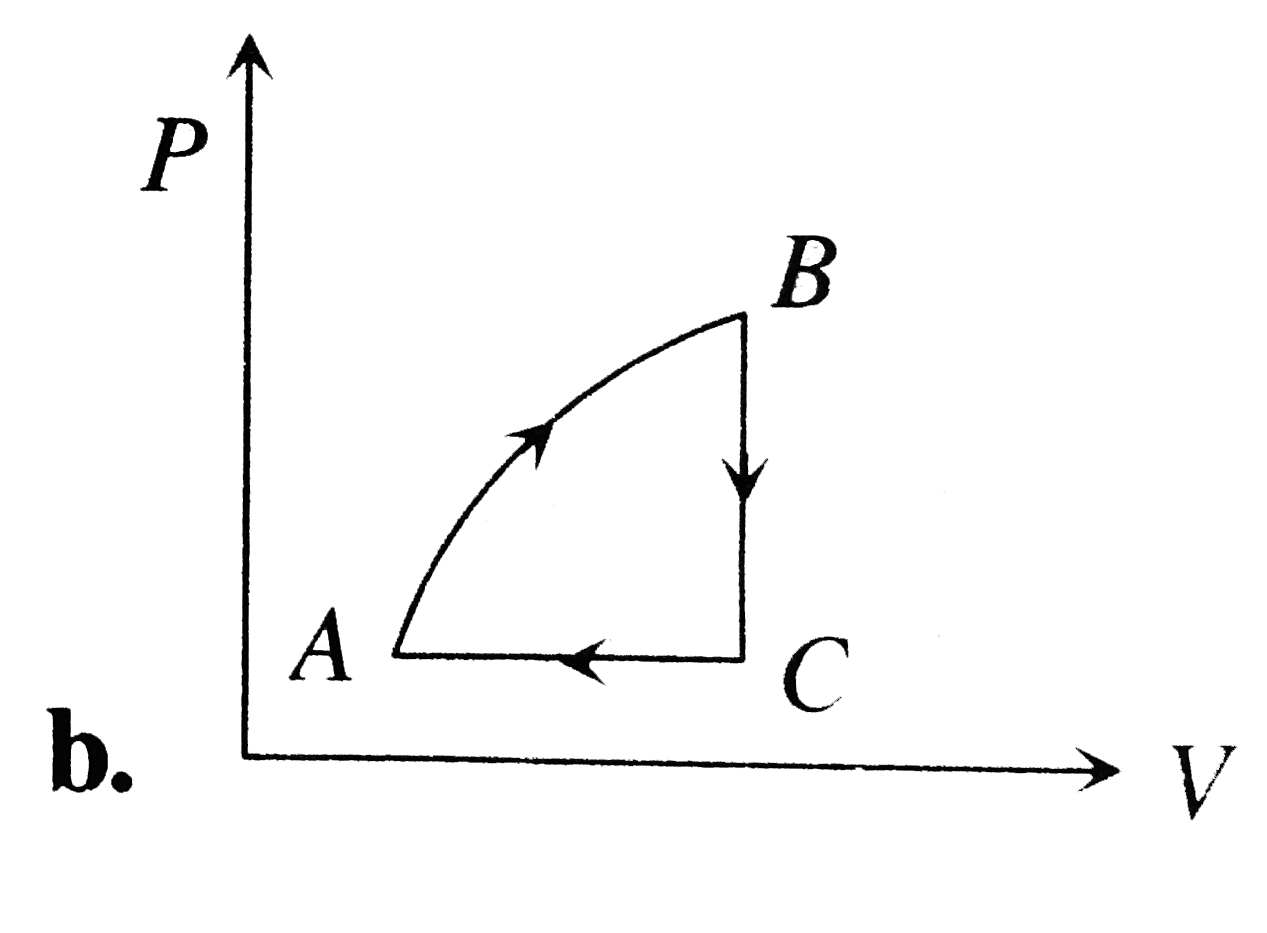 C
C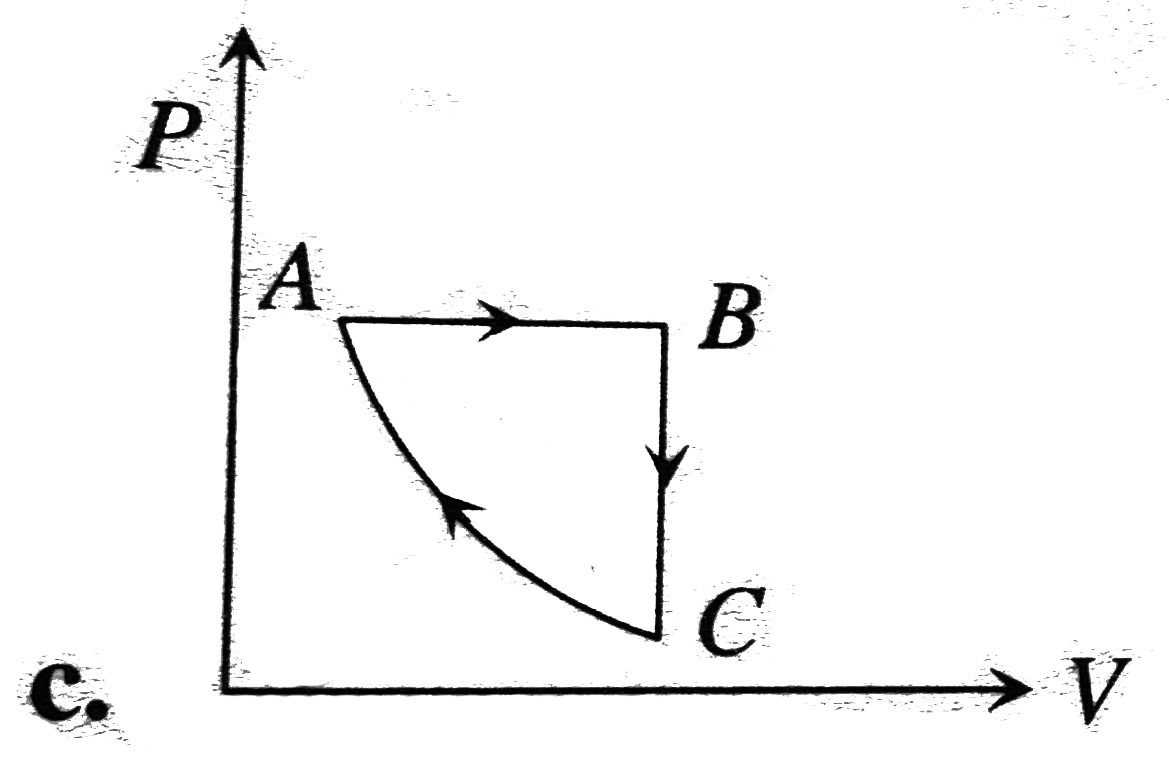 D
D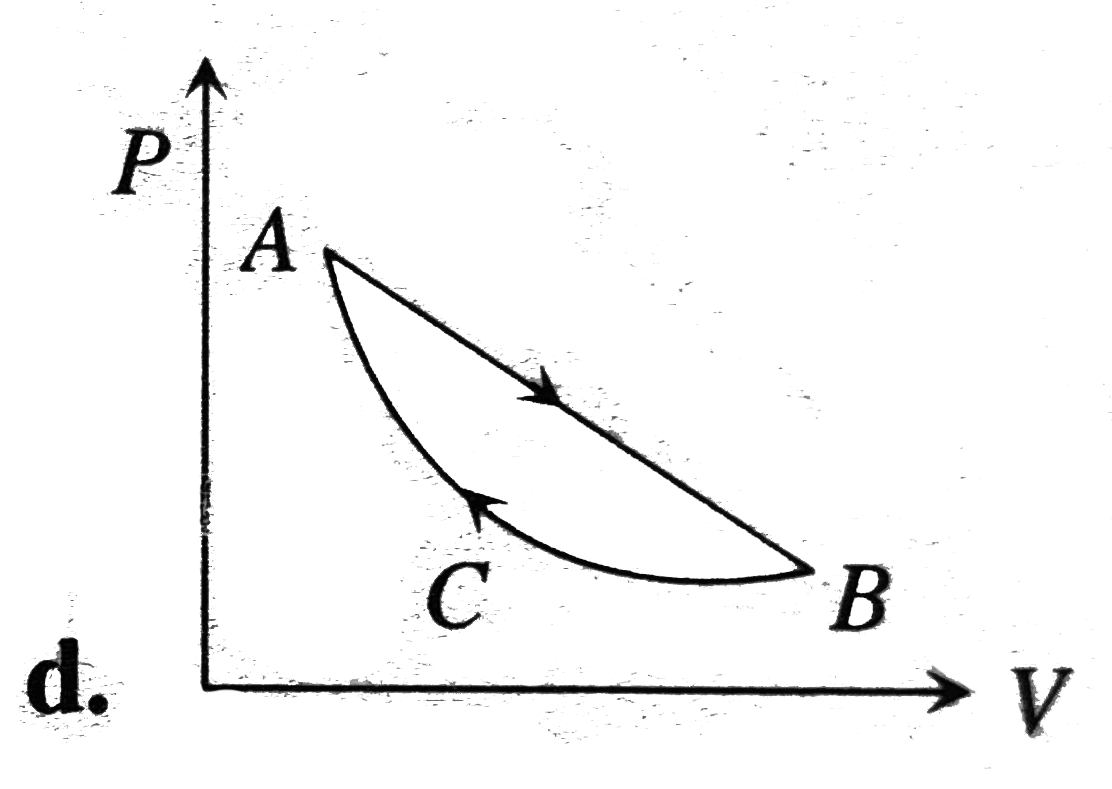
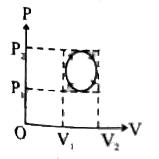
In a cyclic process shown on the P−V diargam the magnitude of the work done is :
 Aπ(P2−P12)2Bπ(V2−V12)2Cπ4(P2−P1)(V2−V1)Dπ(P2V2−P1V1)
P-T curve of a cyclic process is shown. Find out the works done by the gas in the given proces if number of moles of the gas are n.
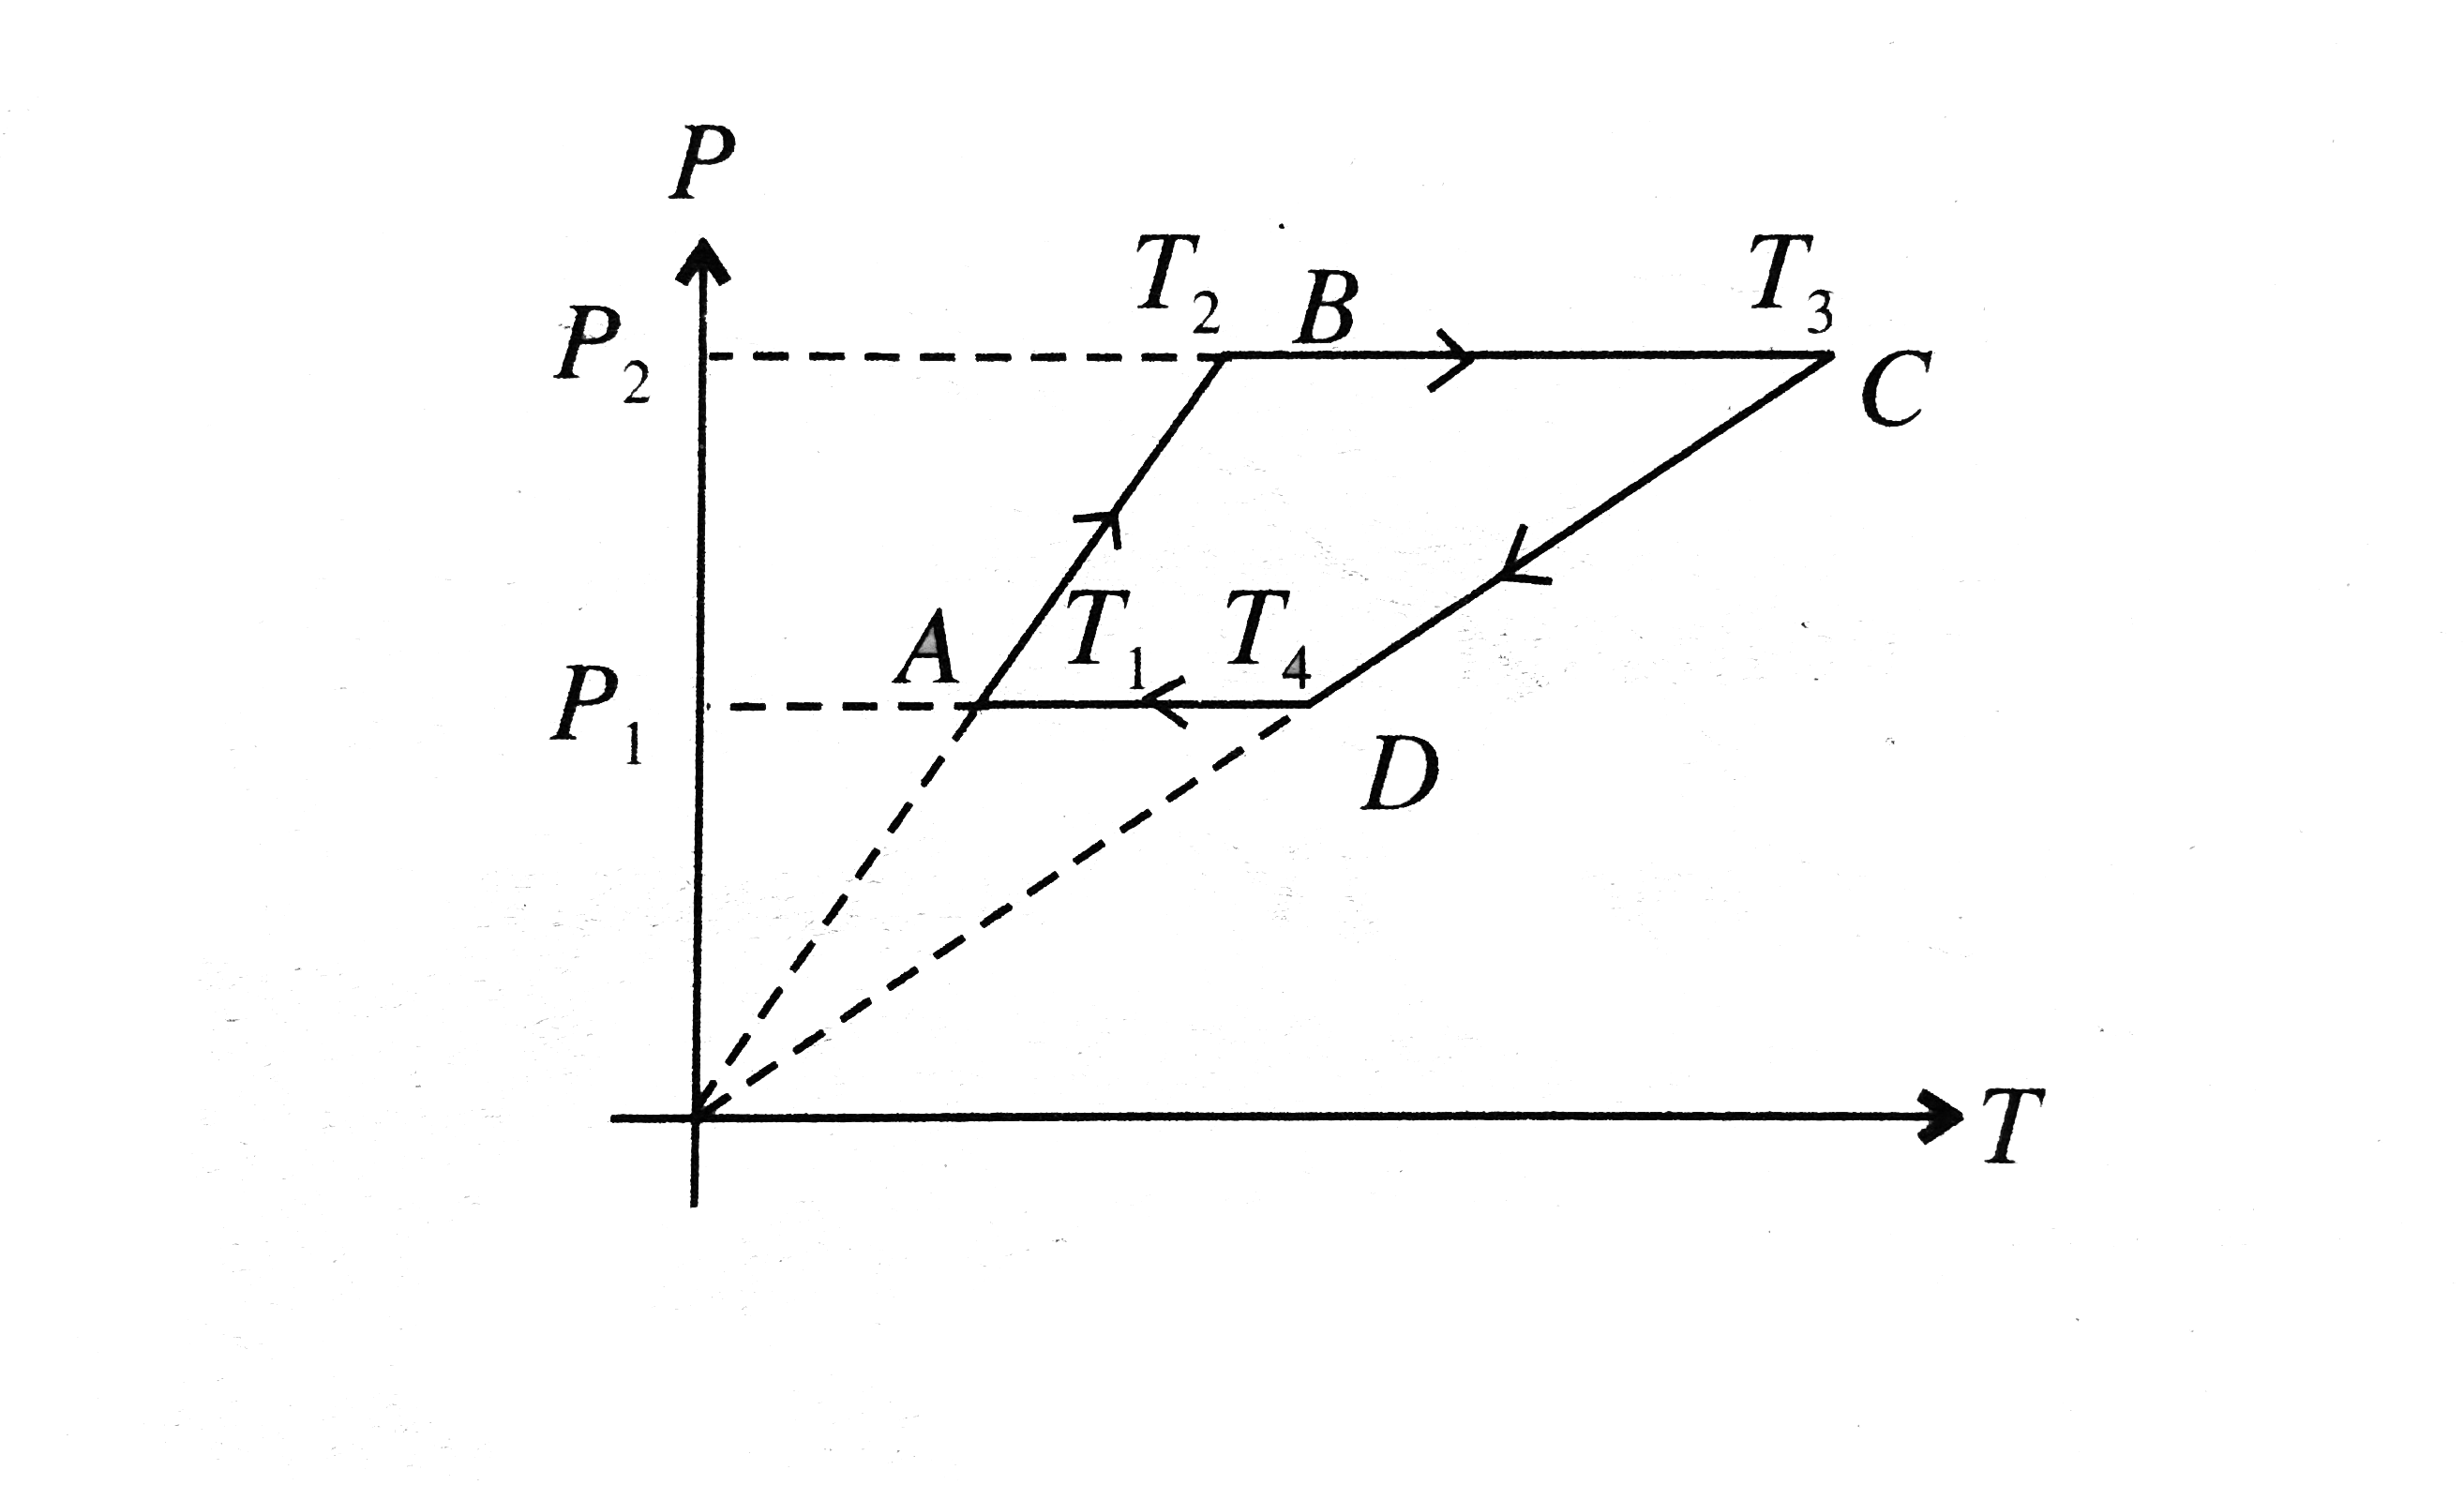
View SolutionDraw at P-T curve for isobaric process.
View SolutionP-V graph of a cyclic process is as shown in the figure.Then its correct T-V curve would be
View SolutionP – V graph for a cyclic process is shown in figure . Work done is given by
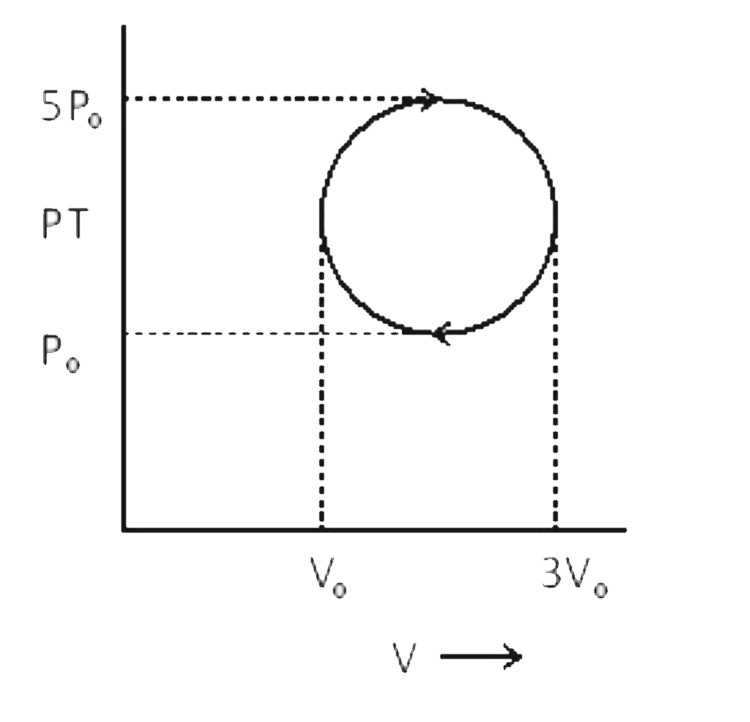
View SolutionIn the cyclic process shown on the P-V diagram the magnitude of the work done is :
View Solution

