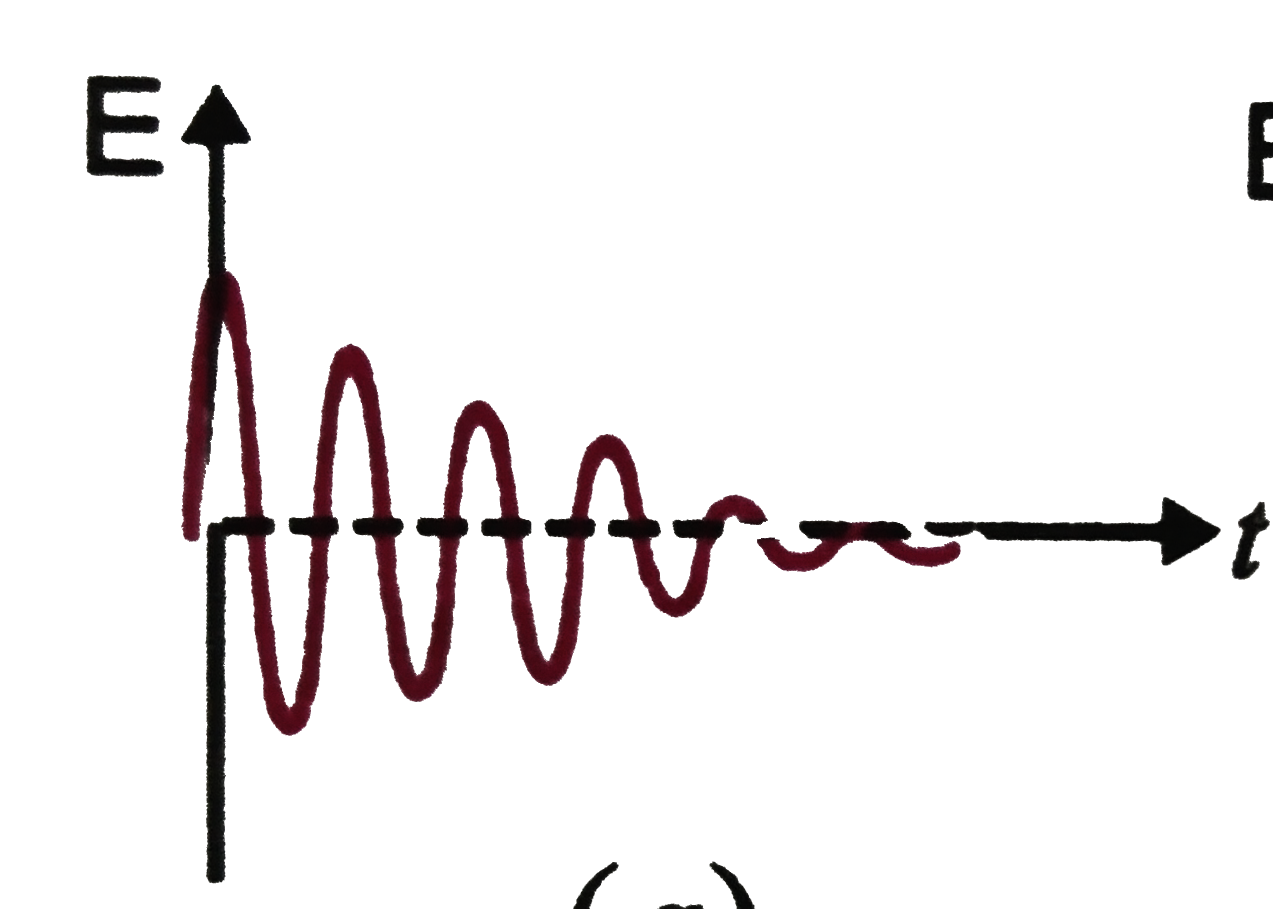
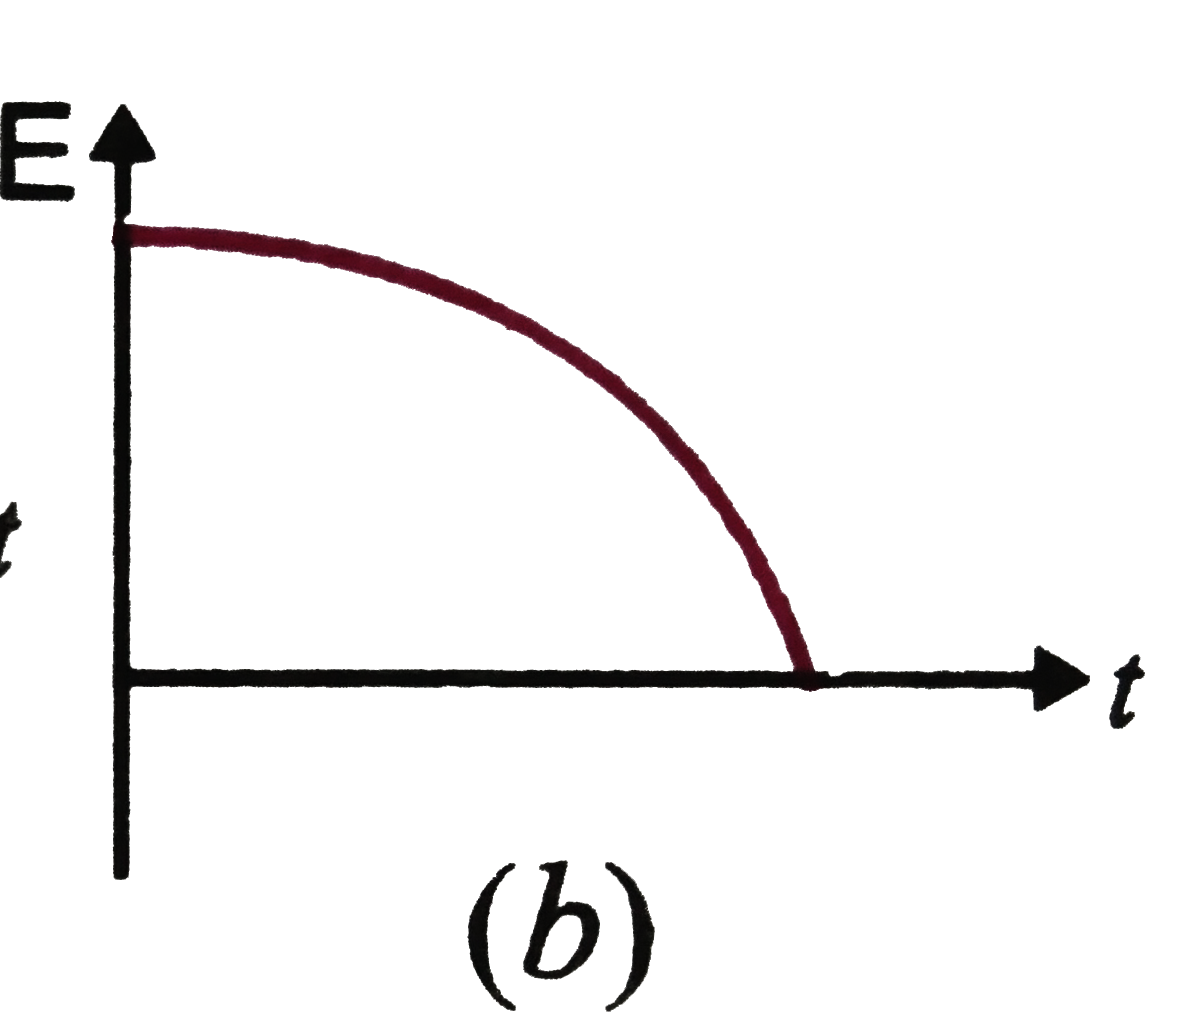
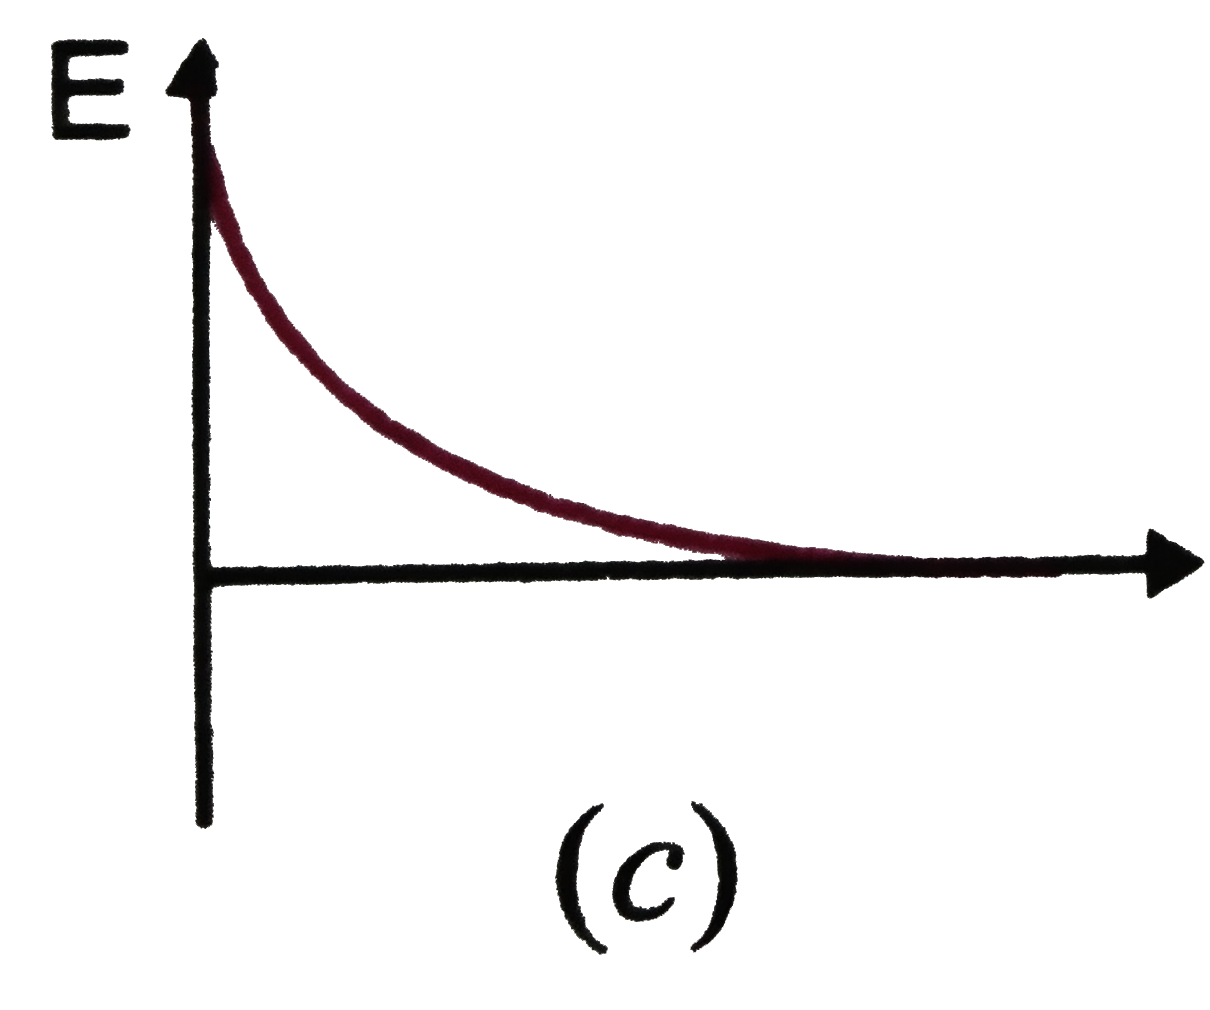
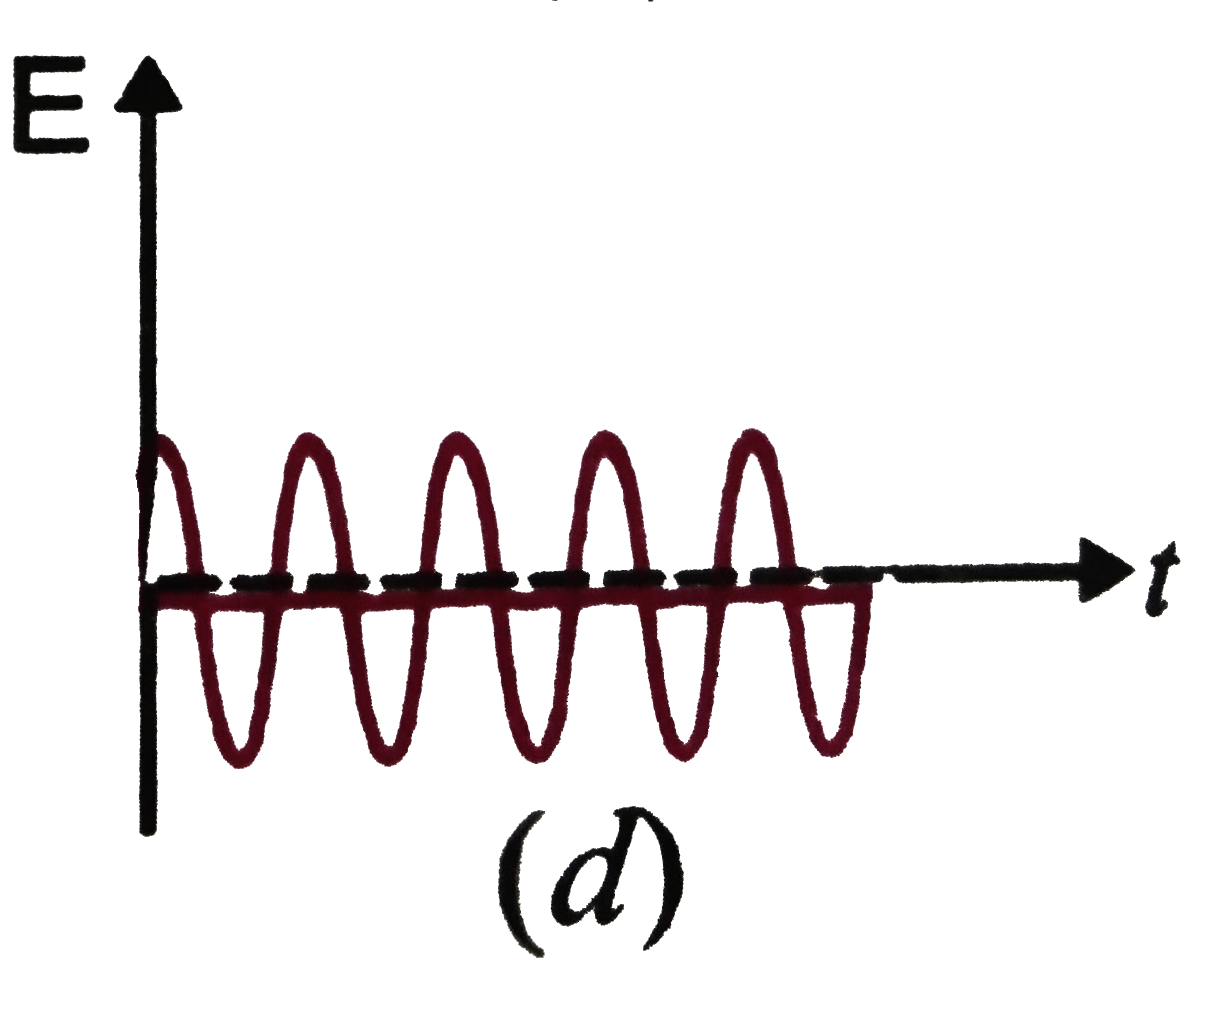
Which of the diagram shown in figures respresents variation of total mechanical energy of a pendulam oscillation in air as function of time?
The correct Answer is:C
When a pendulum oscillates in air, it loses energy continuously in overcoming resistance due to air, Therefore, total mechanical energy of the pendulum decreases continuously with time. The variation of total mechanical energy E with time t is shown correctly by curve (c).
Topper's Solved these Questions
- WORK, ENERGY AND POWERBook:PRADEEPChapter:WORK, ENERGY AND POWERExercise:JEE (Main and Advanced)
Explore 82 Videos
- WORK, ENERGY AND POWERBook:PRADEEPChapter:WORK, ENERGY AND POWERExercise:Comprehension
Explore 9 Videos
- WORK, ENERGY AND POWERBook:PRADEEPChapter:WORK, ENERGY AND POWERExercise:Problems For Practice
Explore 76 Videos
- THERMODYNAMICSBook:PRADEEPChapter:THERMODYNAMICSExercise:Assertion- Reason Type Questions
Explore 19 Videos
Similar Questions
Knowledge Check
Which of the diagram shown in figures respresents variation of total mechanical energy of a pendulam oscillation in air as function of time?
A B
B C
C D
D
Which of the diagrams shown in figure. Most closely shows the variation in kinetic energy of the earth as it moves once around the sun in its elliptical orbit ?
A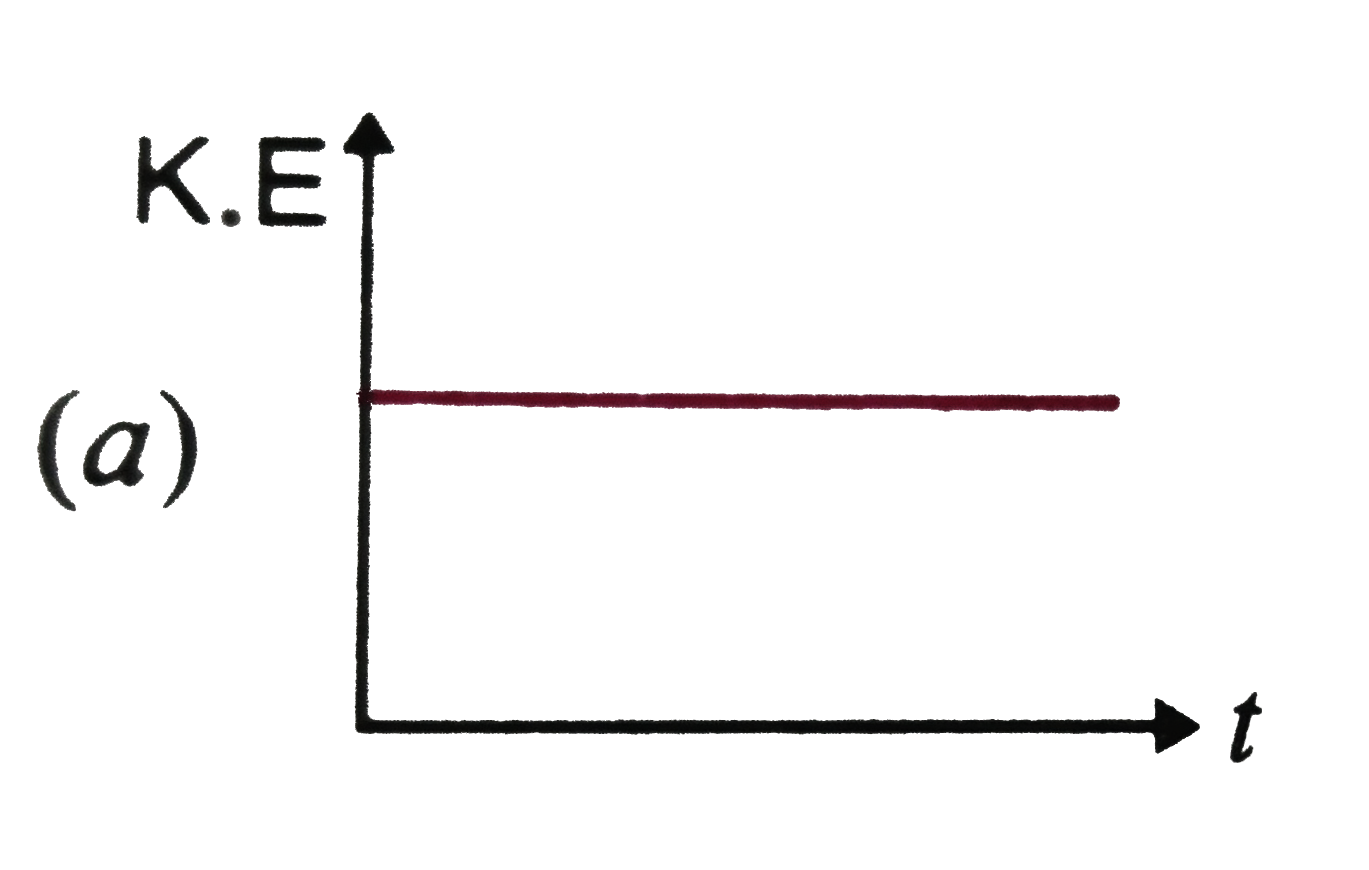 B
B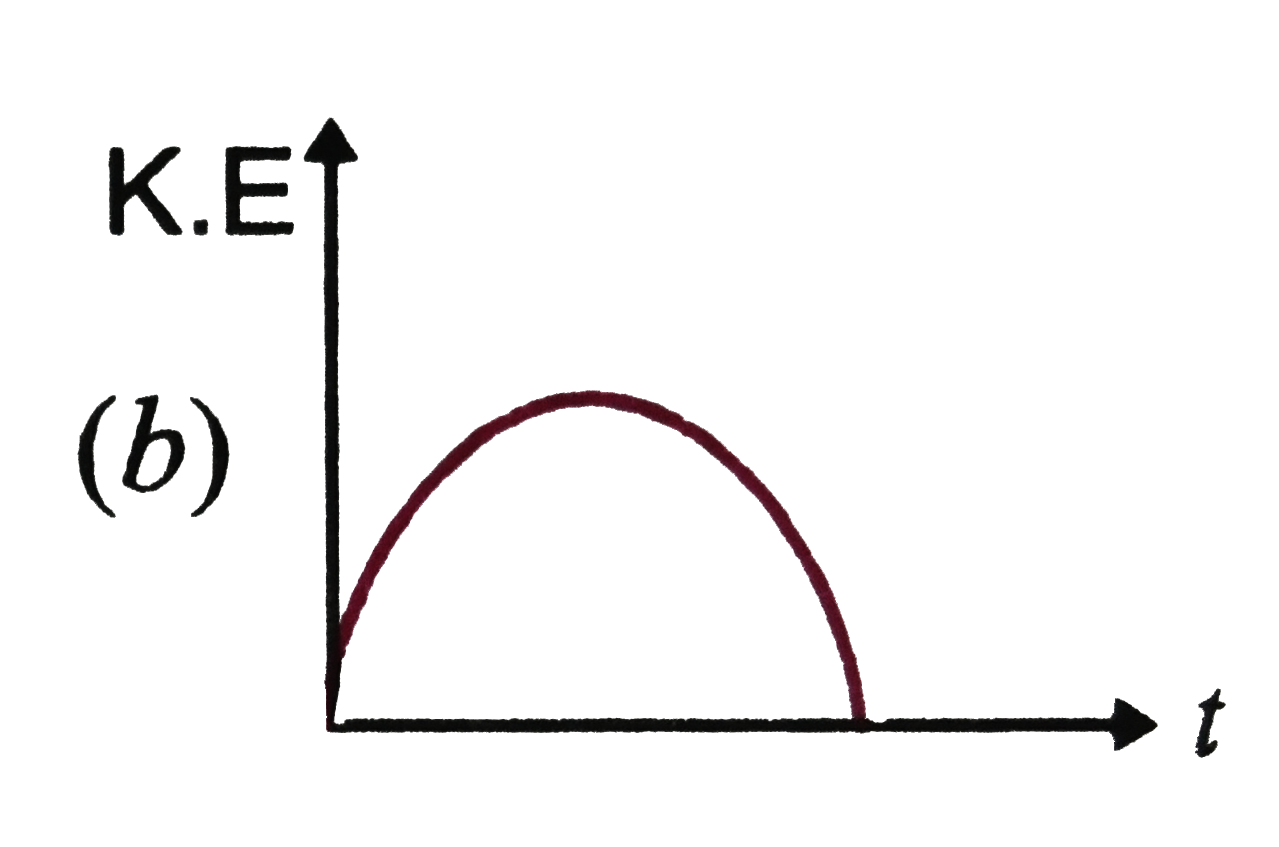 C
C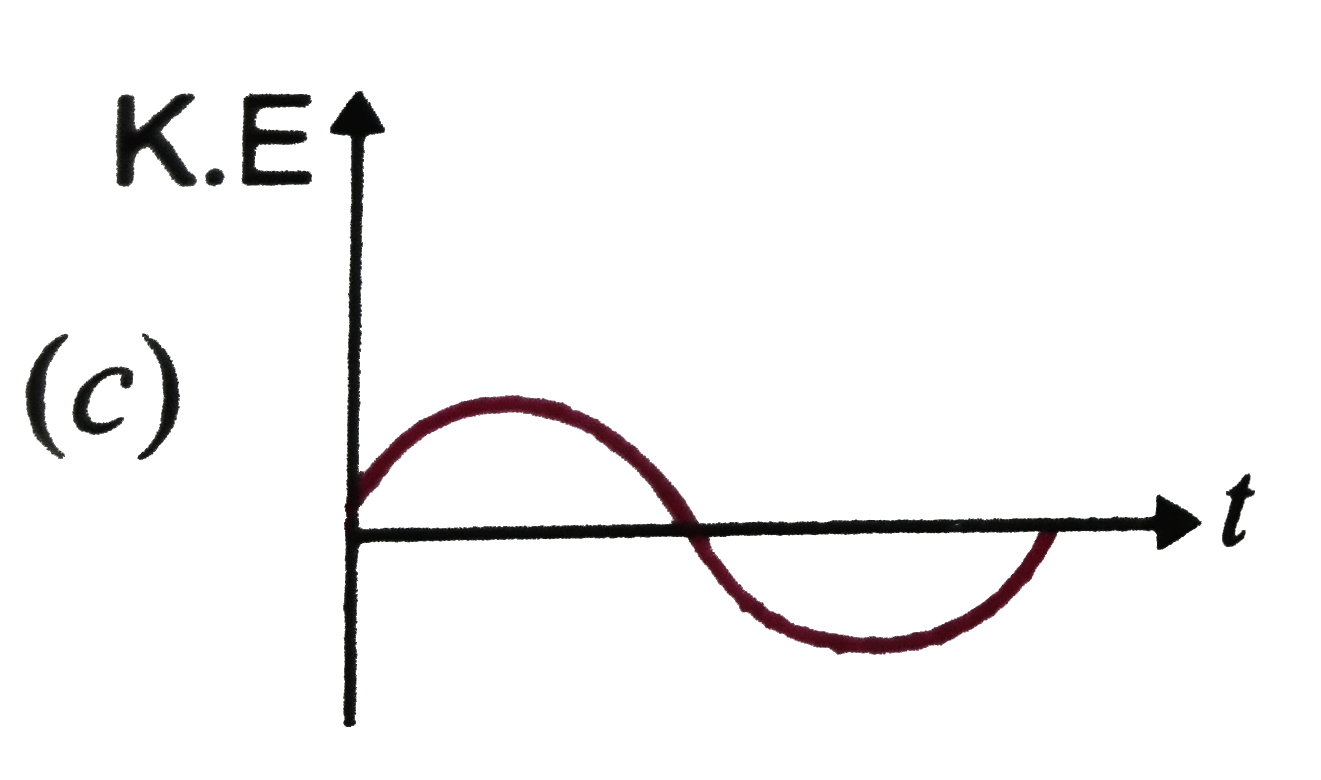 D
D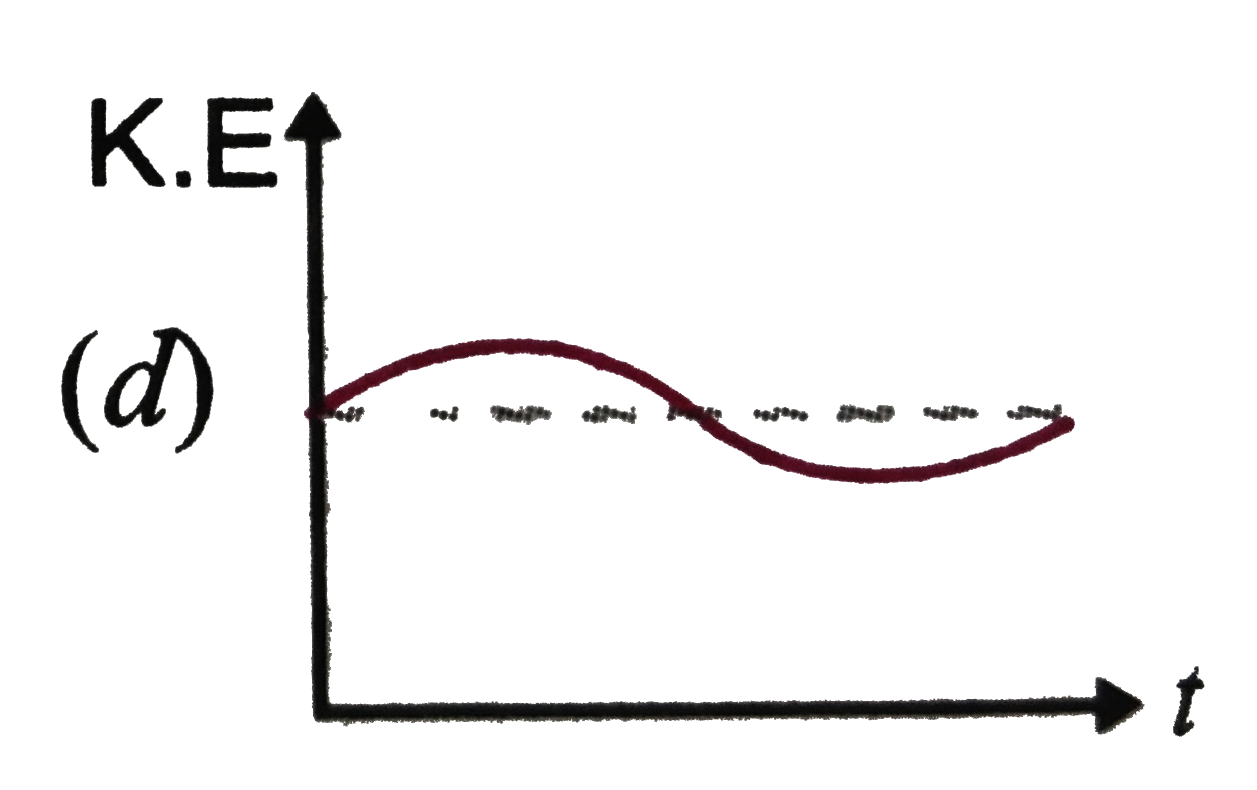
Which of the energy band diagrams shown in the figure corresponds to that of a semiconductor?
A B
B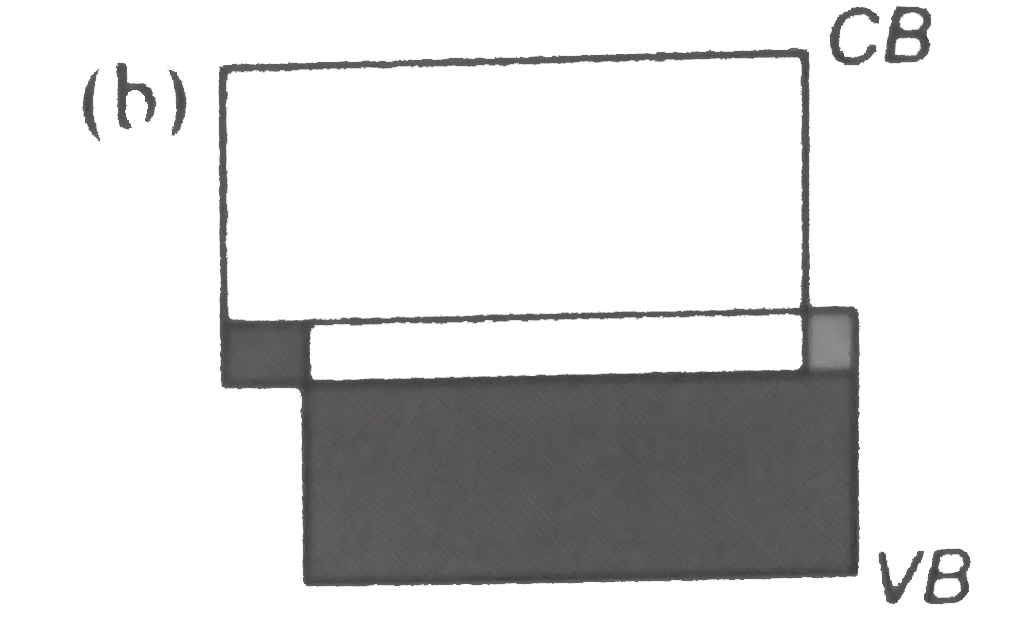 C
C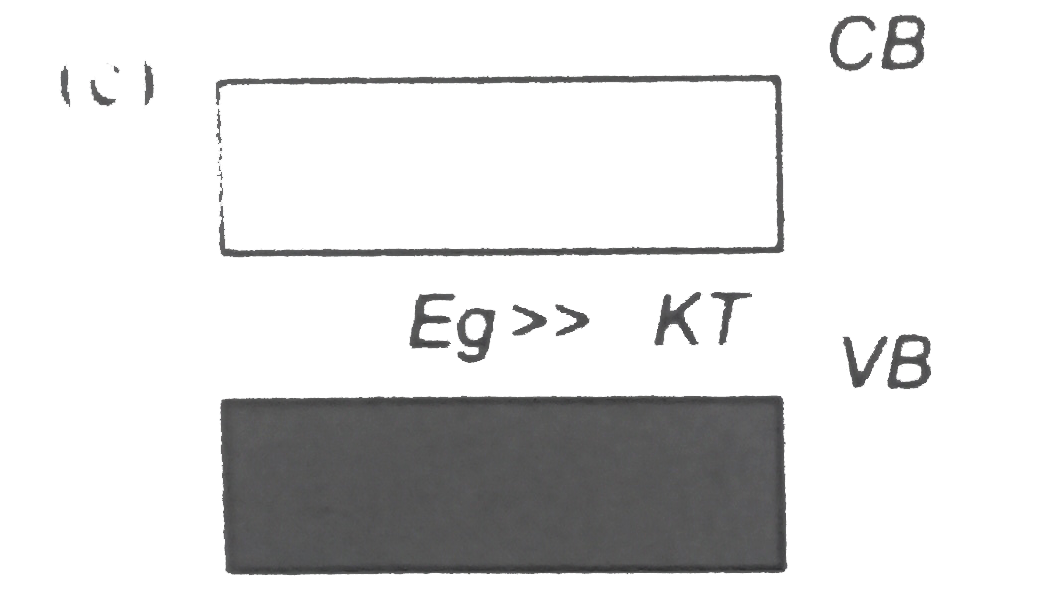 D
D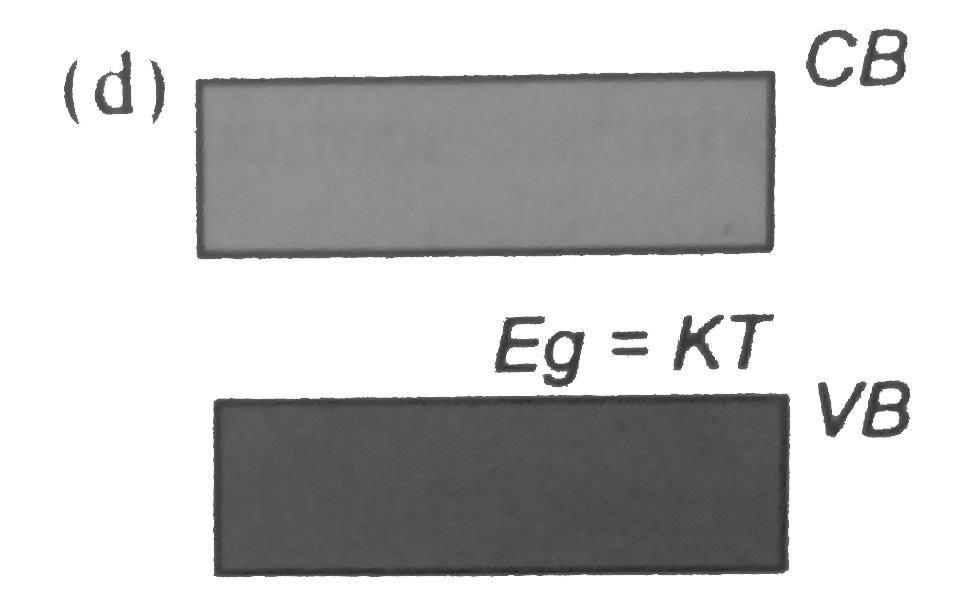
In the shown figure shown
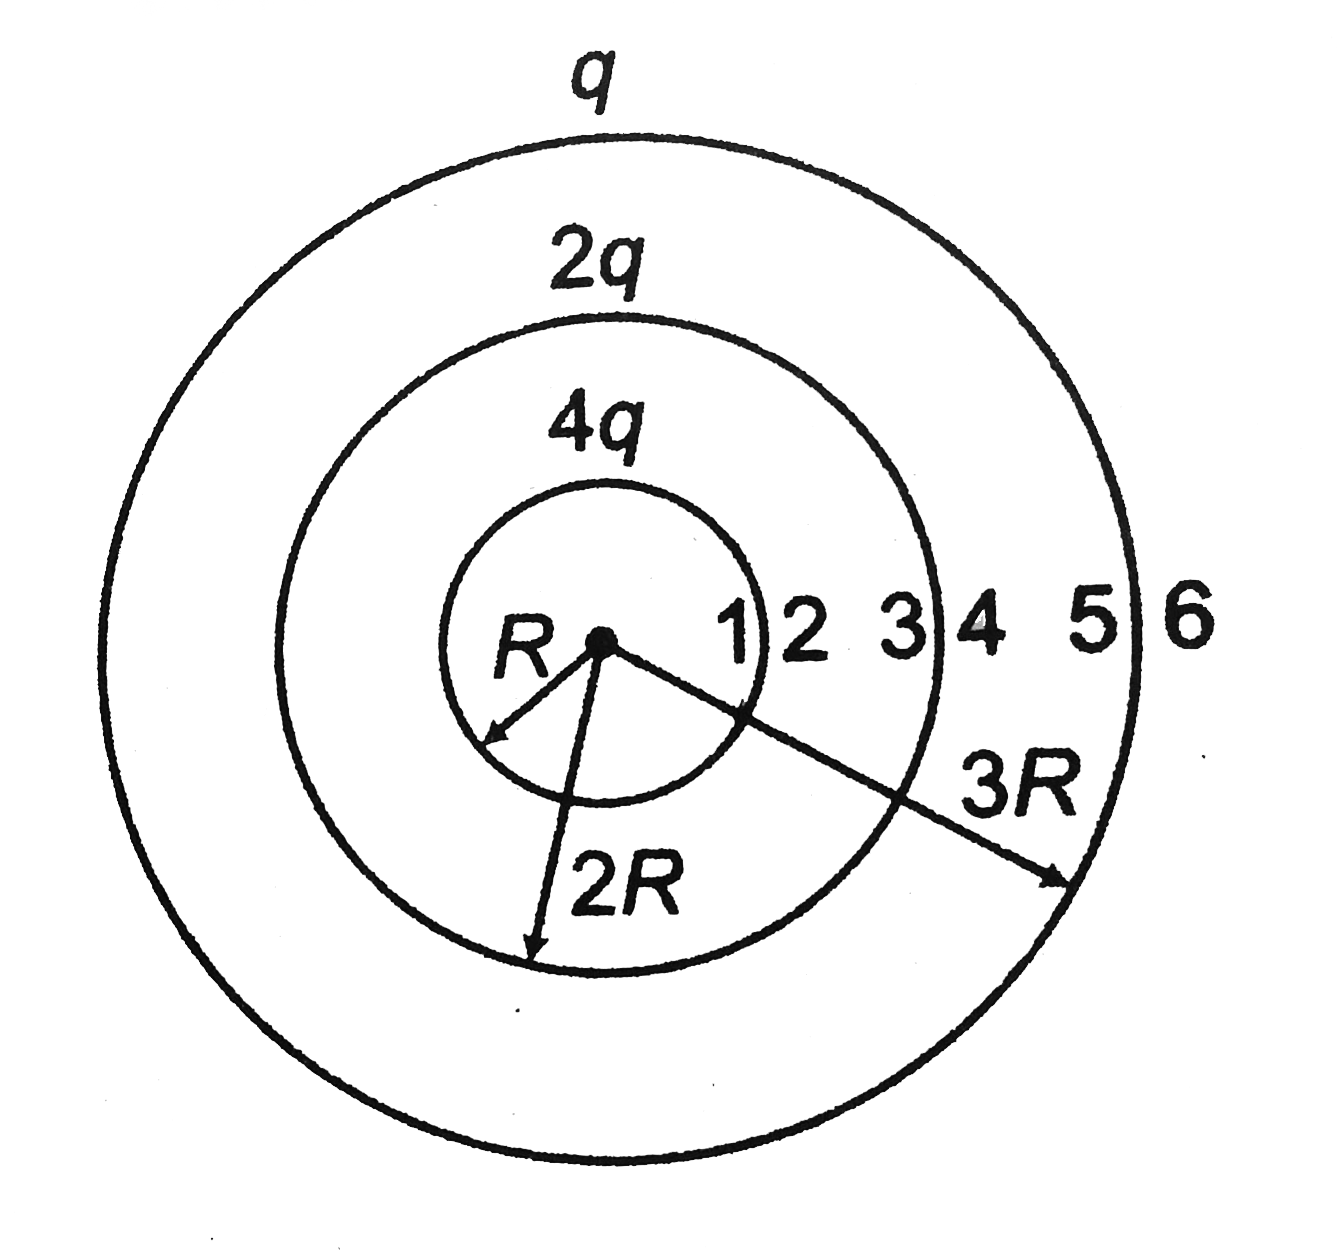
a. Find q1 and q6
b. total electrostatic potential energy .
View SolutionThe variation of the potential energy of harmonic oscillator is as shown in the figure. The spring constant is
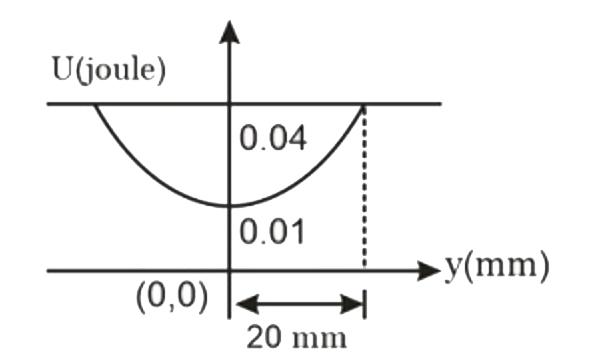
View SolutionThe displacement - time (x−t) graph of a particle executing simple harmonic motion is shown in figure. The correct variation of net force F action on the particle as a function of time is
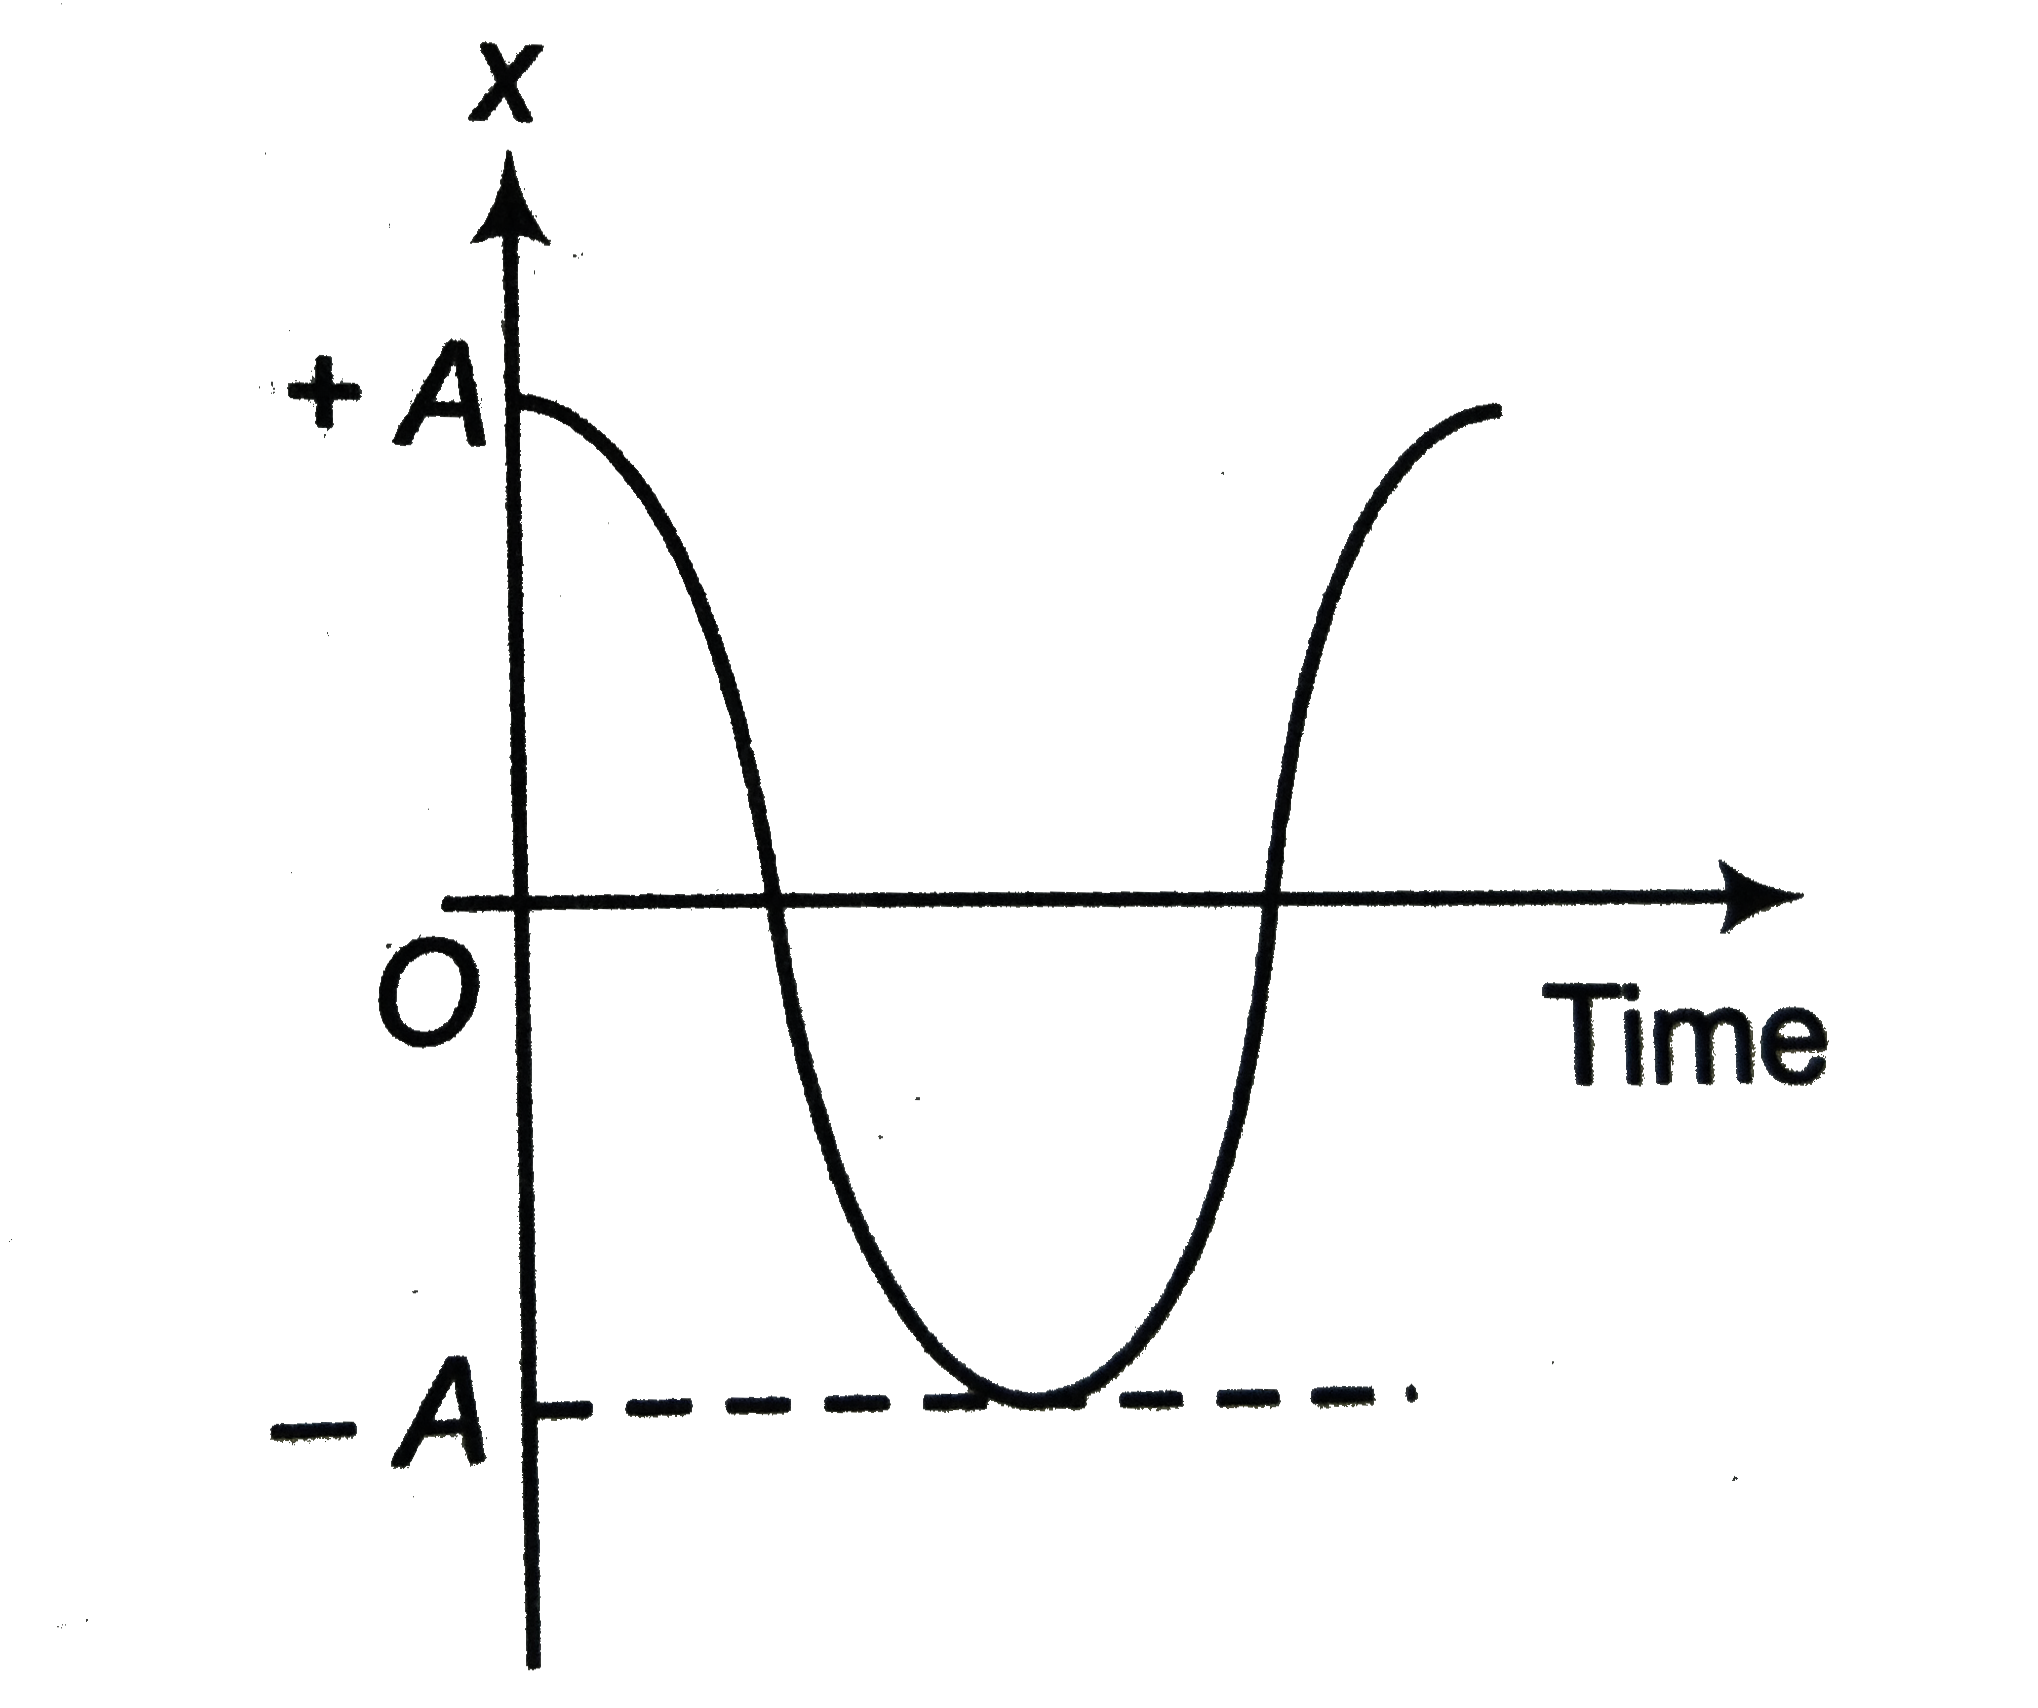
View SolutionAn open switch in an RL circuit is closed at time t = 0, as shown in the following figure. The curve that best illustrates the variation of potential difference across the resistor as a function of time is
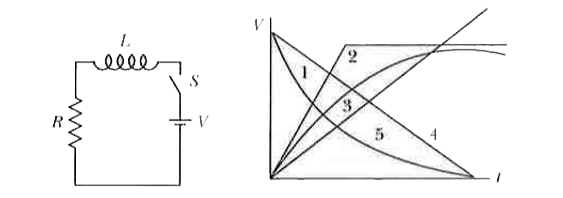
View SolutionThe potential energy U(x) of a particle moving along x−axis is shown in figure. Which one of the following graphs represents the variation of kinetic energy of this particel if its total mechanical enery is E0
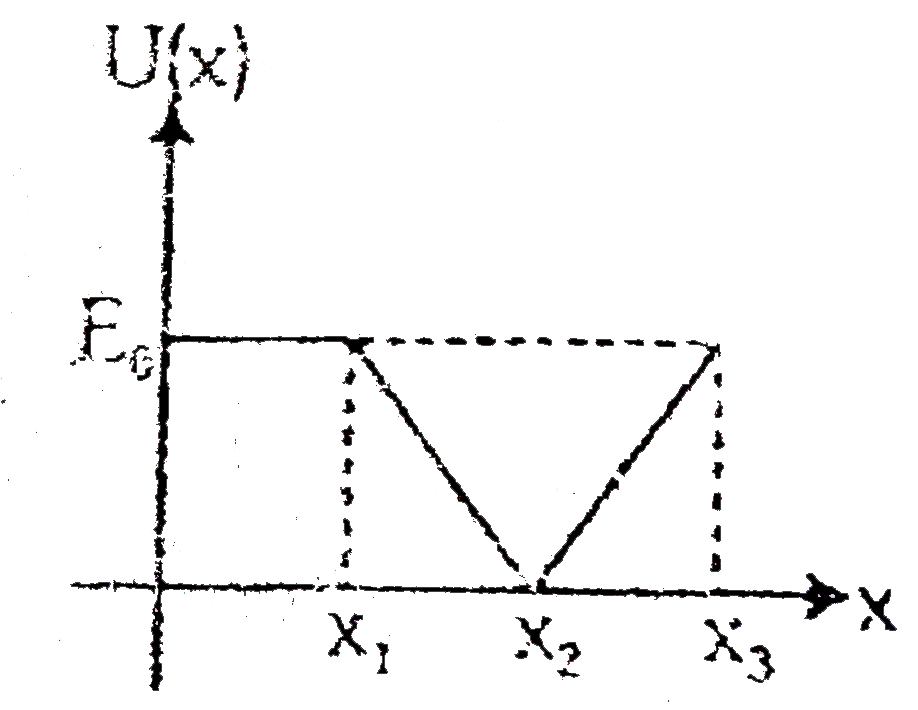
View Solution


