The velocity-time graph of a particle in one-dimensional motion is shown in the figure. Which of the following formulae is correct for describing the motion of the particle over the time interval t1 to t2?
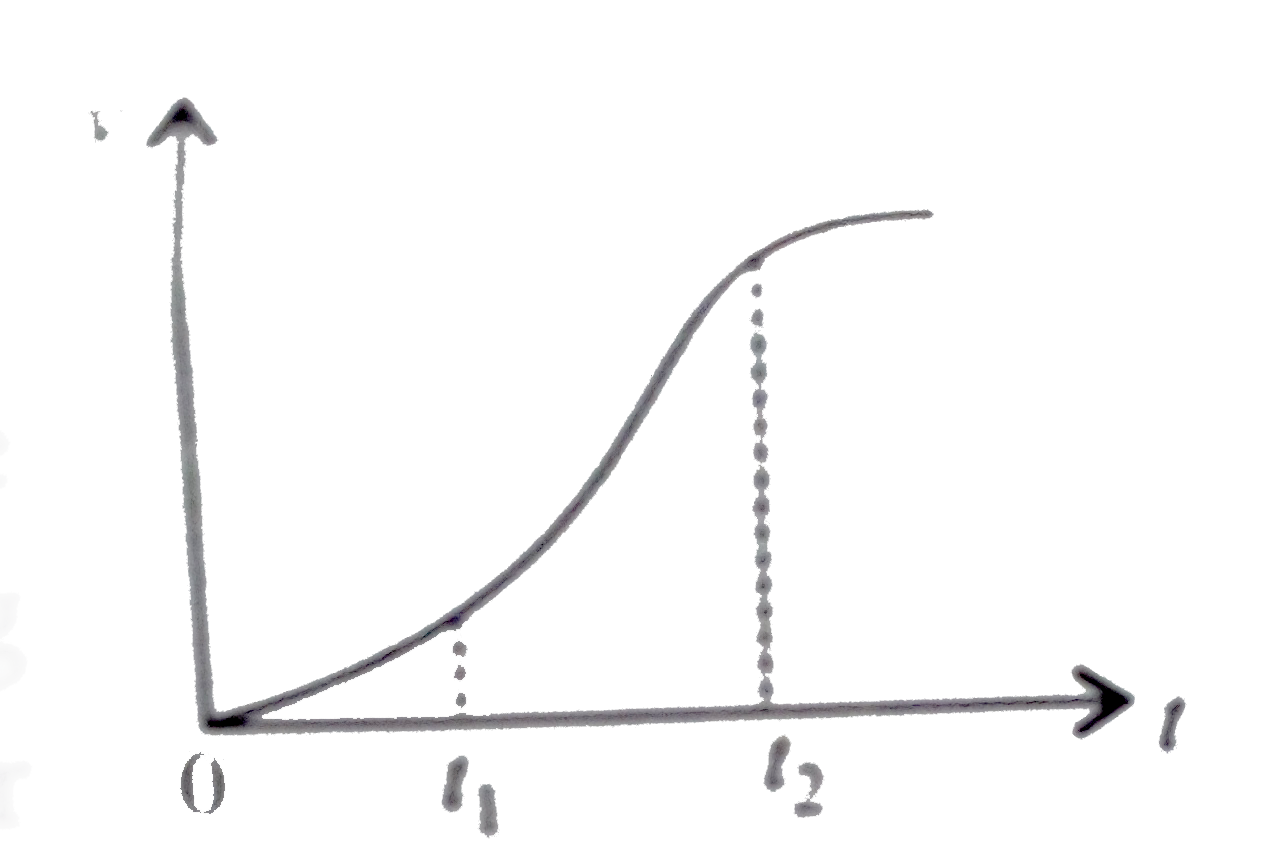
From the graph we note that the slope that the slope is mot constant and is not uniform and is not uniform, hecne the relation (i), (ii) and (v) and are not correct, but the relations (iii), (iv) and (vi) are correct.
Topper's Solved these Questions
- KINEMATICSBook:PRADEEPChapter:KINEMATICSExercise:Motion
Explore 25 Videos
- KINEMATICSBook:PRADEEPChapter:KINEMATICSExercise:Higher order thinking skills
Explore 14 Videos
- KINEMATICSBook:PRADEEPChapter:KINEMATICSExercise:NCRT Exercises
Explore 22 Videos
- GRAVIATIONBook:PRADEEPChapter:GRAVIATIONExercise:Assertion-Reason Type Questions
Explore 19 Videos
- LAWS OF MOTIONBook:PRADEEPChapter:LAWS OF MOTIONExercise:Assertion- Reason Type Questions
Explore 17 Videos
Similar Questions
The displacement-time graph of a particle executing simple harmonic motion is shown in the figure
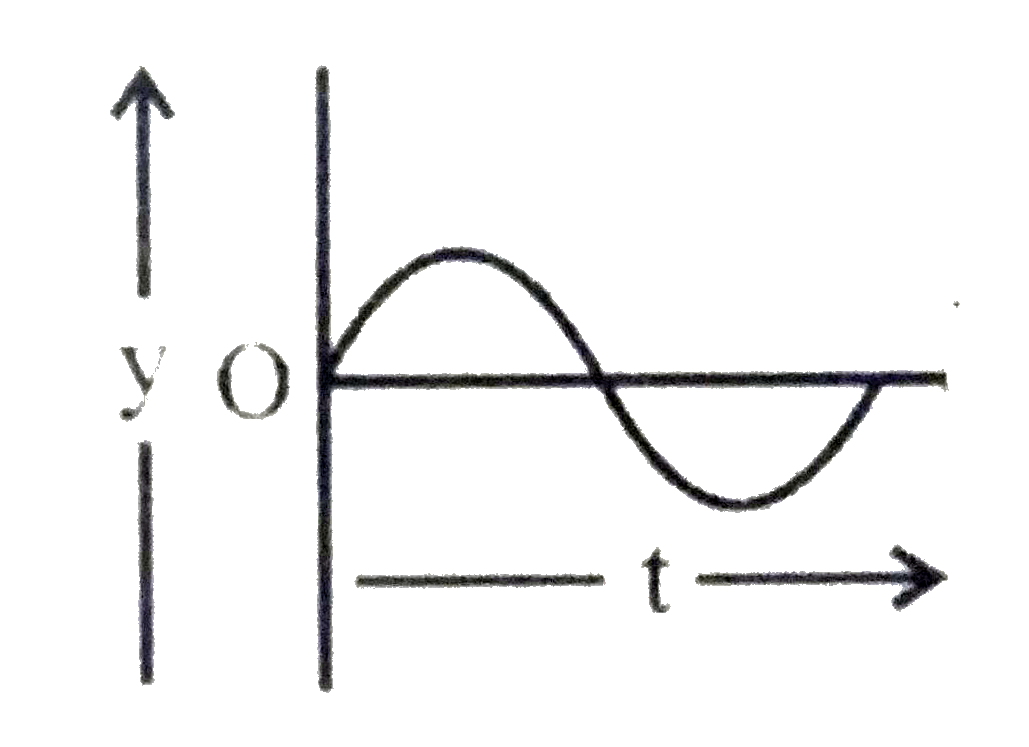
Which one of the following graphs is the correct forcetime graph for the motion of the particle ?
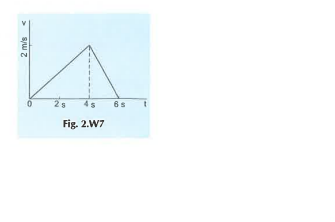
View SolutionThe velocity-time graph of a particle moving along a straight line is shown in Figure 2.W7.Is the motion uniform?
View Solution
Knowledge Check
The velocity − time graph of a particle is as shown in figure
 AIt moves with a constant acceleration throughoutBIt moves with an acceleration of constant magnitude but changing direction at the end of every two secondCThe displacement of the particle is zeroDThe velocity becomes zero at t=4 second
Which of the following graphs cannot represent one dimensional motion of a particle?
A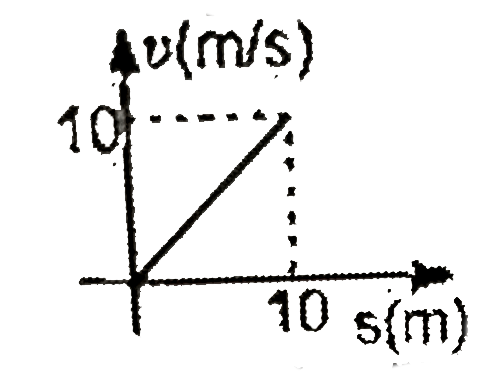 B
B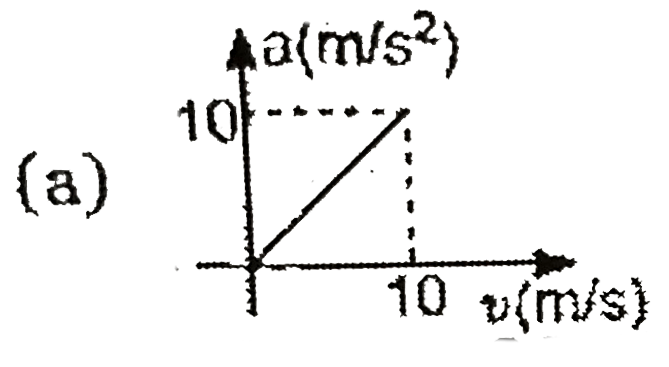 C
C D
D
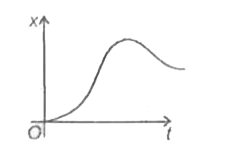
The displacement (x)-time (t) graph of a particle is shown in figure. Which of the following is correct ?
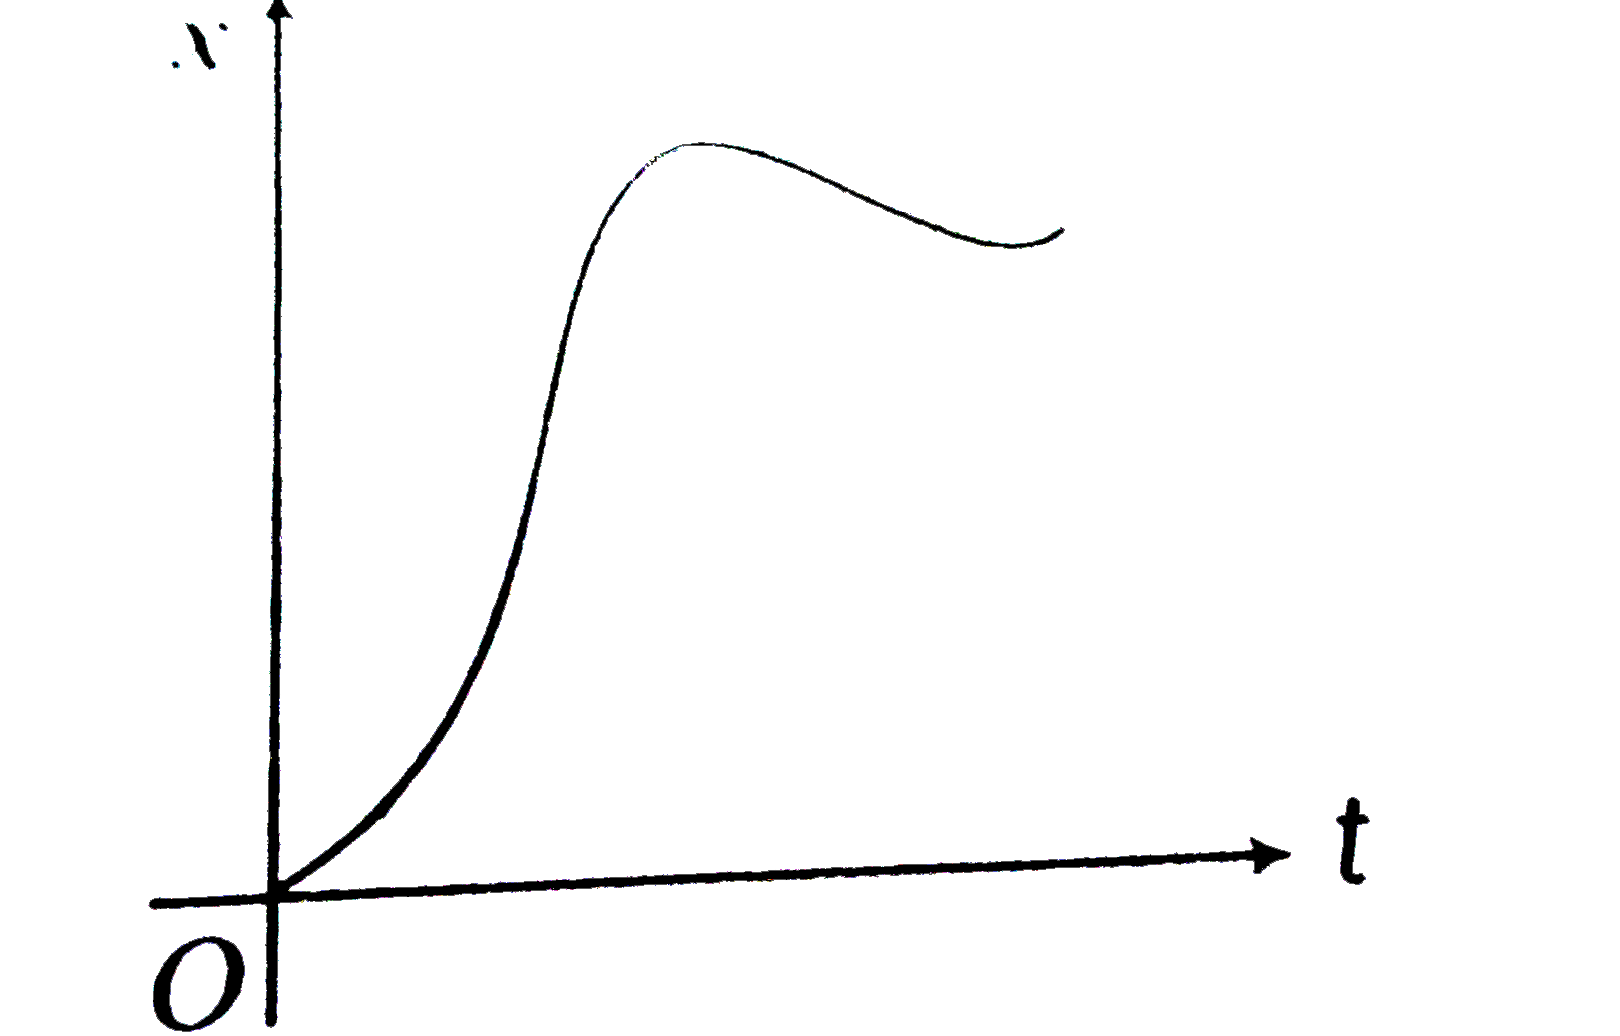 AParticle starts with zero velocity and variable accelerationBParticle starts with non-zero velocity and variable accelerationCParticle starts with zero velocity and uniform accelerationDParticle starts with non-zero velocity and uniform acceleration
s-t graph of a particle in motion is shown in Fig. Calculate
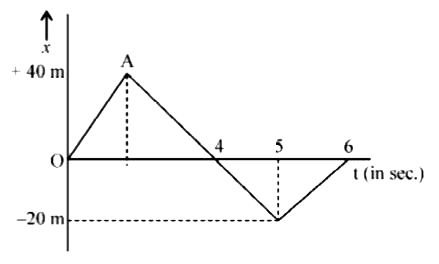
Displacement
View Solutions-t graph of a particle in motion is shown in Fig. Calculate
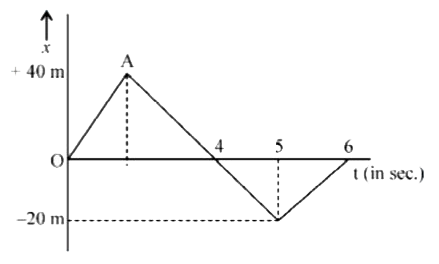
Average velocity
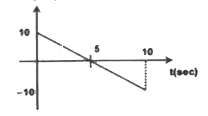
View SolutionVelocity-time graph of a particle moving in a straight line is shown in the figure. Mass of the particle is 2 kg. Work done by all the forces acting on the particle in time interval t = 0 to t = 10 sec is
View SolutionThe displacement (x) - time (t) graph of a particle is shown in figure. Which of the following is correct?
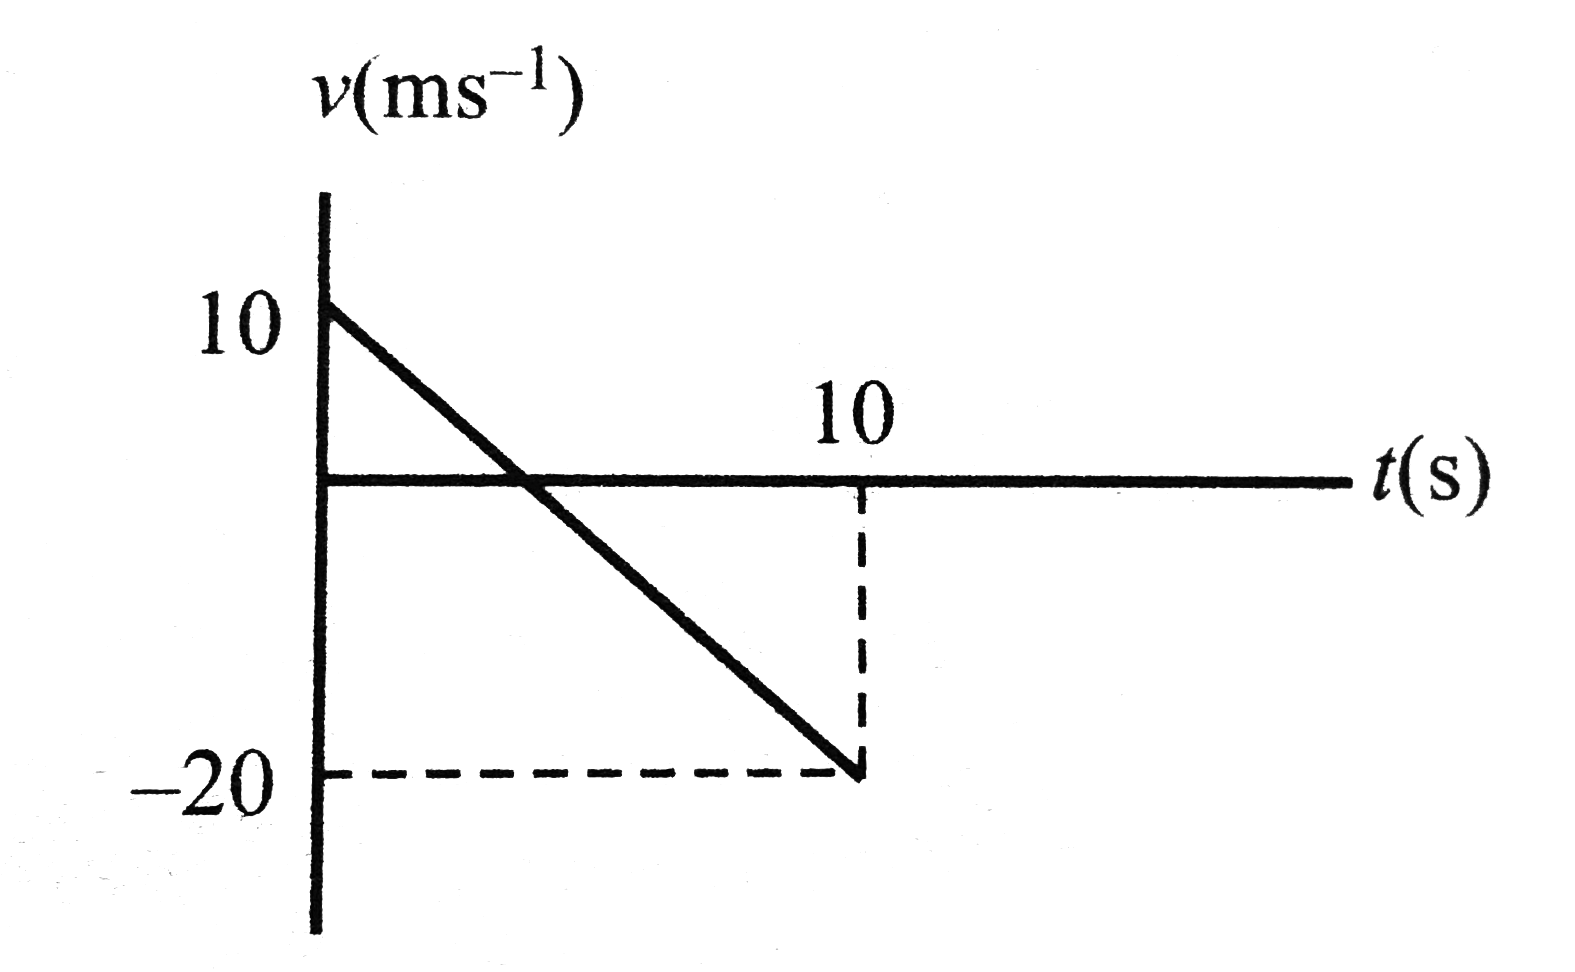
View SolutionThe velocity-time graph of a particle moving in a straight line is shown in figure. The mass of the particle is 2kg. Work done by all the forces acting on the particle in time interval between t=0 to t=10s is
View Solution

