Draw distance time graph of a body moving with constant acceleration.
To draw the distance-time graph of a body moving with constant acceleration, we can follow these steps:
1. Understanding Constant Acceleration:
- When a body is moving with constant acceleration, it means that its velocity is changing at a constant rate over time.
2. Velocity-Time Graph:
- The velocity of the body can be represented on a velocity-time graph, where the slope of the graph represents acceleration. Since the acceleration is constant, the velocity-time graph will be a straight line.
3. Relationship Between Velocity and Distance:
- Velocity is defined as the rate of change of distance with respect to time. Mathematically, this is expressed as:
v=dxdt
- Since the velocity is changing at a constant rate (as shown by the straight line in the velocity-time graph), the distance-time graph will not be linear.
4. Integrating to Find Distance:
- To find the distance as a function of time, we can integrate the velocity function. If we express velocity as:
v(t)=mt+u
where m is the slope (acceleration), and u is the initial velocity.
- We can rewrite the equation for distance as:
dx=(mt+u)dt
- Integrating both sides gives:
x(t)=12mt2+ut+C
where C is the constant of integration.
5. Identifying the Shape of the Graph:
- The equation x(t)=12mt2+ut+C is a quadratic equation in terms of t. The graph of a quadratic equation is a parabola.
- Therefore, the distance-time graph of a body moving with constant acceleration will be a parabola opening upwards.
6. Drawing the Graph:
- On a graph, label the x-axis as time (t) and the y-axis as distance (x).
- Draw a smooth curve that represents a parabola starting from the origin (if initial distance is zero) and curving upwards, indicating that as time increases, the distance increases at an increasing rate.
Final Graph:
- The final graph will show a parabolic curve, indicating that the distance increases more rapidly as time progresses due to the constant acceleration.
- When a body is moving with constant acceleration, it means that its velocity is changing at a constant rate over time.
- The velocity of the body can be represented on a velocity-time graph, where the slope of the graph represents acceleration. Since the acceleration is constant, the velocity-time graph will be a straight line.
- Velocity is defined as the rate of change of distance with respect to time. Mathematically, this is expressed as:
v=dxdt
- Since the velocity is changing at a constant rate (as shown by the straight line in the velocity-time graph), the distance-time graph will not be linear.
- To find the distance as a function of time, we can integrate the velocity function. If we express velocity as:
v(t)=mt+u
where m is the slope (acceleration), and u is the initial velocity.
- We can rewrite the equation for distance as:
dx=(mt+u)dt
- Integrating both sides gives:
x(t)=12mt2+ut+C
where C is the constant of integration.
- The equation x(t)=12mt2+ut+C is a quadratic equation in terms of t. The graph of a quadratic equation is a parabola.
- Therefore, the distance-time graph of a body moving with constant acceleration will be a parabola opening upwards.
- On a graph, label the x-axis as time (t) and the y-axis as distance (x).
- Draw a smooth curve that represents a parabola starting from the origin (if initial distance is zero) and curving upwards, indicating that as time increases, the distance increases at an increasing rate.
- The final graph will show a parabolic curve, indicating that the distance increases more rapidly as time progresses due to the constant acceleration.
Topper's Solved these Questions
- MOTIONBook:PRADEEPChapter:MOTIONExercise:formative Assesment paper pen test
Explore 15 Videos
- MOTIONBook:PRADEEPChapter:MOTIONExercise:Formative Assessment 1(b) - Oral testing (Exercise)
Explore 1 Video
- MOTIONBook:PRADEEPChapter:MOTIONExercise:Worksheet testing(fill in the blanks)
Explore 5 Videos
- GRAVITATIONBook:PRADEEPChapter:GRAVITATIONExercise:Model Test paper (1)
Explore 36 Videos
- SOUNDBook:PRADEEPChapter:SOUNDExercise:Model Test (sec - B)
Explore 12 Videos
Similar Questions
Knowledge Check
Assertion : The displacement-time graph of a body moving with uniform acceleration is a straight line.
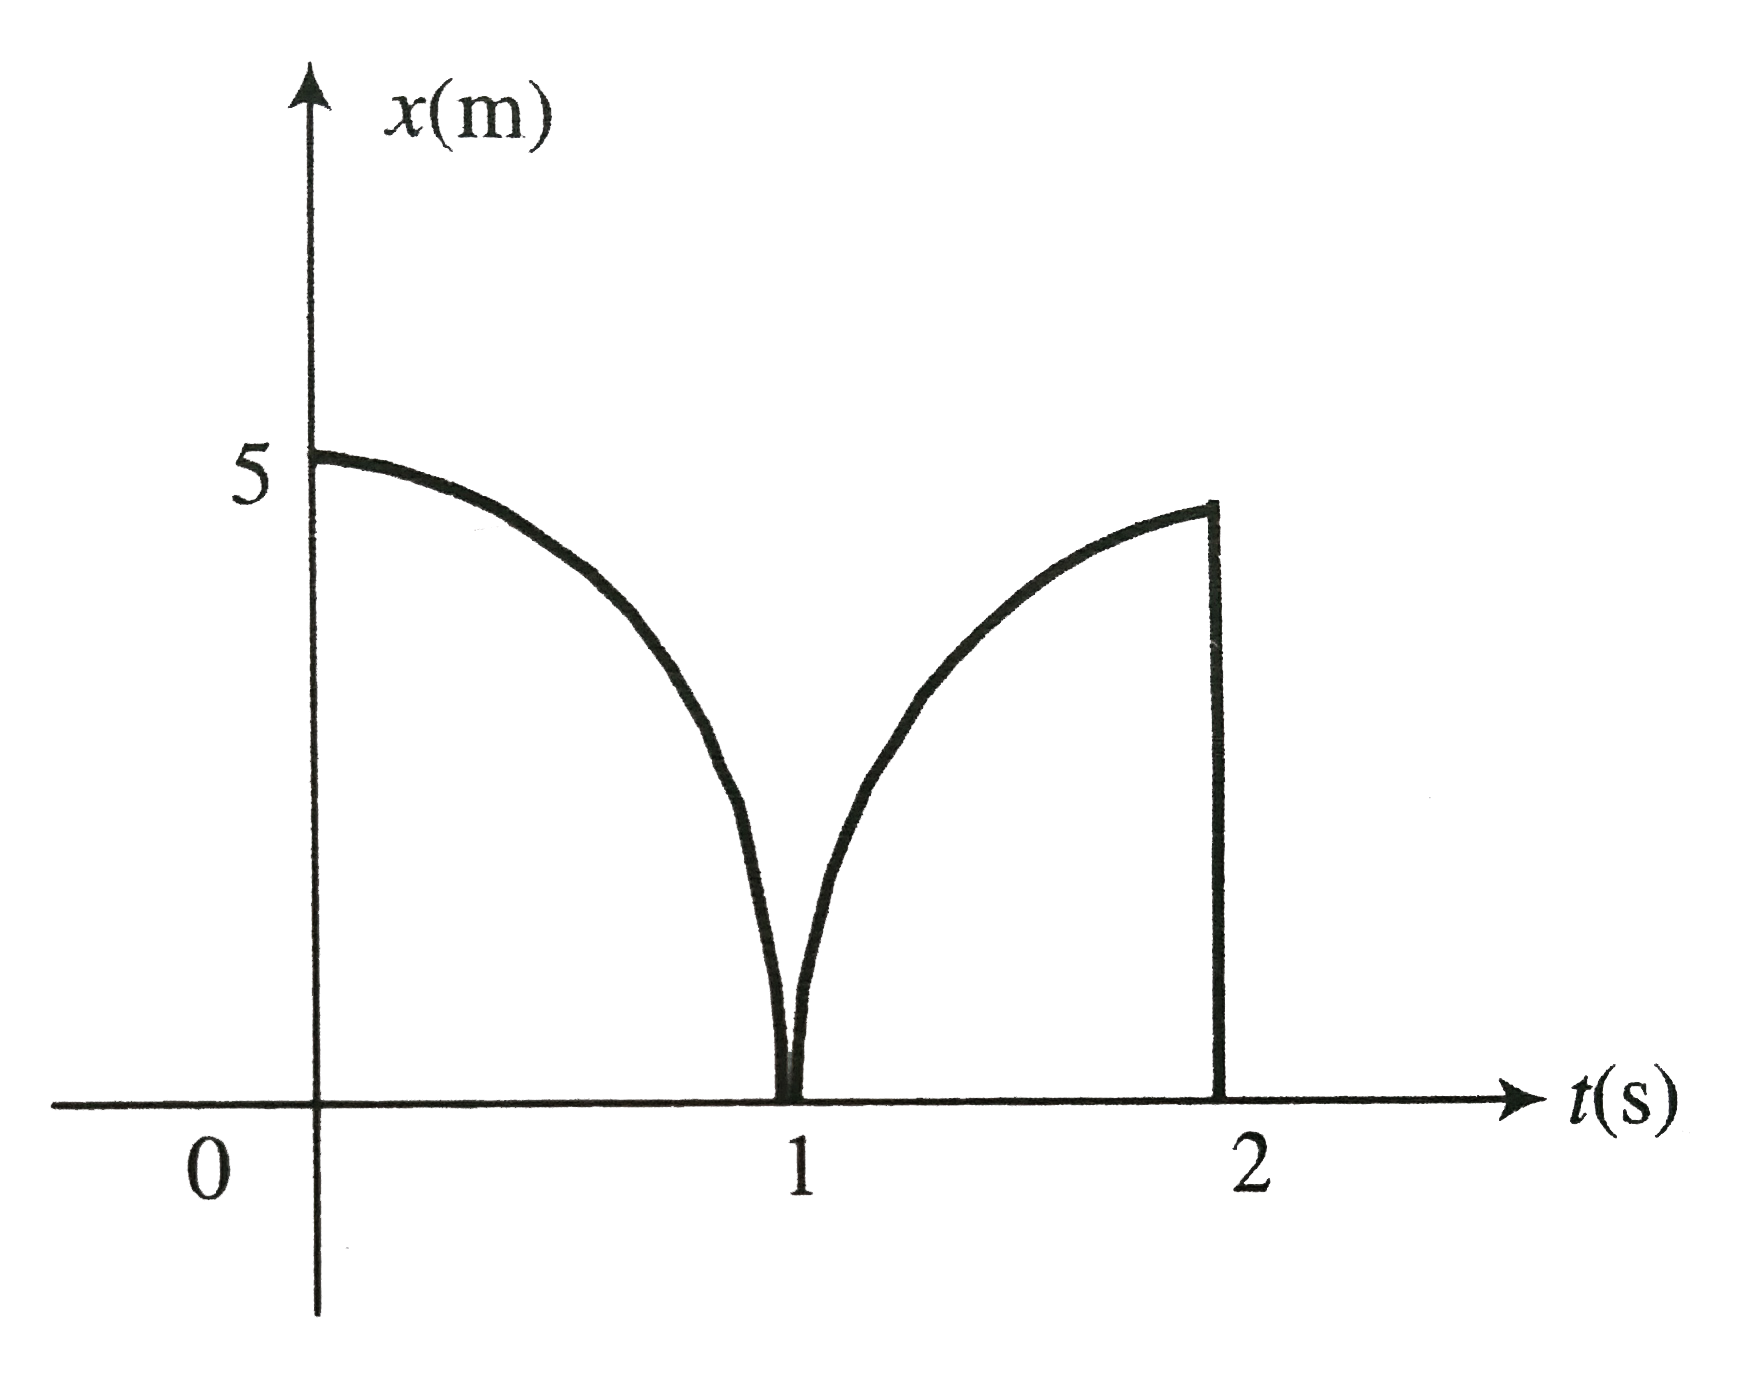
Reason : The displacement is proportional to time for uniformly accelerated motion.AIf both assertion and reason are true and the reason is the correct explanation of the assertion.BIf both assertion and reason are true but reason is not the correct explanation of the assertion.CIf assertion is true but reason is false.DIf the assertion and reason both are falseThe displacement-time graph of a moving particle with constant acceleration is shown in. The velocity-time is given by
 .A
.A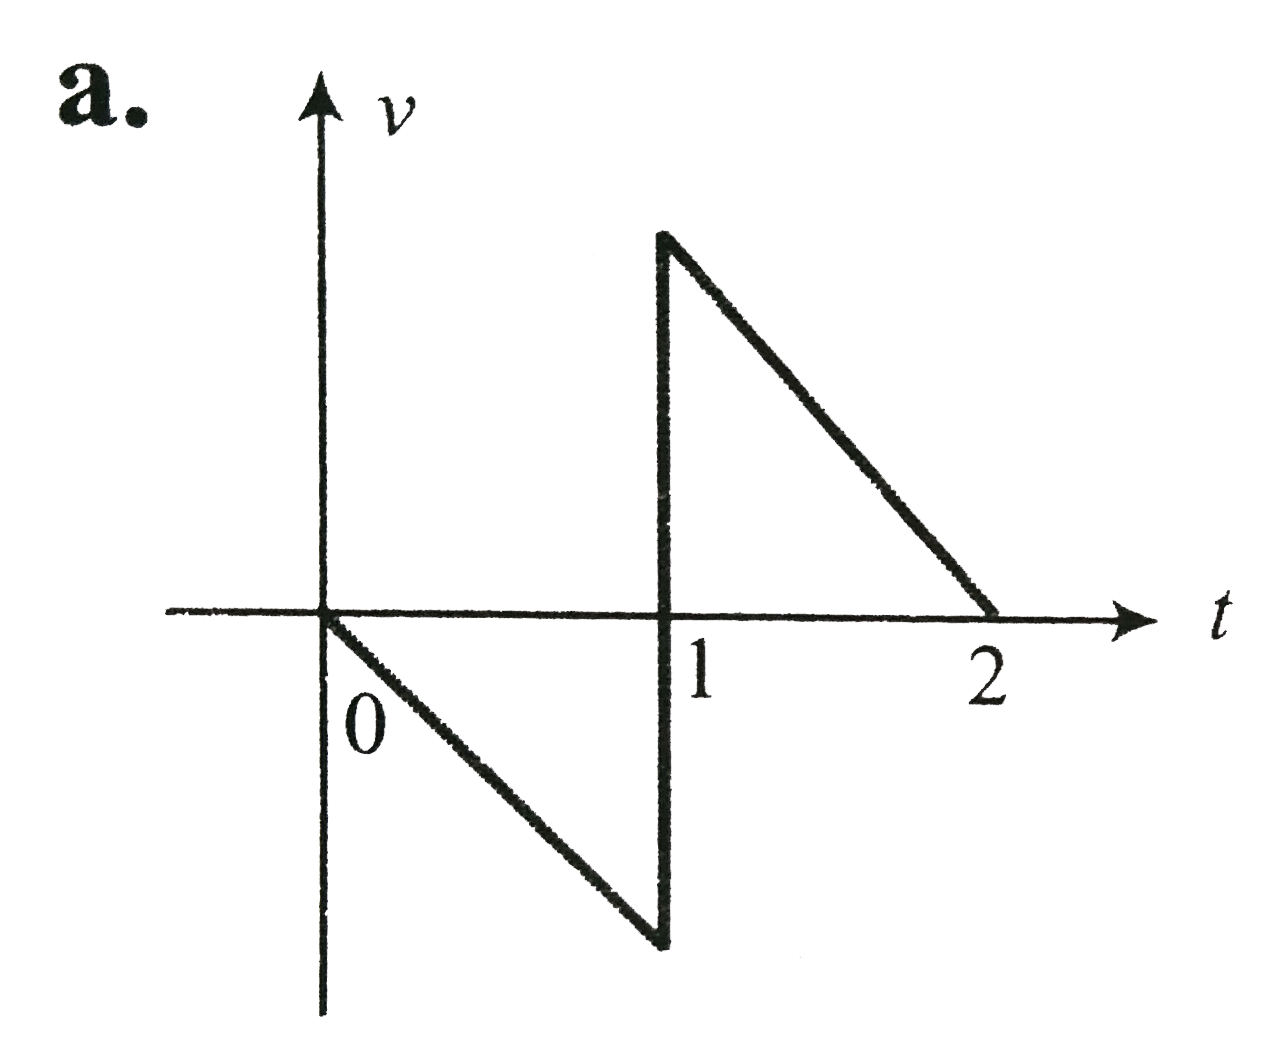 .B
.B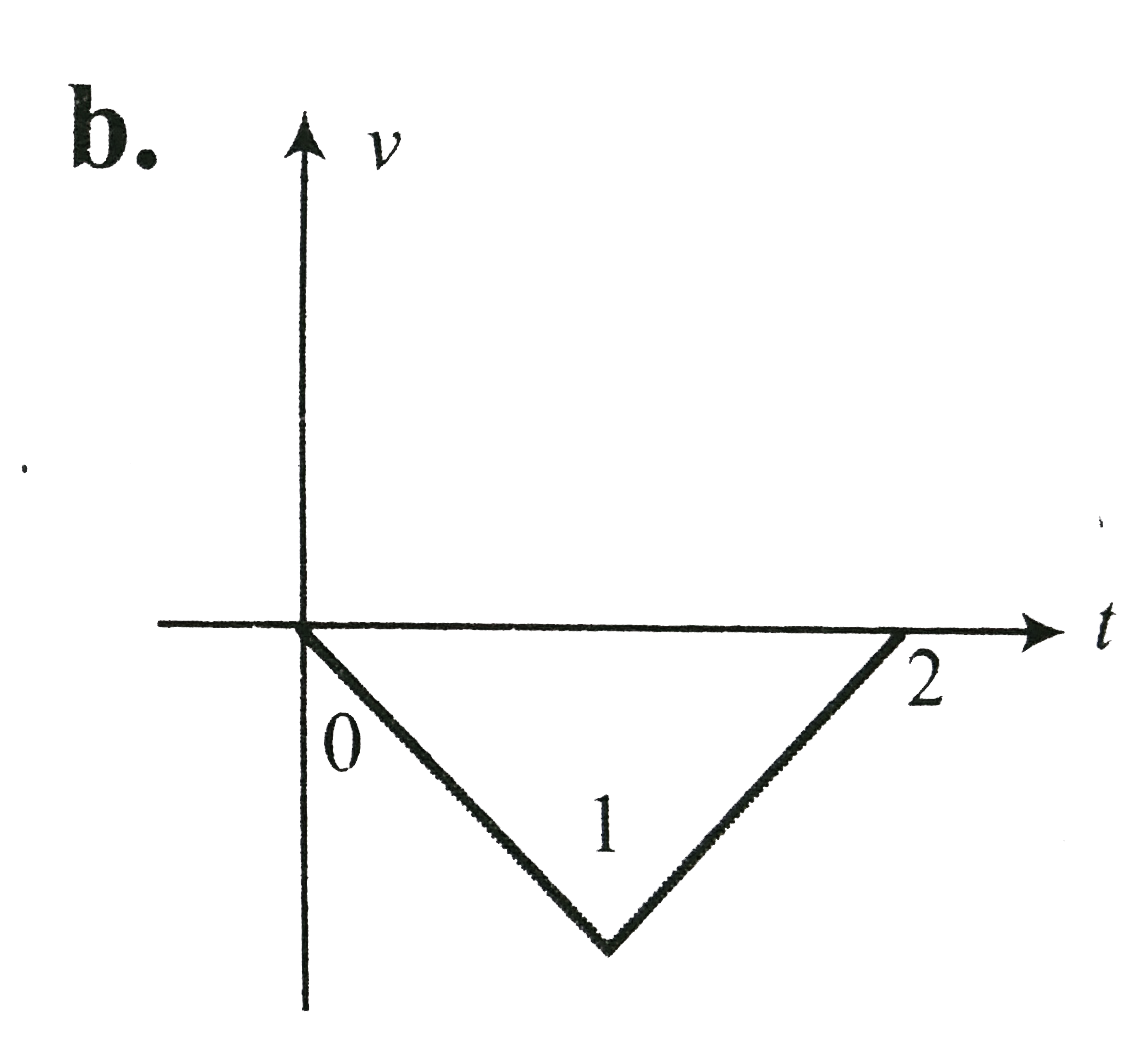 .C
.C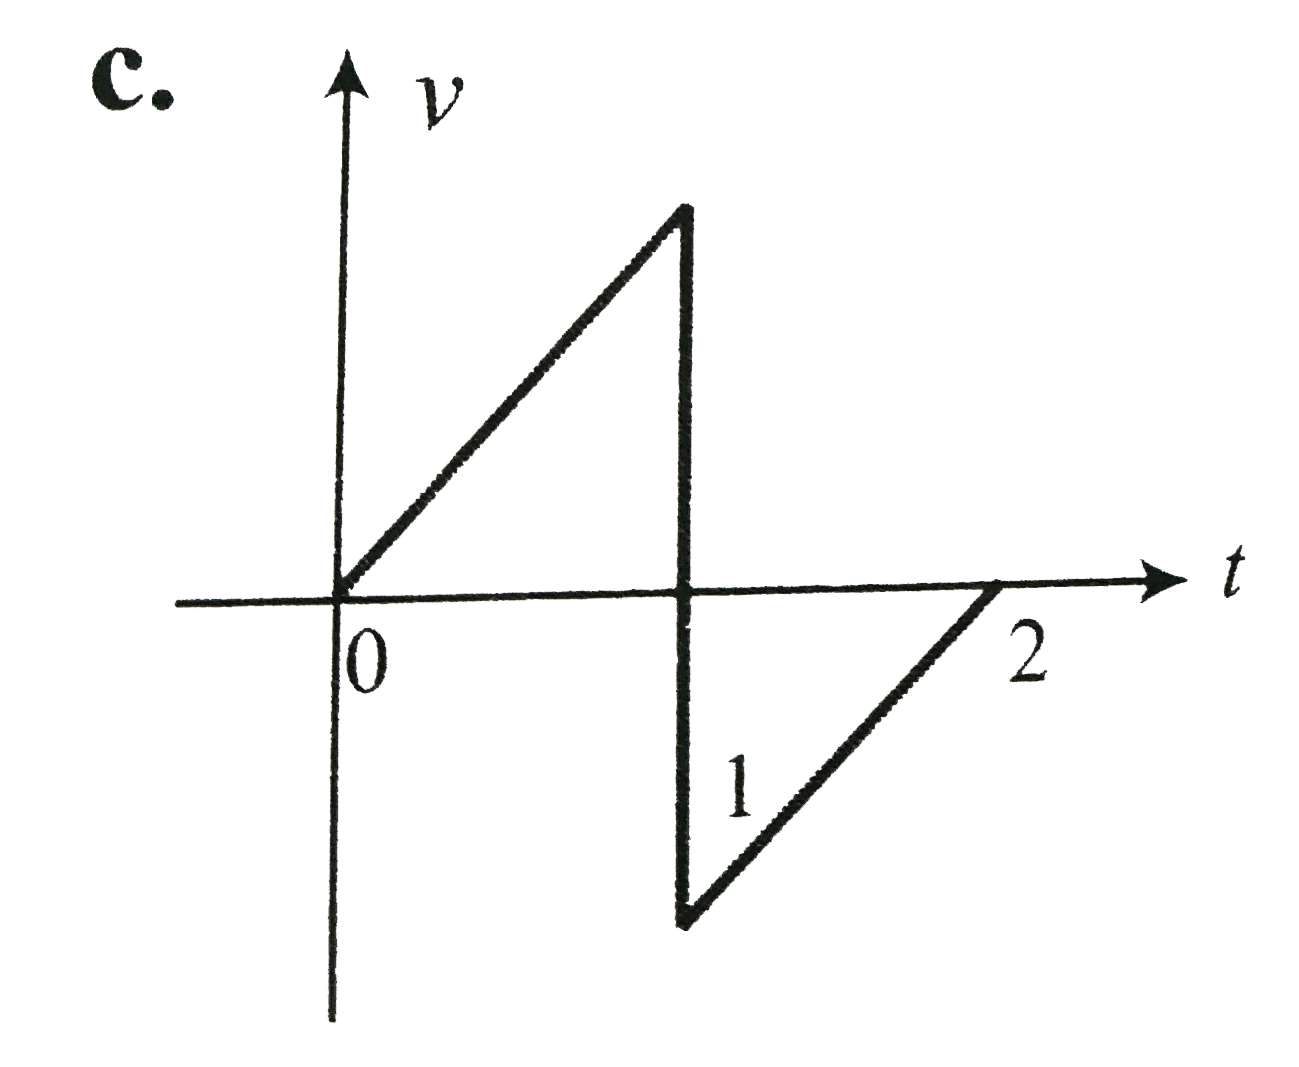 .D
.D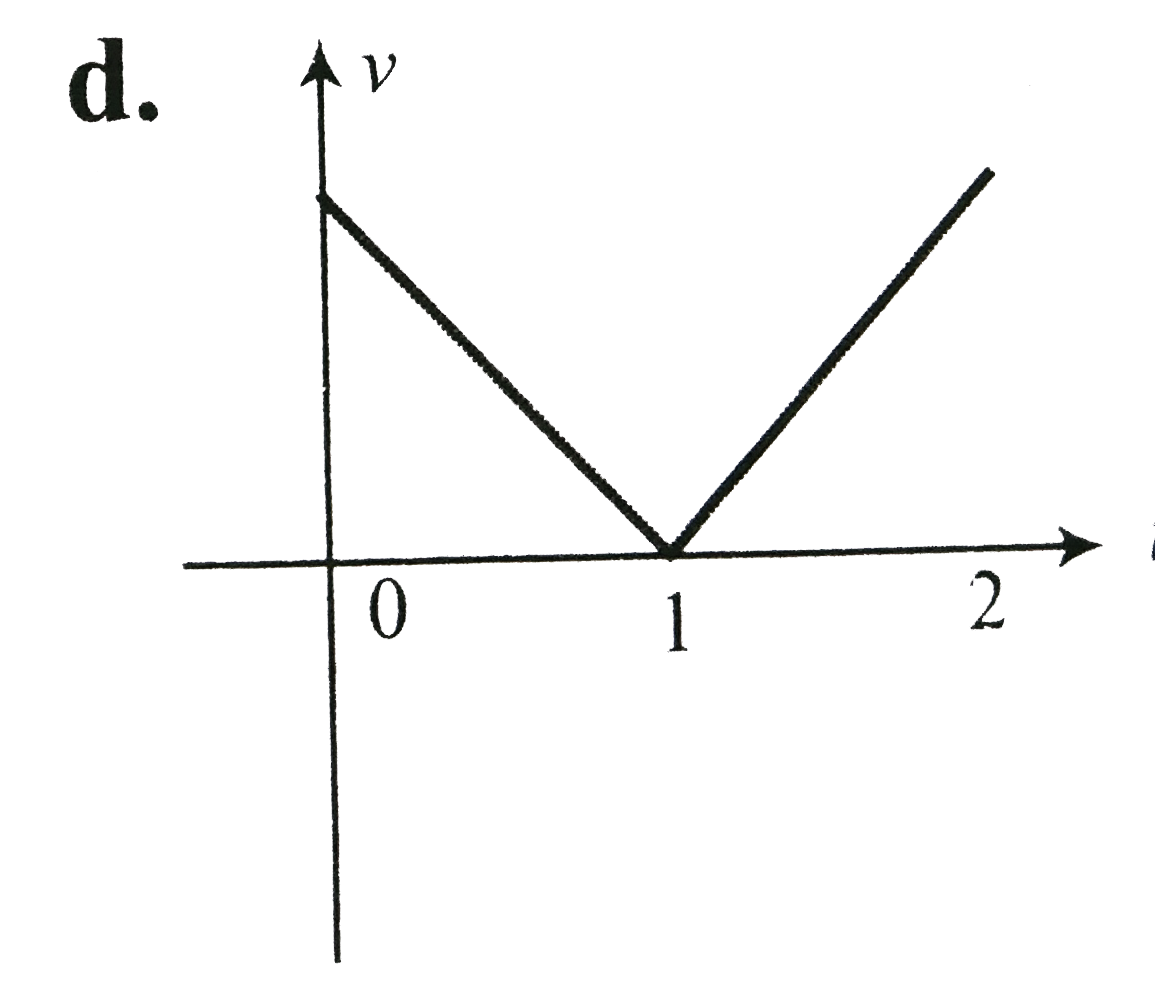 .
.If a body is moving with constant speed, then its acceleration
AMust be zeroBMay be variableCMay be uniformDBoth (2) & (3)
What is the nature of the displacement time curve of a body moving with constant acceleration ?
View SolutionShow that the area under the velocity-time graph of an object moving with constant acceleration in a straight line in certain time interval is equal to the distance covered by the object in that interval.
View SolutionShow that area under the velocity-time graph of an object moving with constant acceleration in a straight line in certain time interval is equal to the distance covered by the object in the interval.
View SolutionDraw the following graphs (expected nature only) between distance and time of an object in case of:For a body moving with constant acceleration.
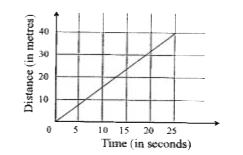
View SolutionThe distance versus time graph of a ball moving with a constant speed is shown in the given graph.
View Solution

