The velocity time graphs of two bodies A and B are shown in Figure. Observe these graphs carefully and answer the following questions :
(i) From the shape of graphs, what is nature of motion of A and B
(ii) What do you infer from the slopes of the graphs ?
(iii) What are the initial velocities of A and B ?
(iv) What is acceleration of A ?
(v) What is acceleration of B ?
(vi) What distance is travelled by B before coming to rest ?
(vii) At what time will the two bodies have equal velocity ?
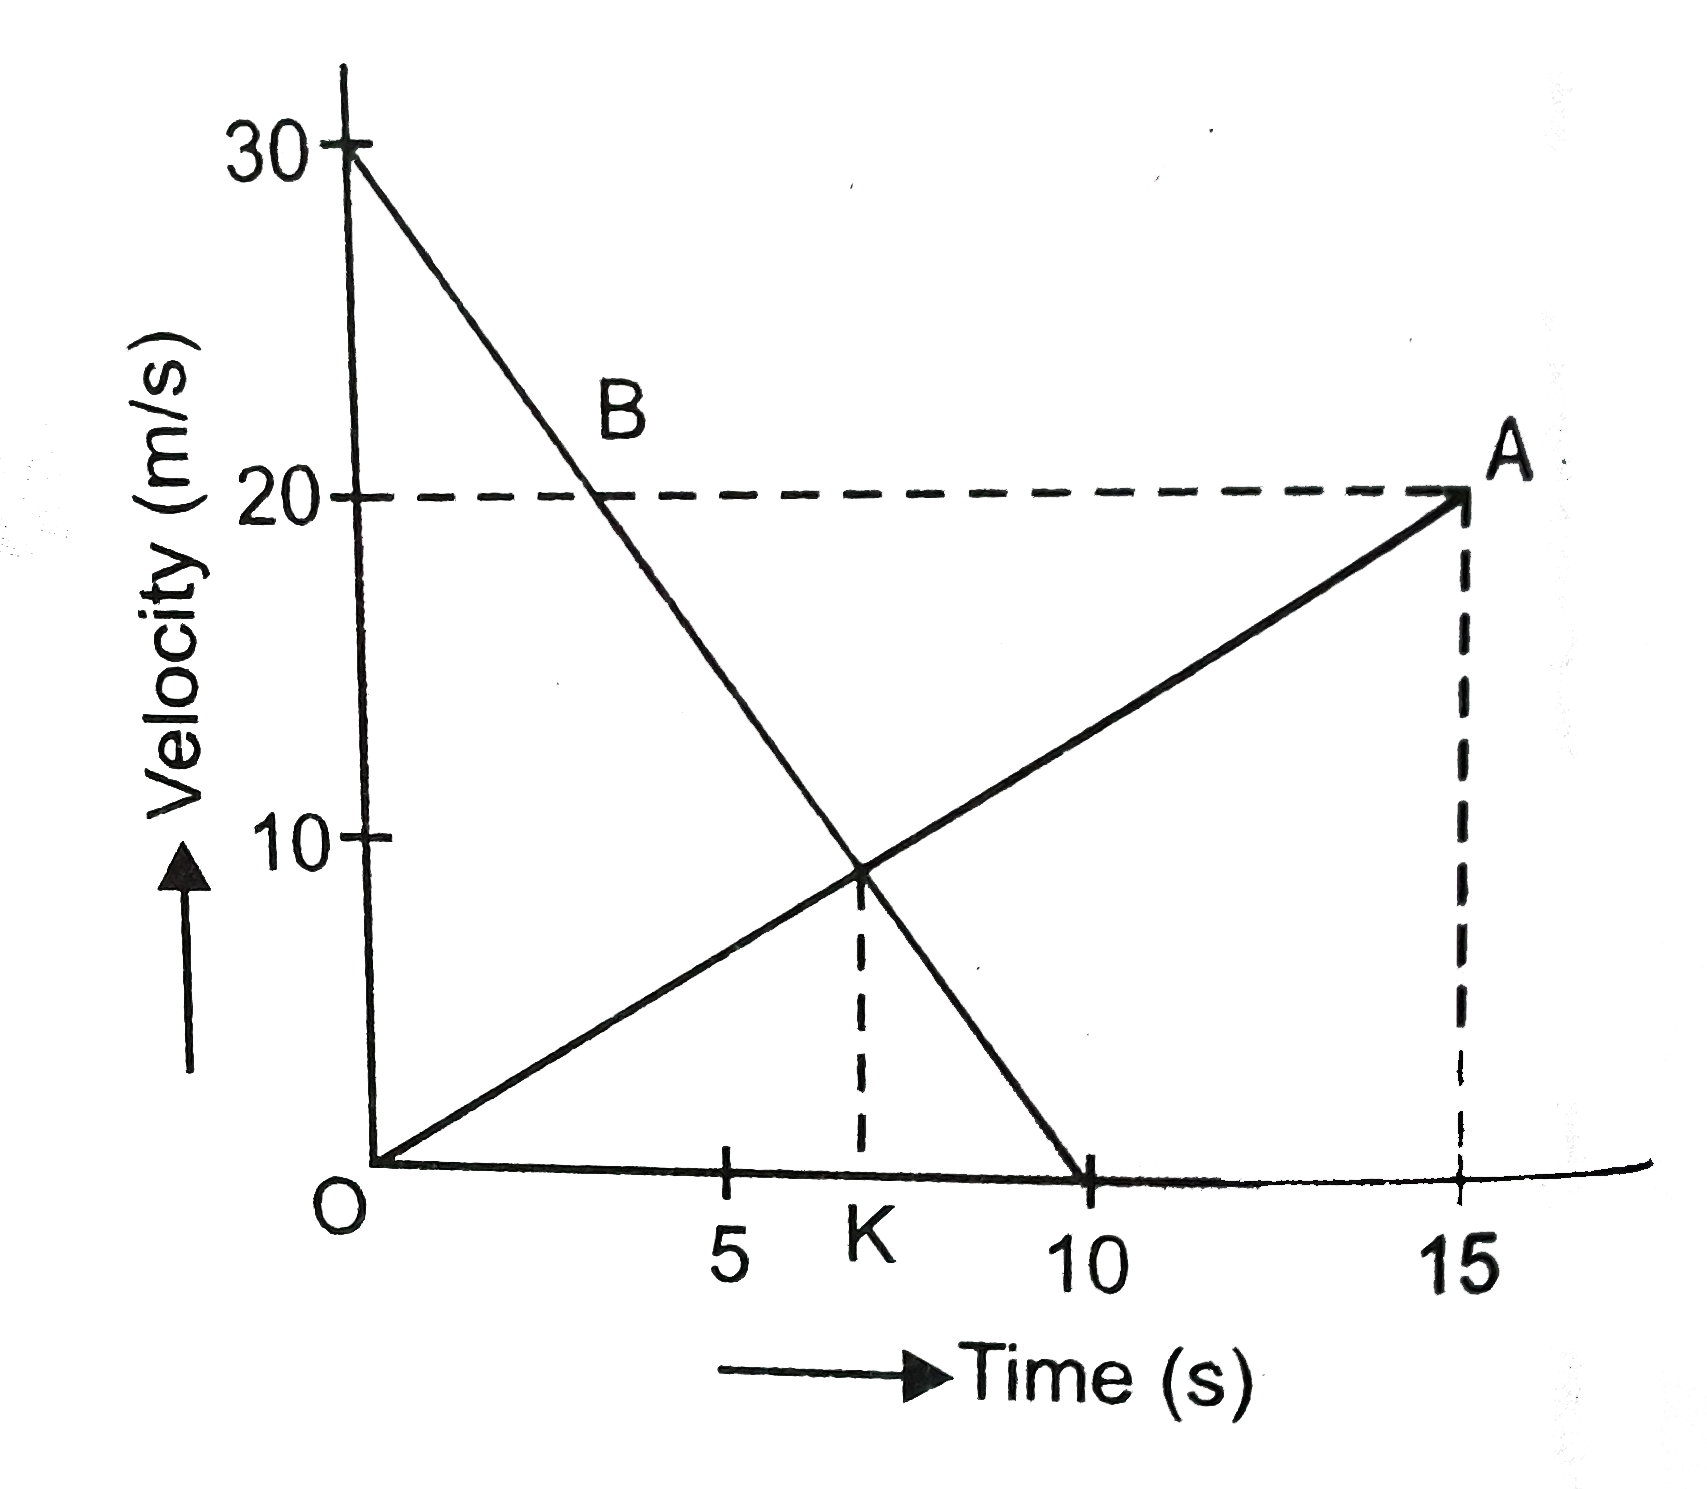
(i) As vel-time graph of AandB are straight lines, both the bodies have uniformly acclerated motion.
(ii) Slope of A is positive. So acceleration of A is positive. Slope of B is negative. So acceleration of B is negative, i.e., B moves with retardation.
(iii) Initial vel. of A=0. Initial vel. of B=30m/s
Ac c. of A =change of vel.time taken=20−015=1.33m/s2
(v) Ac c. of B =Change of vel.time taken=0−3010=−3m/s2 Negative sign indicates retardation
(vi) distance travelled = Area under vel.time graph of B=30×102=150m
(vii) From the graph, velocity of A = vel. of B at t=OK, whose value can be read from the scale on the graph.
Topper's Solved these Questions
- MOTIONBook:PRADEEPChapter:MOTIONExercise:formative Assesment paper pen test
Explore 15 Videos
- MOTIONBook:PRADEEPChapter:MOTIONExercise:Formative Assessment 1(b) - Oral testing (Exercise)
Explore 1 Video
- MOTIONBook:PRADEEPChapter:MOTIONExercise:Worksheet testing(fill in the blanks)
Explore 5 Videos
- GRAVITATIONBook:PRADEEPChapter:GRAVITATIONExercise:Model Test paper (1)
Explore 36 Videos
- SOUNDBook:PRADEEPChapter:SOUNDExercise:Model Test (sec - B)
Explore 12 Videos
Similar Questions
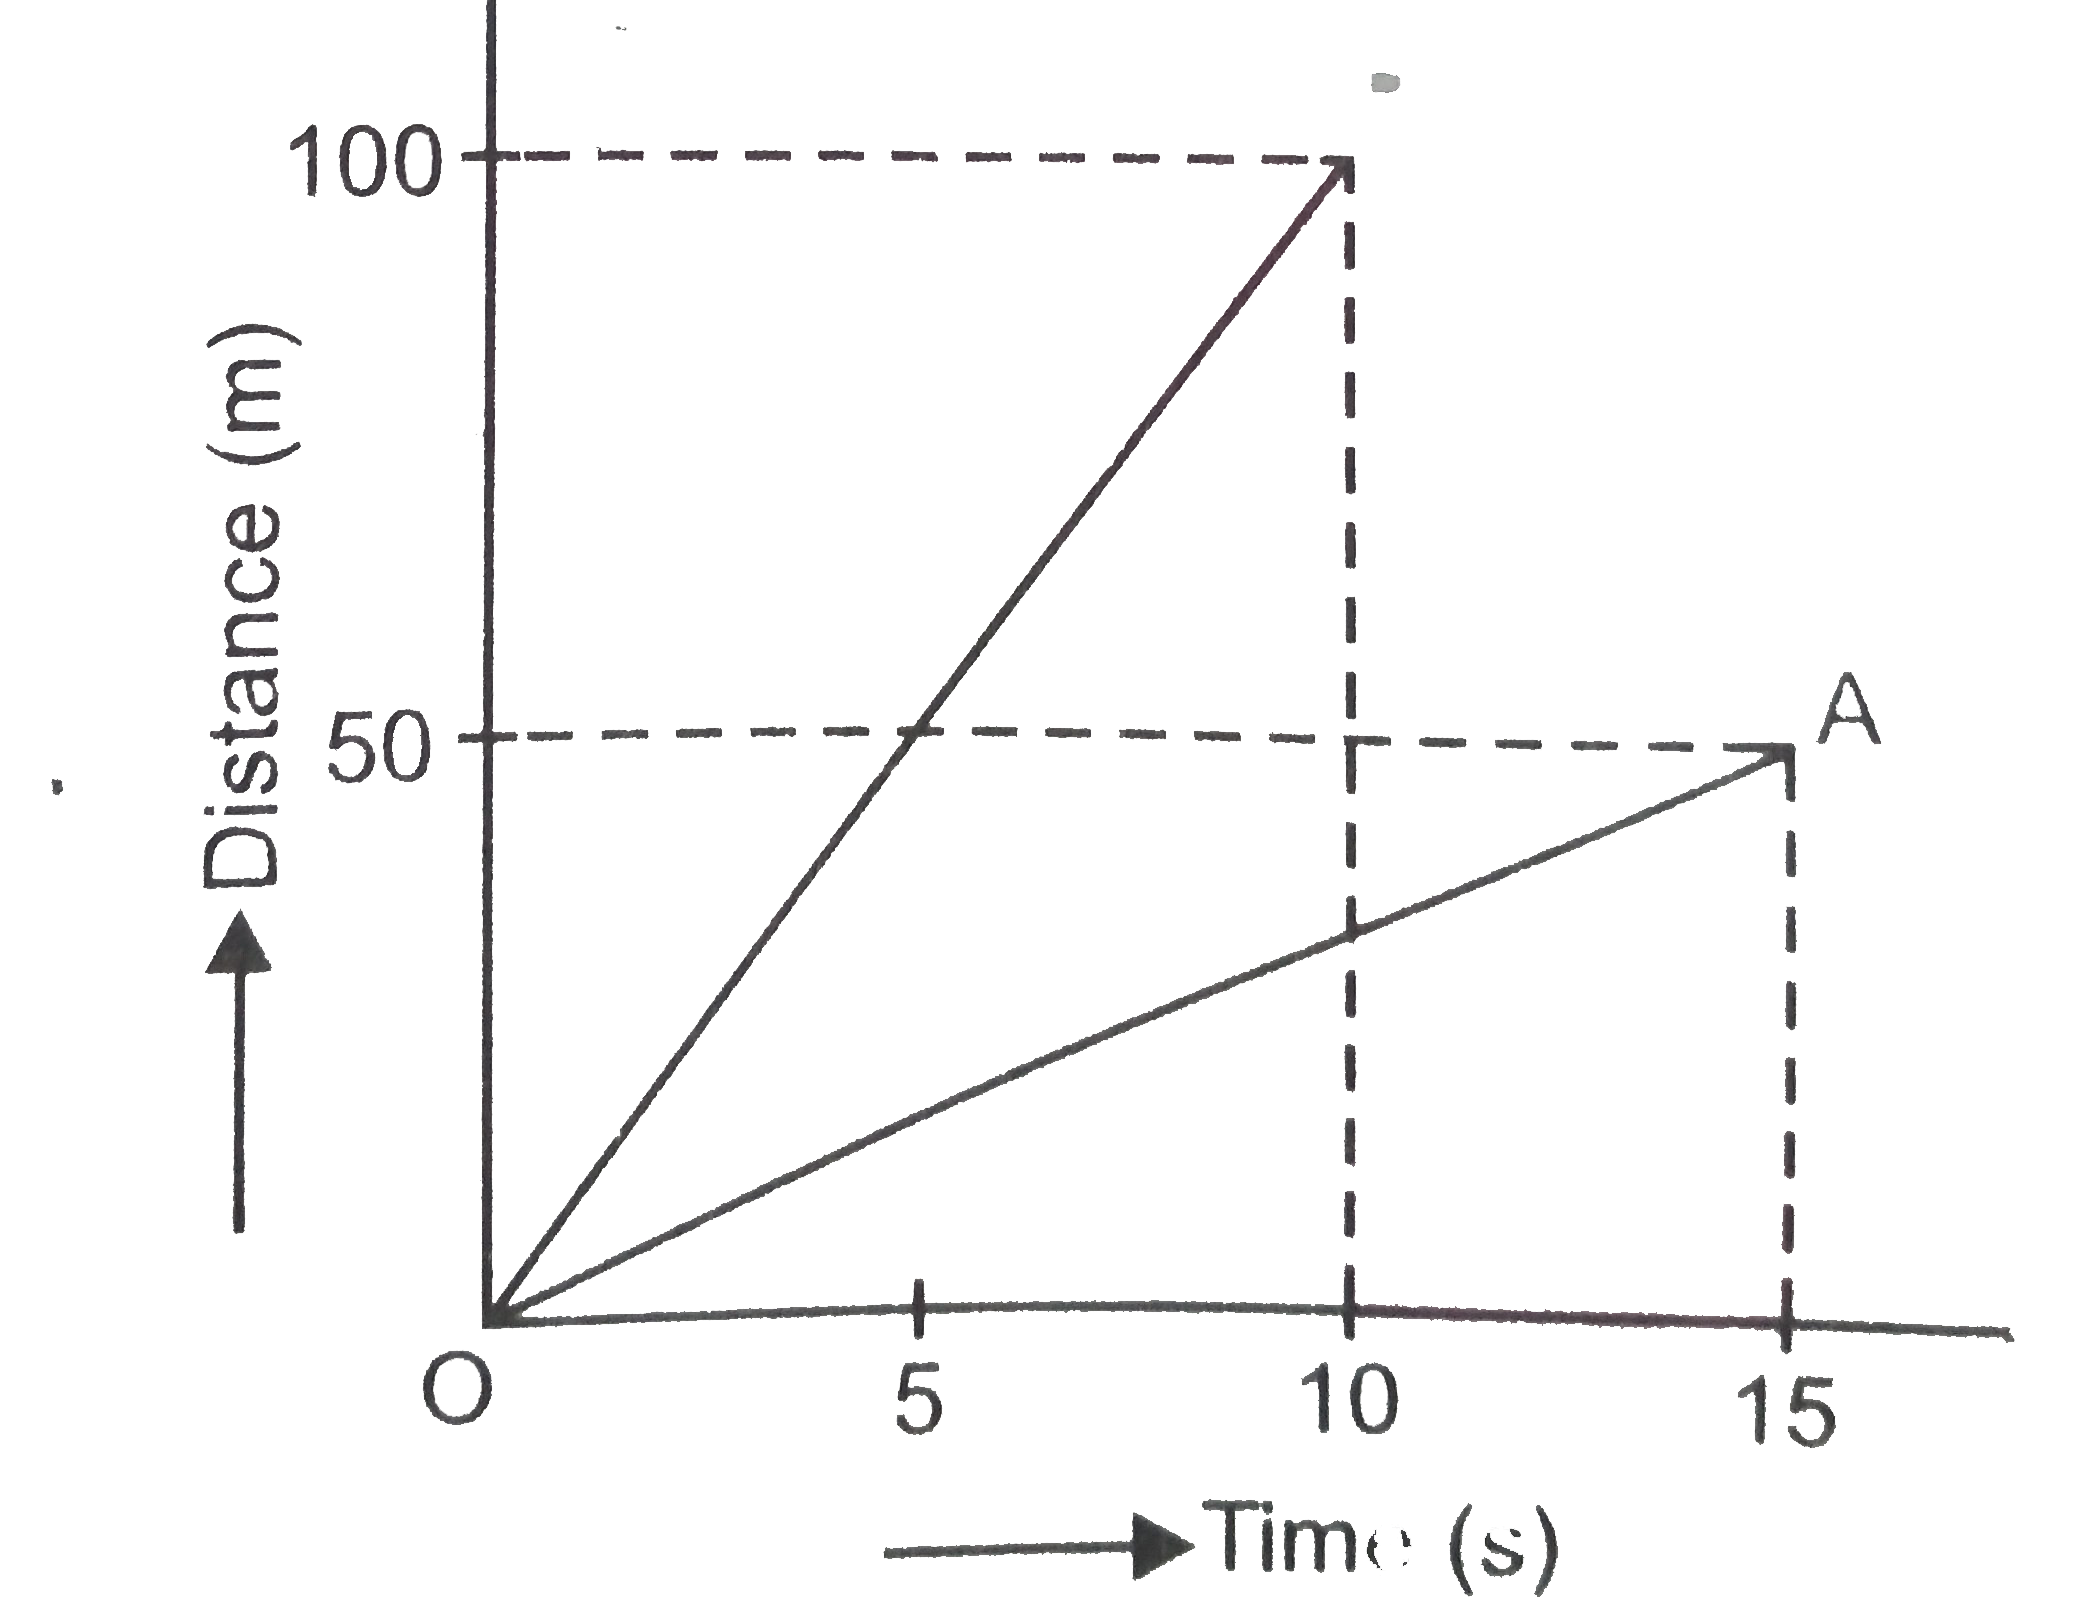
The ditance time graph of two bodies AandB are shown in Figure. Observer the graph carefully and answer the following questions :
(i) Do both the bodies start from the same position ?
(ii) Do they have uniform speed ?
(c ) Does anybody have acceleration ?
(iv) What is speed of A?
(v) What is speed of B ?
(vi) Without actual calculation, can you infer which body is travelling faster ?
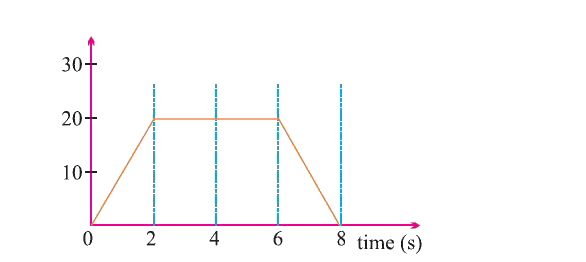
View SolutionThe velocity time graph for a particle is shown in figure. Draw acceleration time graph from it.
View Solution
Knowledge Check
The velocity - time graph of two bodies A and B is shown in figure. Choose correct statement.
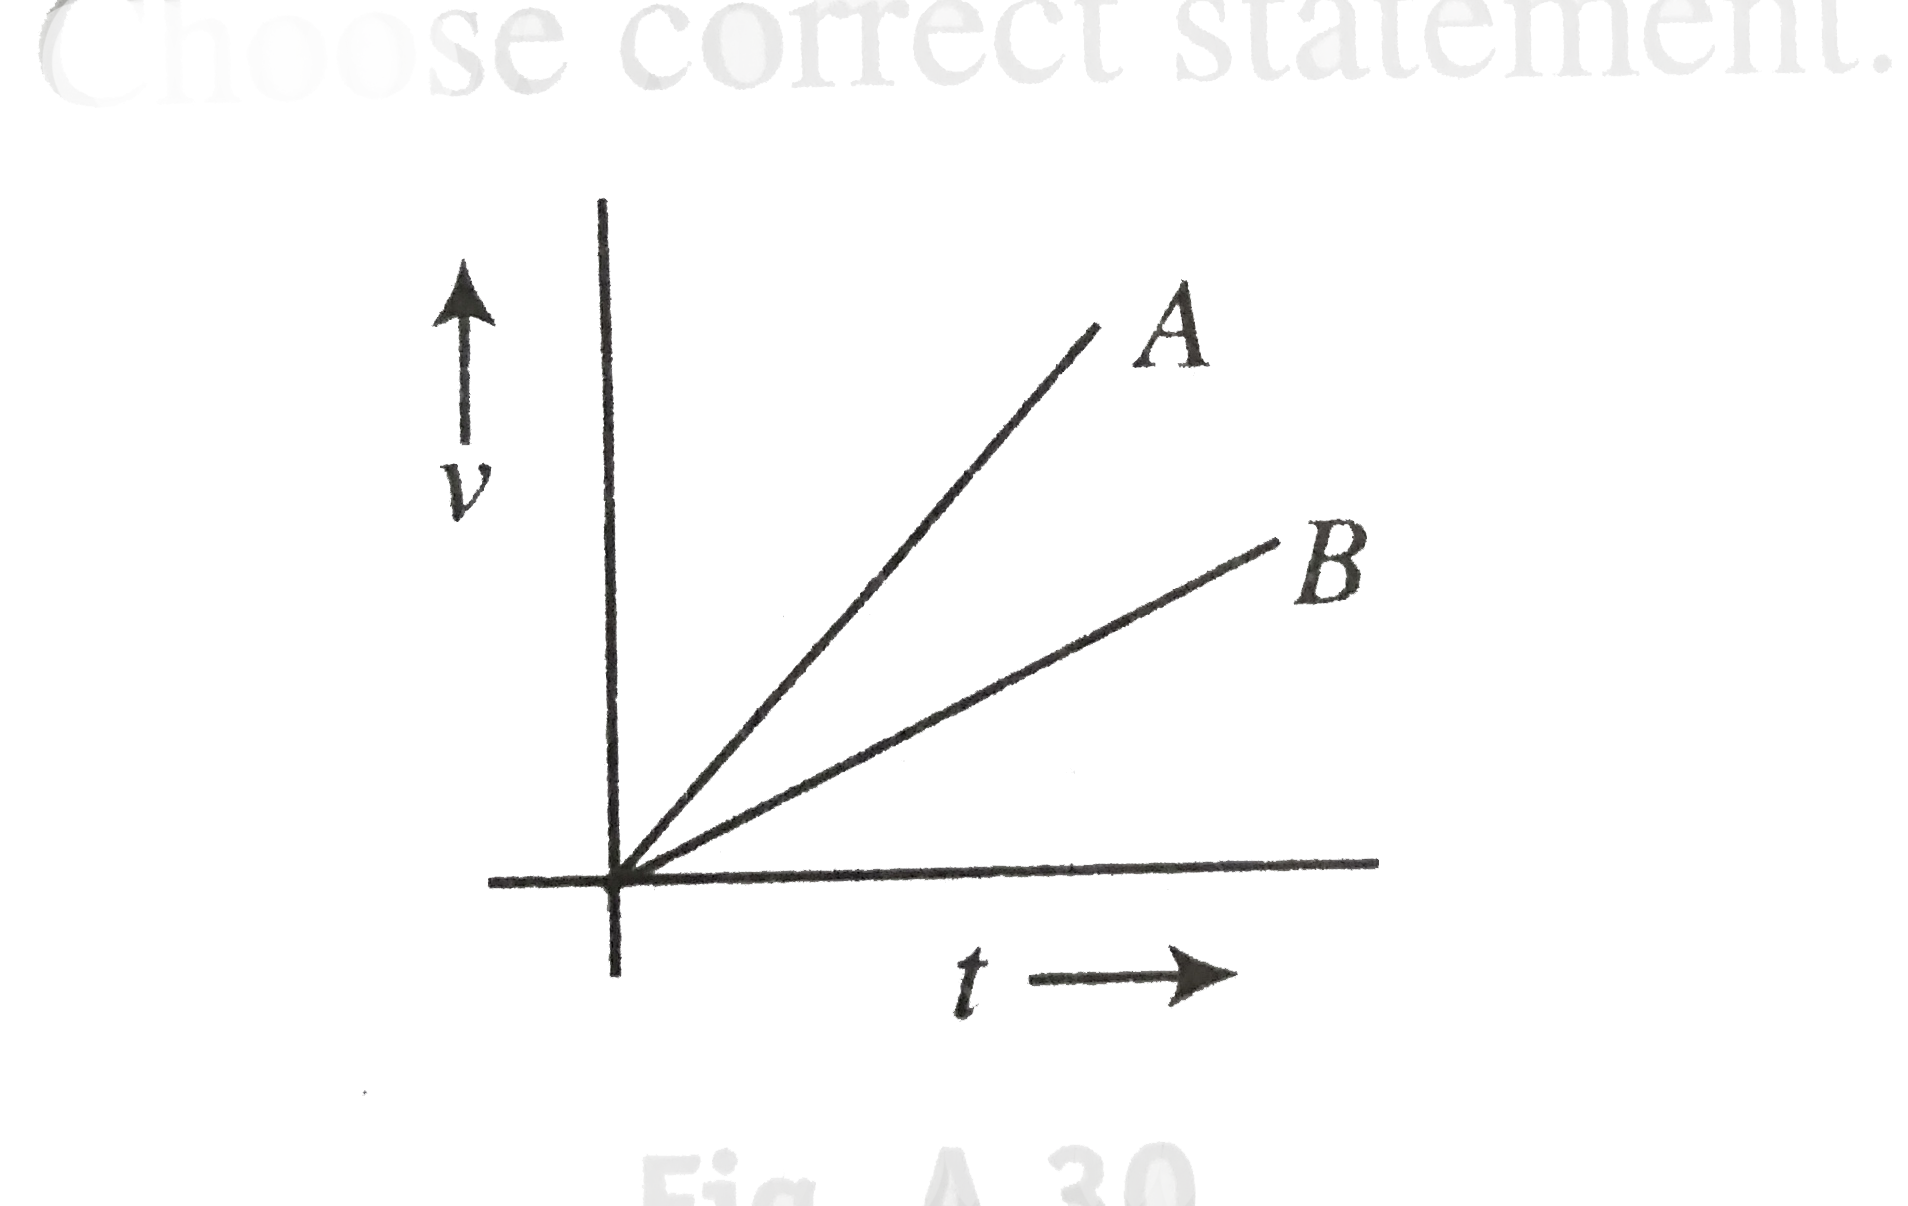 Aacceleration of Bgt acceleration of ABacceleration of A gt acceleration of BCboth are starting from same pointDA covers greater distance than B in the same time.
The velocity - time graph for two bodies A and B are shown in figure. Then, the acceleration of A and B are in the ratio
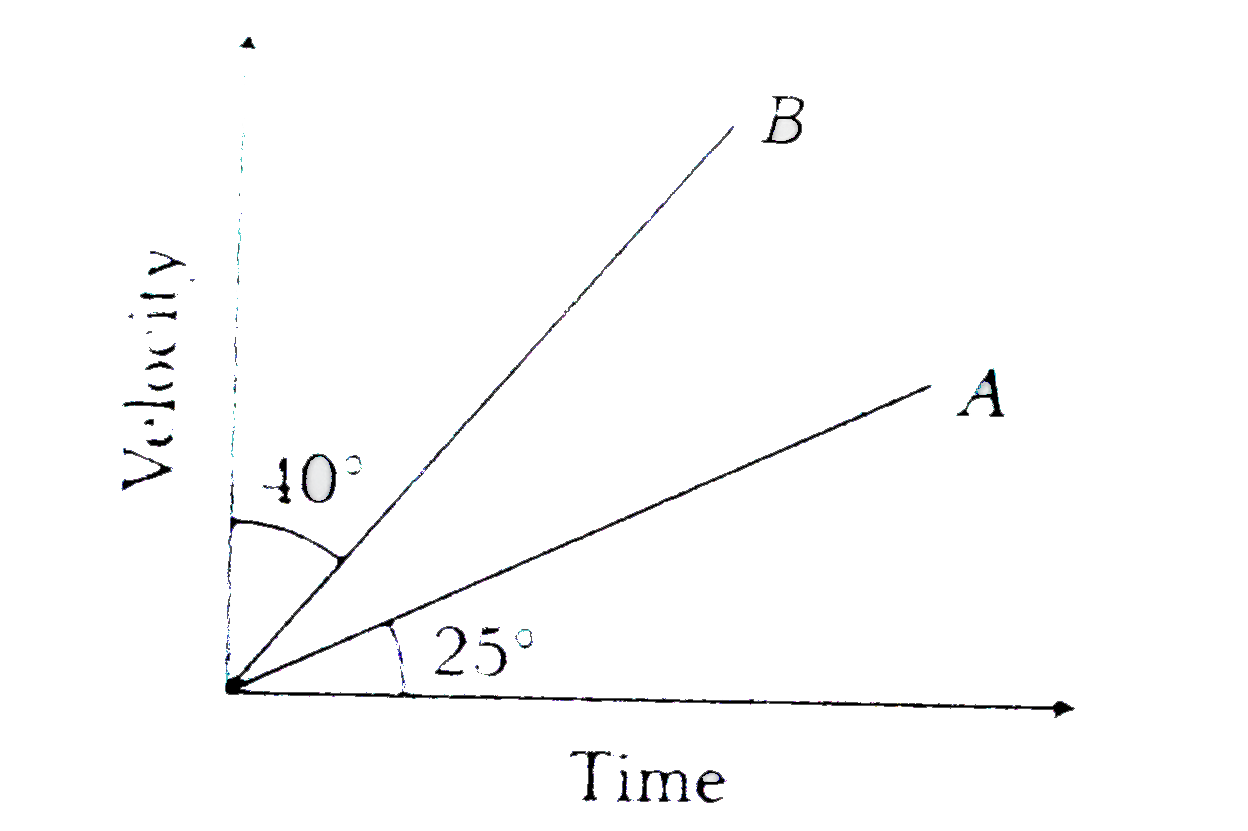 Asin25∘ to sin50∘Btan25∘ to tan40∘Ccos25∘ to cos50∘Dtan25∘ to tan50∘
The velocity-time graph of a body is shown in the figure, it implies that at point B
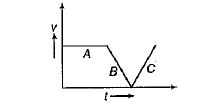 Athe force Is zeroBthere is a force toward motionCthere Is a force which opposes motionDthere is only gravitational force
If velocity-time graph of a body is as shown in figure, what is the nature of motion ?
View SolutionThe velocity time graph of a body is as showh in
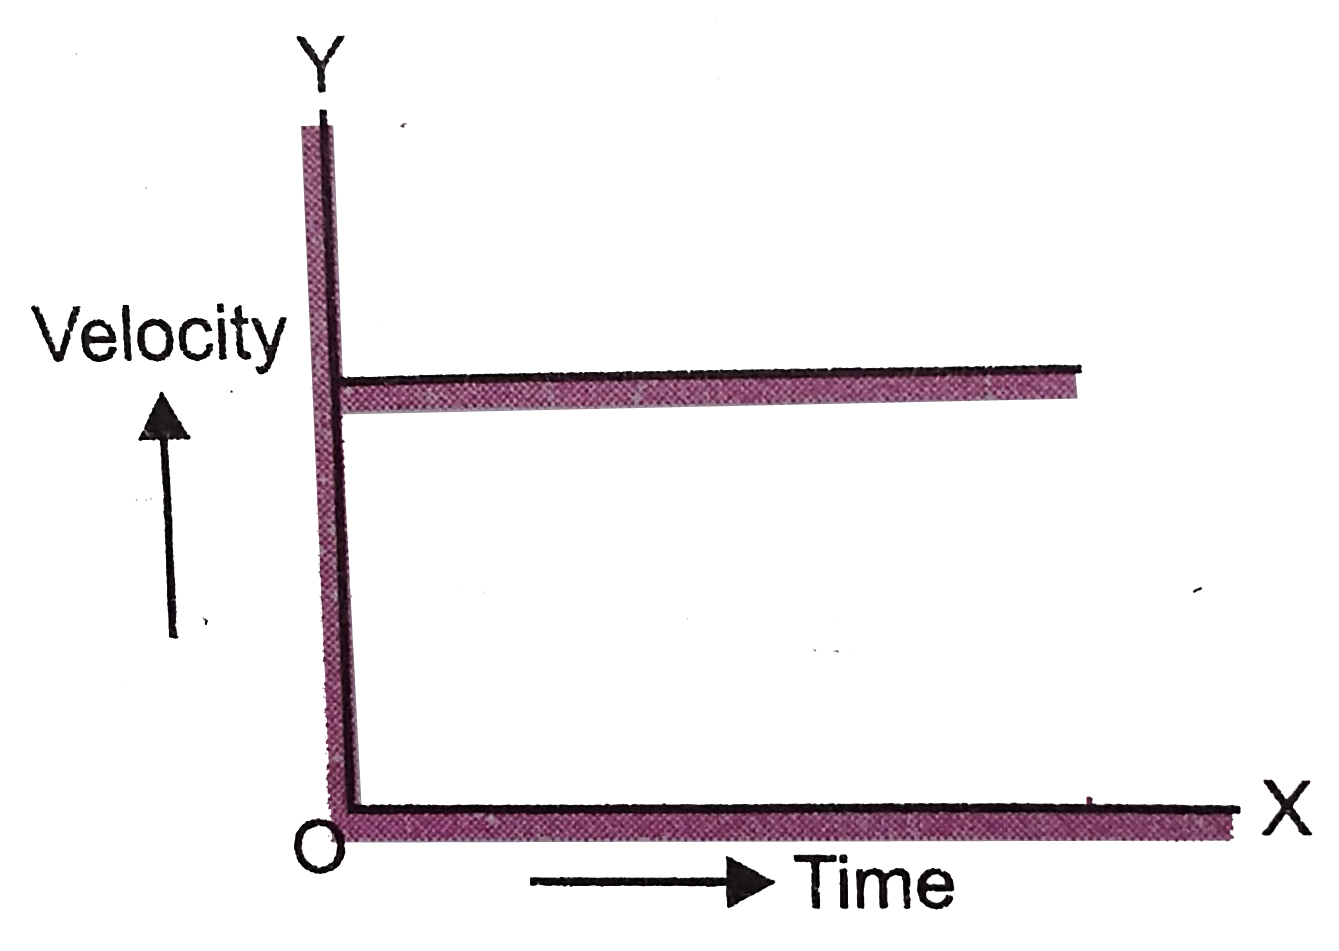
what would be the acceleration of the body ?
View SolutionStudy the speed-time graph of a car given alongside and answer the following questions :
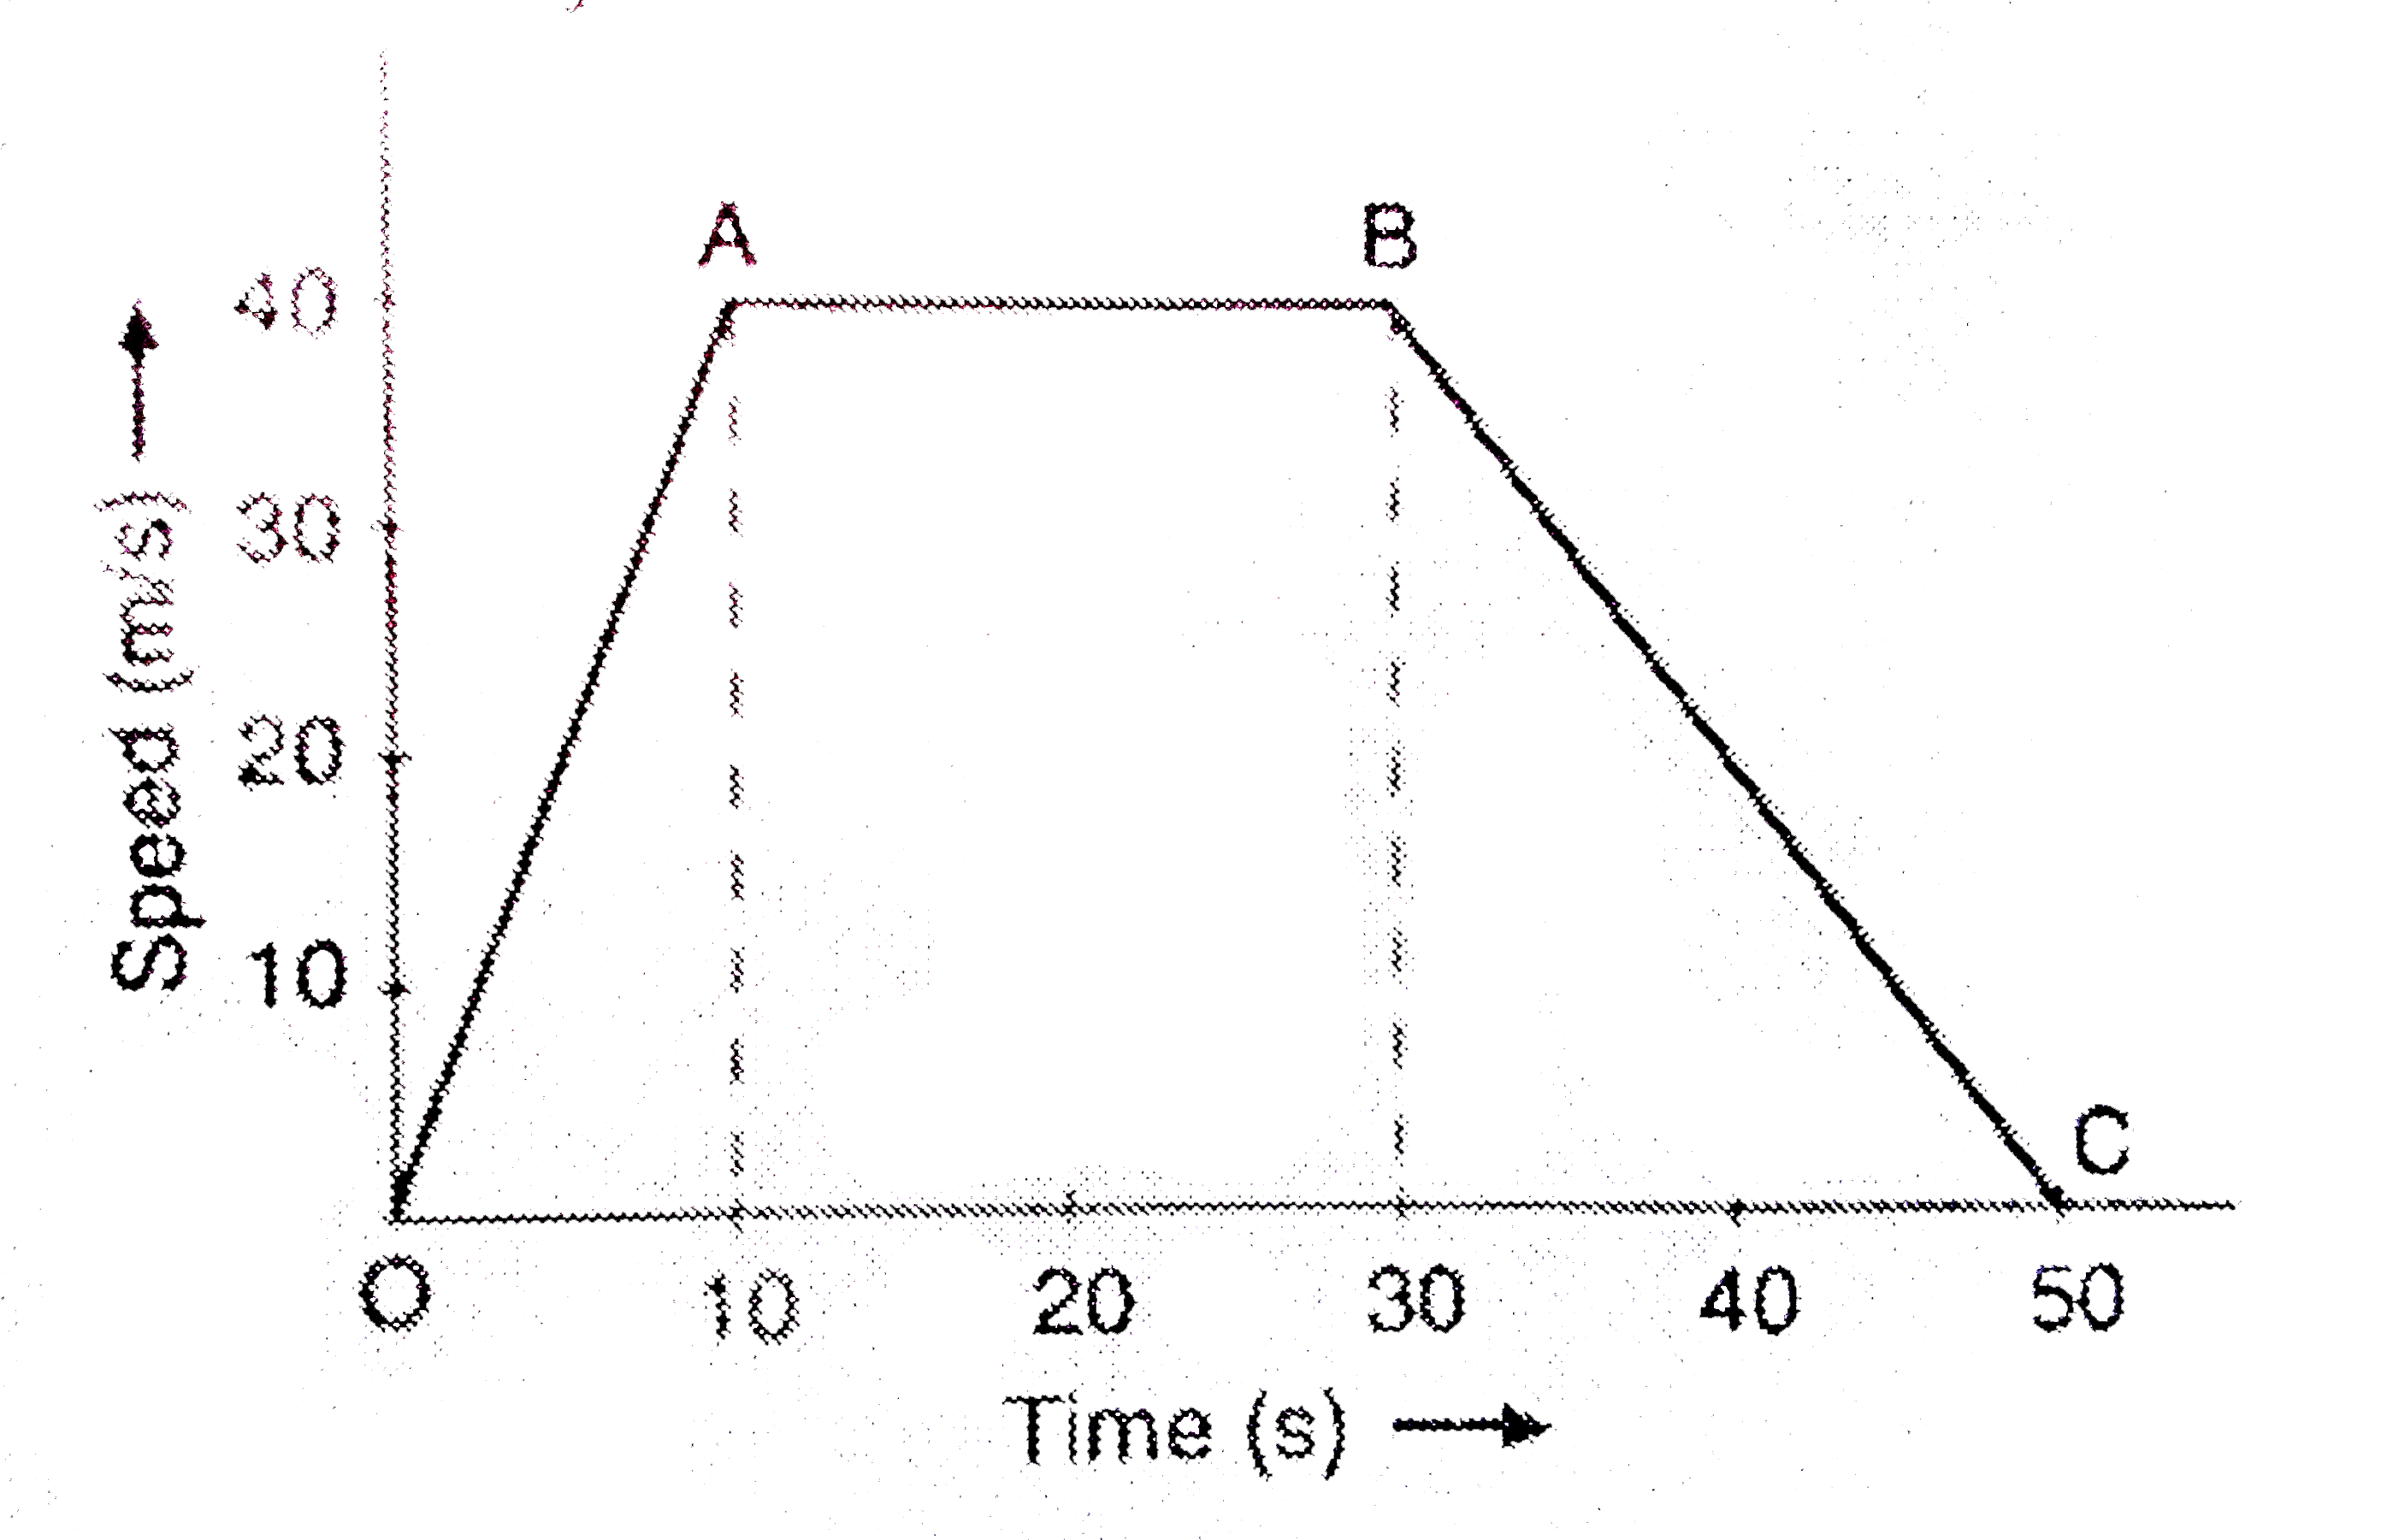
(i) What type of motion is represented by OA ?
(ii) What type of motion is represented by AB ?
(iii) What type of motion is represented by BC ?
(iv) What is the acceleration of car from O to A ?
(v) What is the acceleration of car from A to B ?
(vi) What is the retardation of car from B to C ?
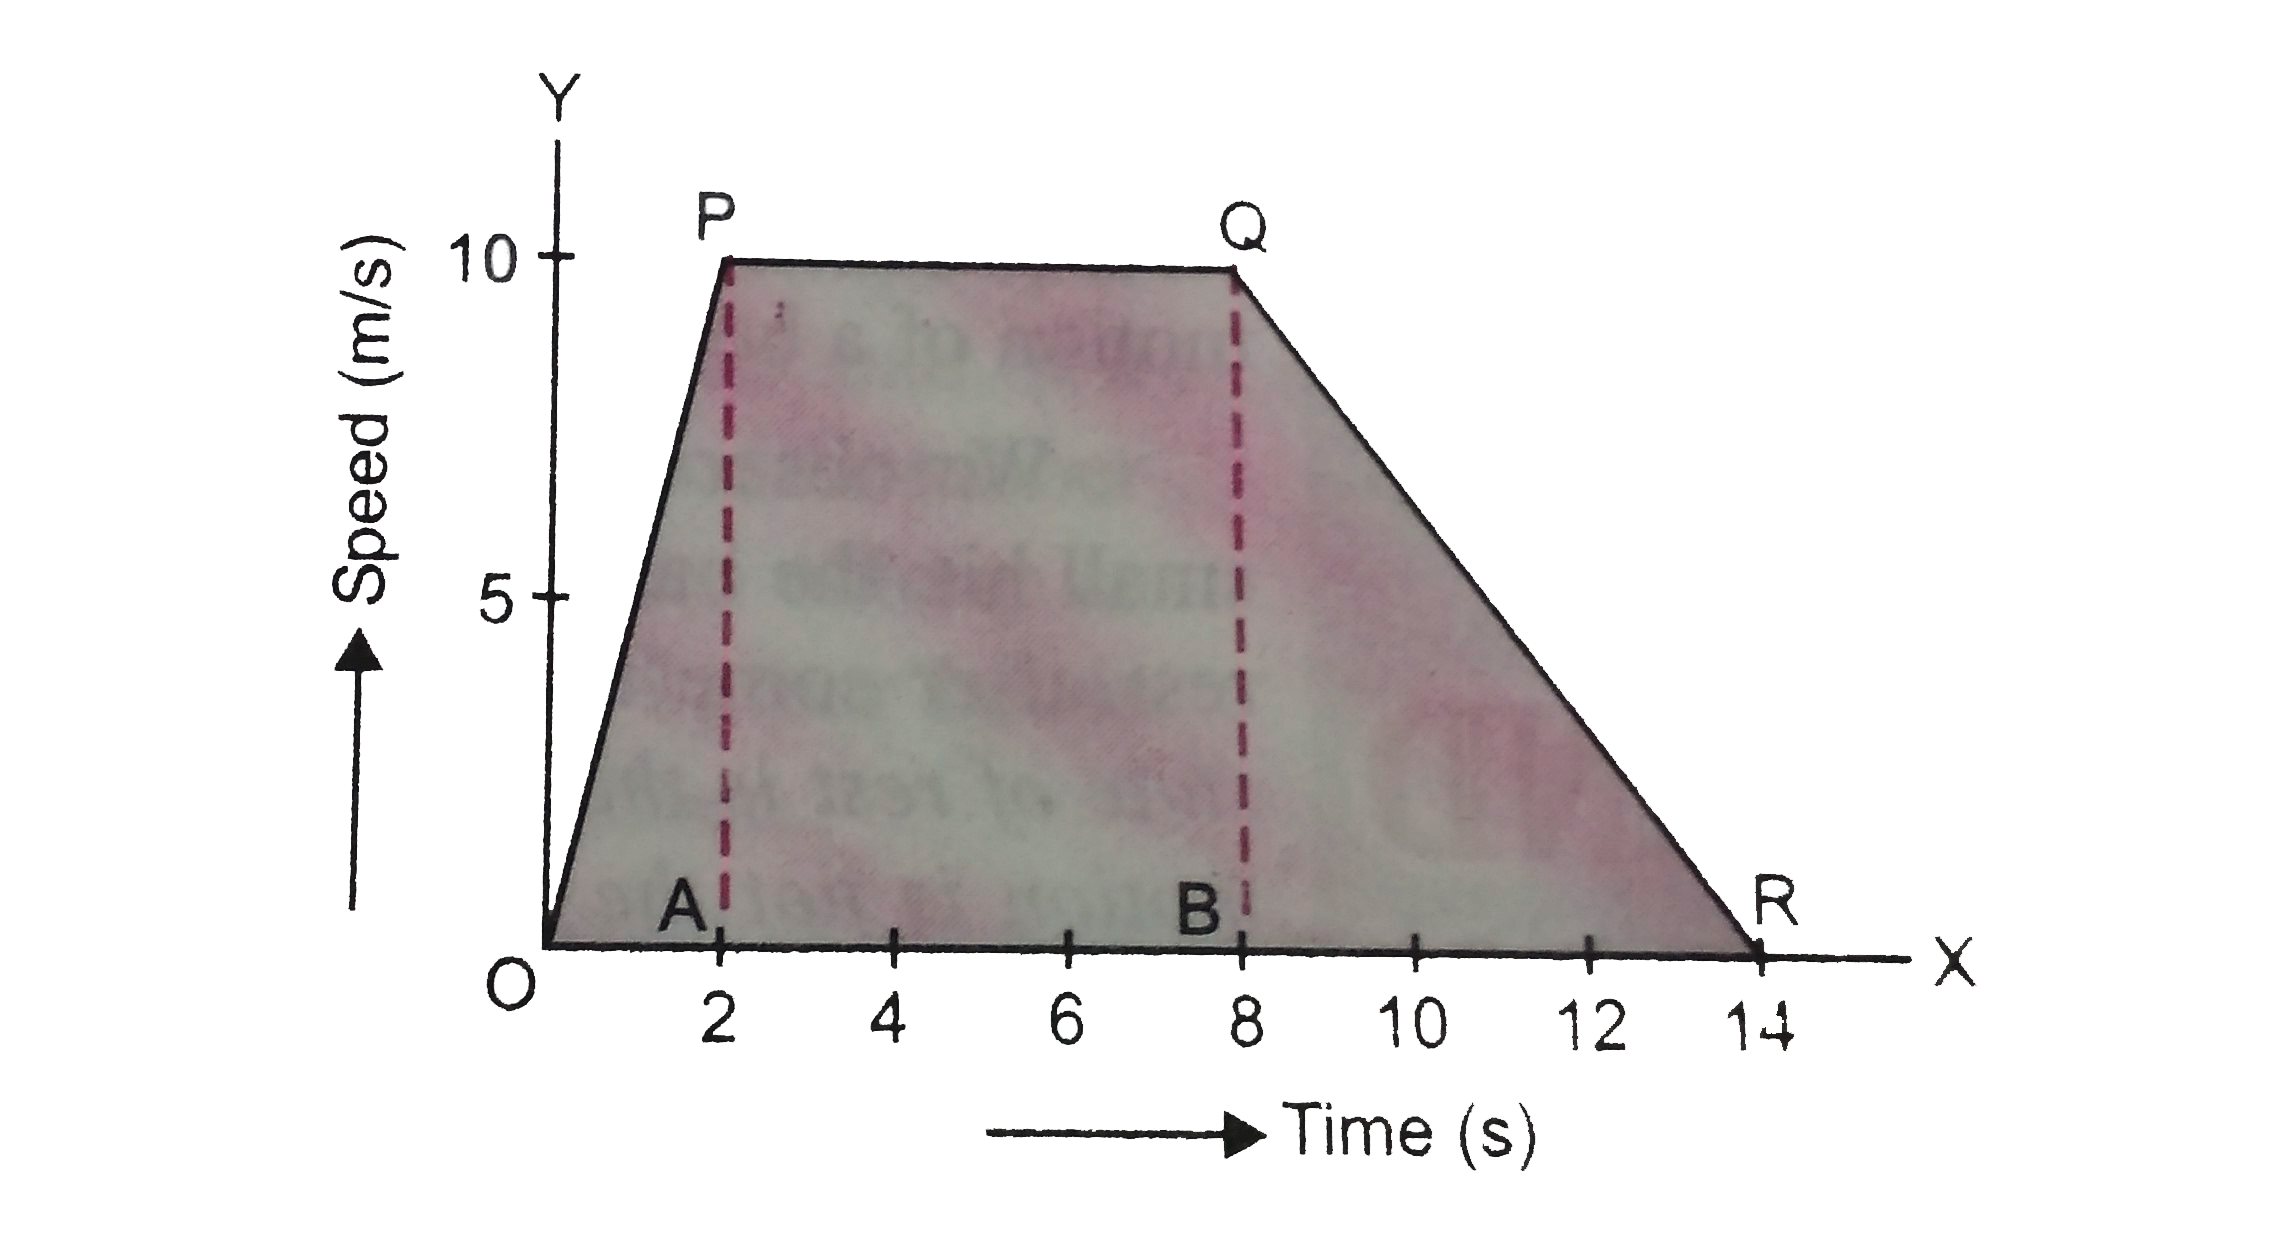
View SolutionThe speed time graph of a body is shown in Figure. Observer the graph carefully and answer the following :
(i) What kinds of motion are represented by OP,PQ and QR ?
(ii) Calculate acceleration of the body for the first 2sec.
(iii) Calculate retardation of body from 8s to 14s.
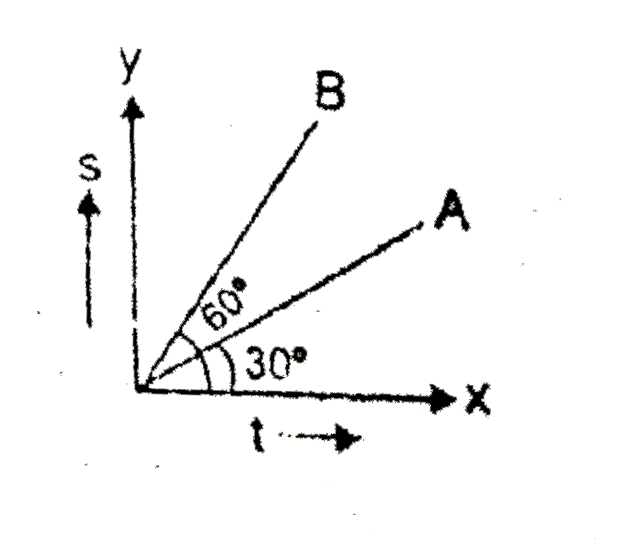
View SolutionThe displacement time graphs of two bodies A and B are shown in figure. The ratio of velocity of A to velocity of B,vA/vB is:
View Solution

