A ball is thrown vertically upwards. Which of the following plots represent the speed graph of the ball during its flight if the air resistence is not ignored?
Video Solution
Text Solution
When a stone is thrown vertically upwards, its velocity goes on decreasing at a constant rate of g=10m/s2. At the highest point, velocity =0. From the highest point, the stone falls down and its velocity goes on increasing at a constant rate of g=10m/s2. The velocity time graph for upward motion is straight AB and velocity time graph for downward motion is straight line BC.
|
Topper's Solved these Questions
- MOTIONBook:PRADEEPChapter:MOTIONExercise:Long answer question
Explore 12 Videos
- MOTIONBook:PRADEEPChapter:MOTIONExercise:very short answer queation
Explore 25 Videos
- MOTIONBook:PRADEEPChapter:MOTIONExercise:NCERT Exercises
Explore 10 Videos
- GRAVITATIONBook:PRADEEPChapter:GRAVITATIONExercise:Model Test paper (1)
Explore 36 Videos
- SOUNDBook:PRADEEPChapter:SOUNDExercise:Model Test (sec - B)
Explore 12 Videos
Similar Questions
Knowledge Check
A ball is thrown vertically upwards. Which of the following plots represents the speed-time graph of the ball during its height if the air resistance is not ingnored ?
A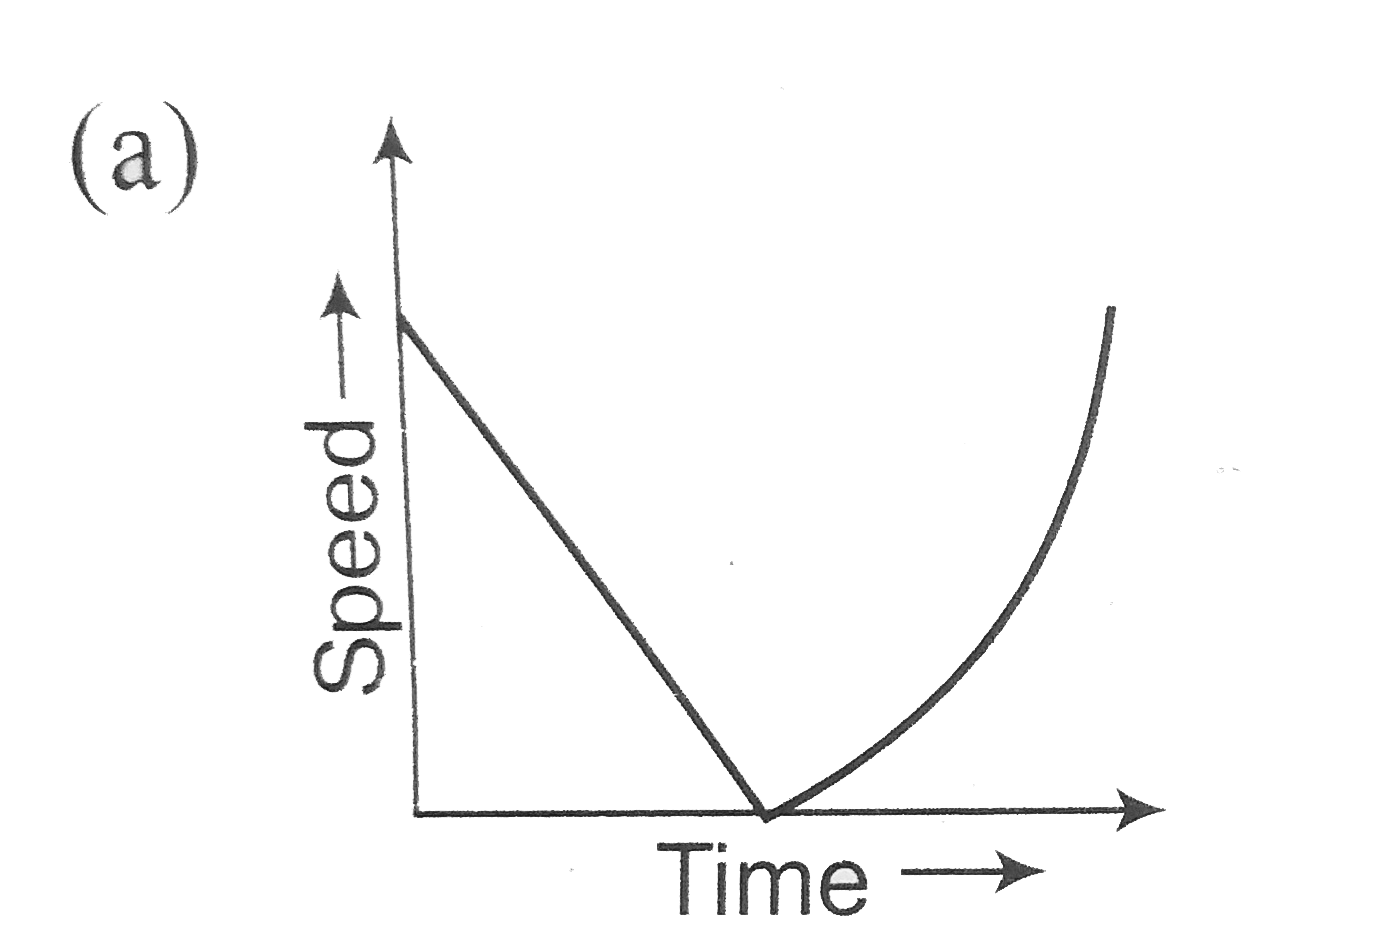 .B
.B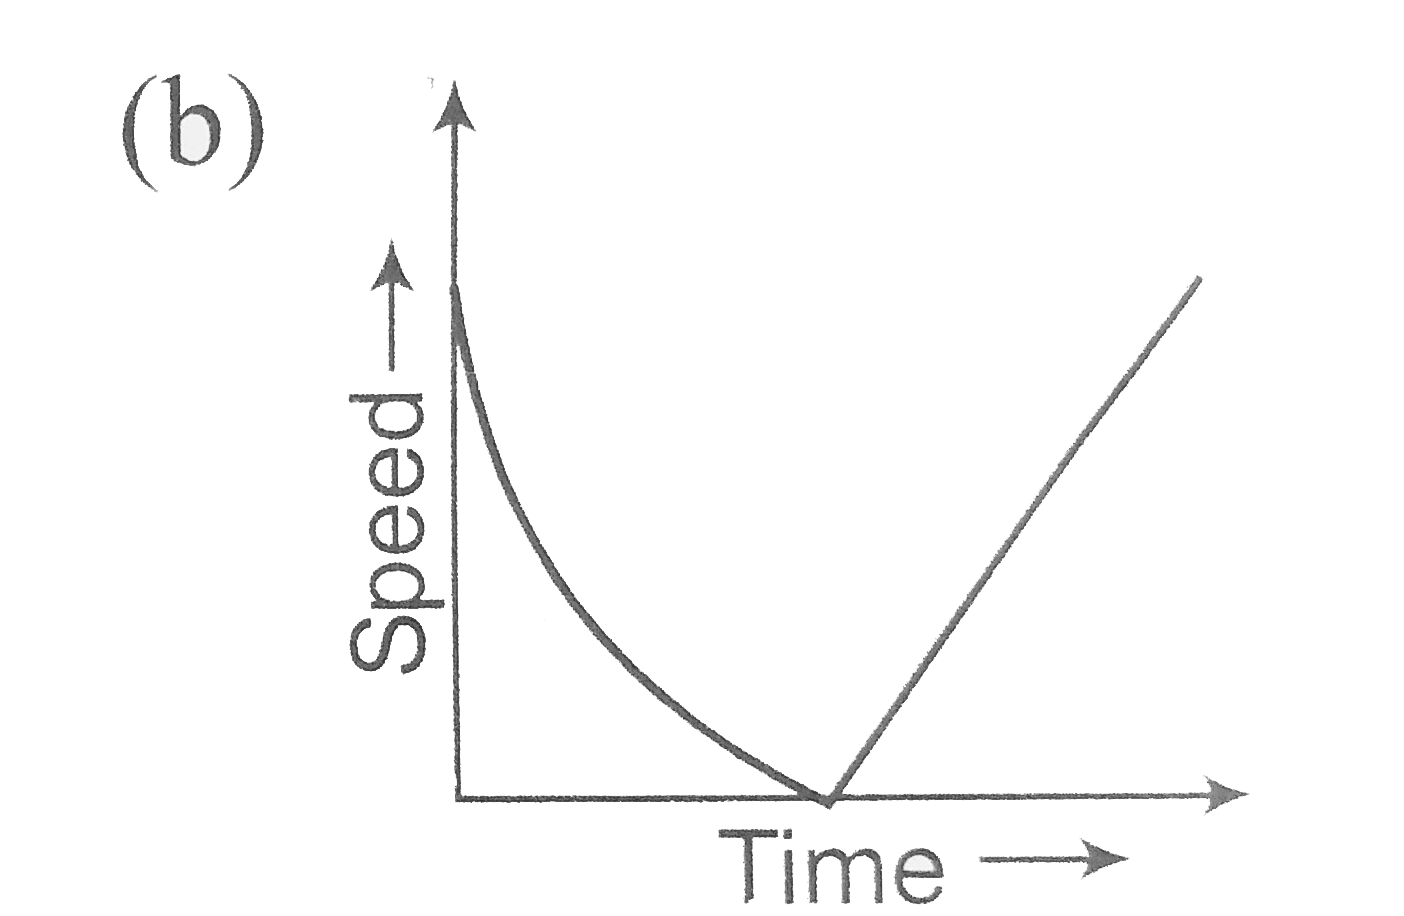 .C
.C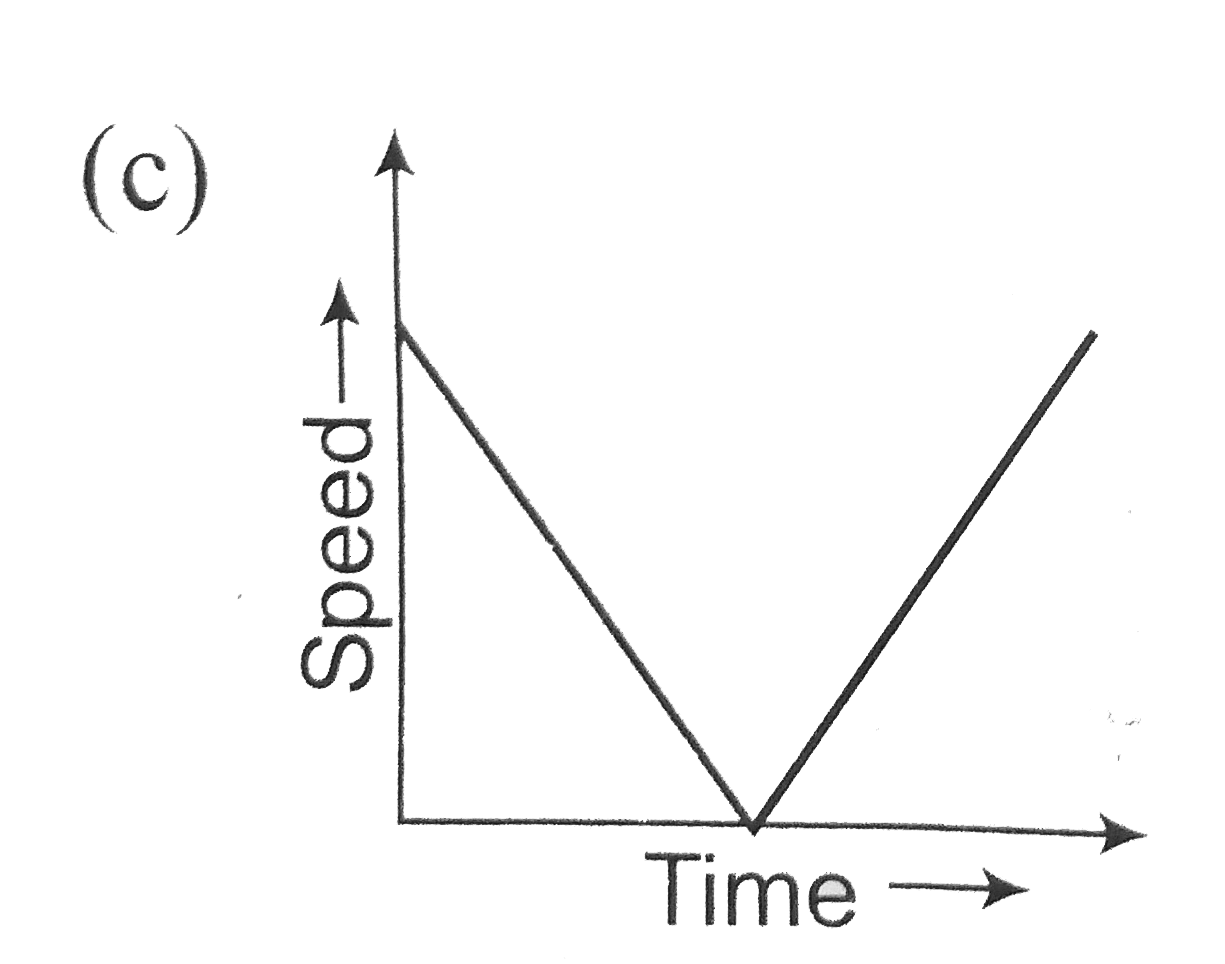 .D
.D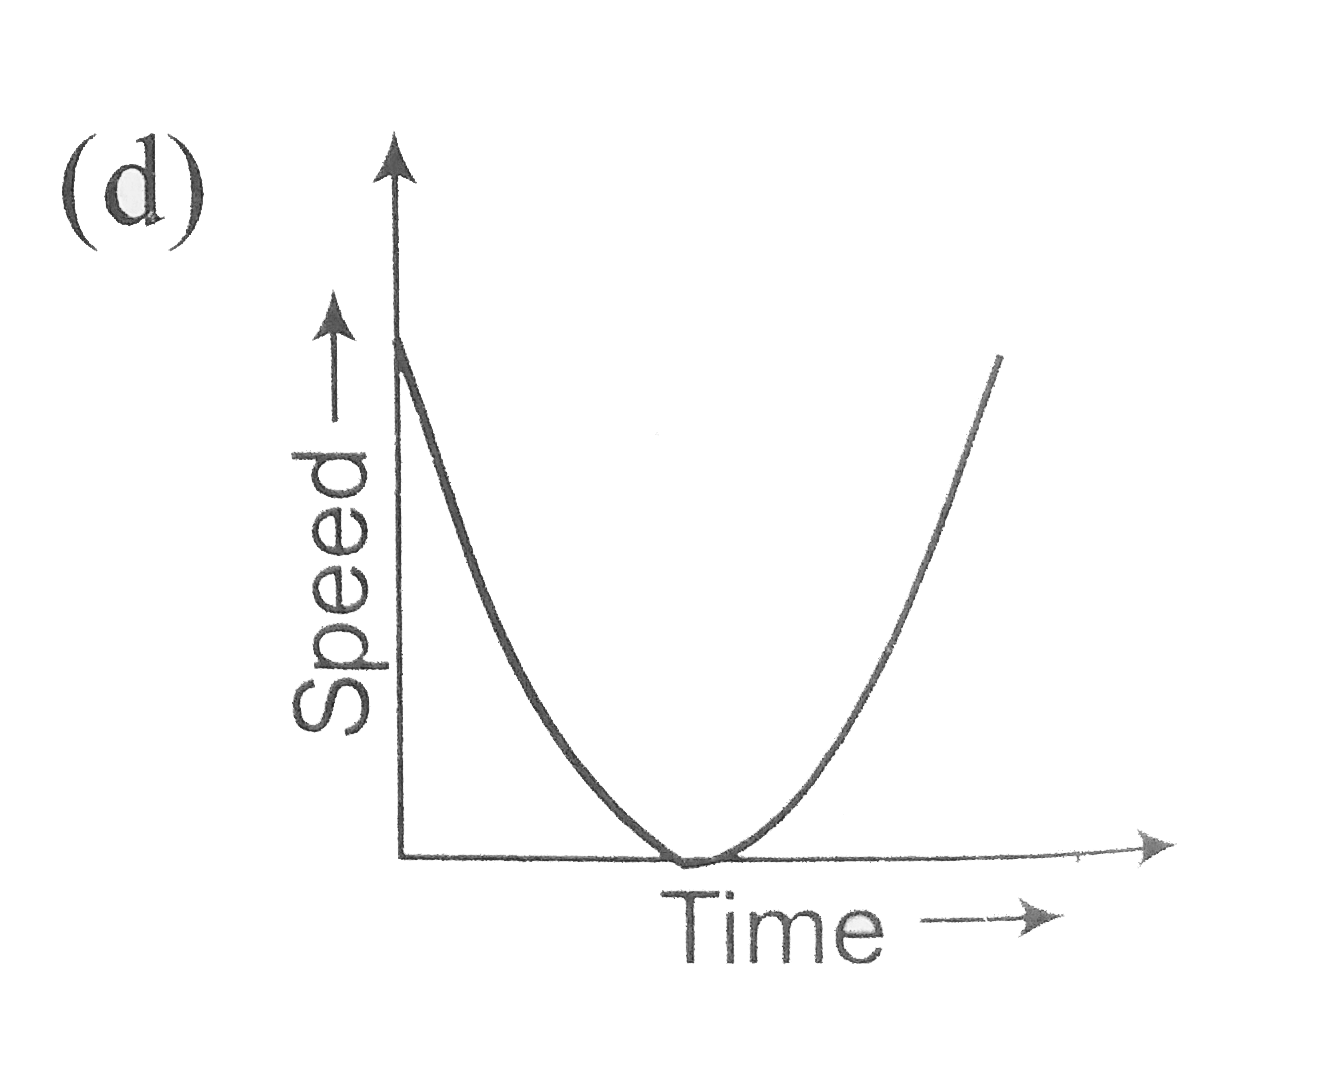 .
.A ball is thrown vertically upwards. Which of the following graph/graphs represent velocity time graph of the ball during its flight ( air resistance is neglected).
A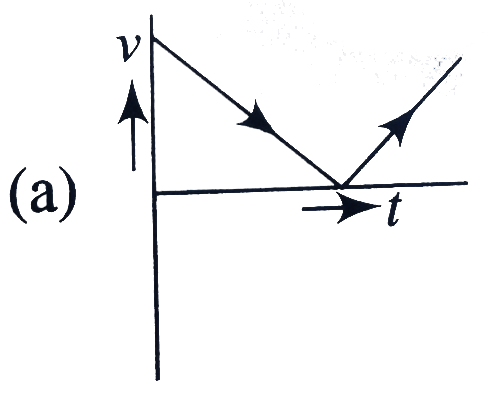 B
B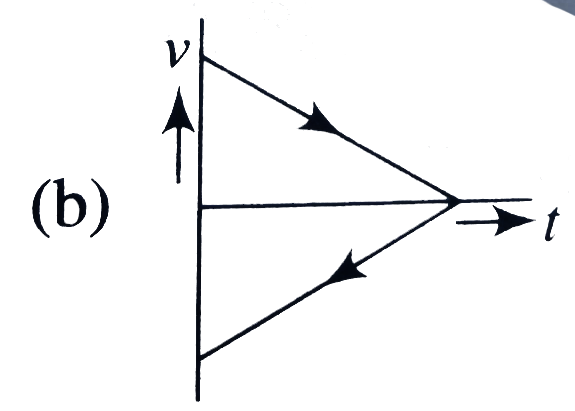 C
C D
D
A body nis thrown vertically upward. Which of the following graphs correctly/represents the velocity of the body with time?
A B
B C
C D
D
A ball is thrown vertically upward. What is the magnitude of velocity at the highest point ?
View SolutionA body is thrown vertically upwards. Which one of the following graphs correctly represent the velocity vs time?
View SolutionWhich of the following graphs show the v−t graph of a ball thrown upwards ?
View SolutionA ball is projected vertically up with an initial velocity. Which of the following graphs represents the KE of the ball?
View SolutionA ball is thrown vertically upwards under gravity. The velocity-time variation is represented by the graph
View Solution

