The oscillation of a body on a smooth horizontal surface is represented by the equation
X=Acos(ωt)
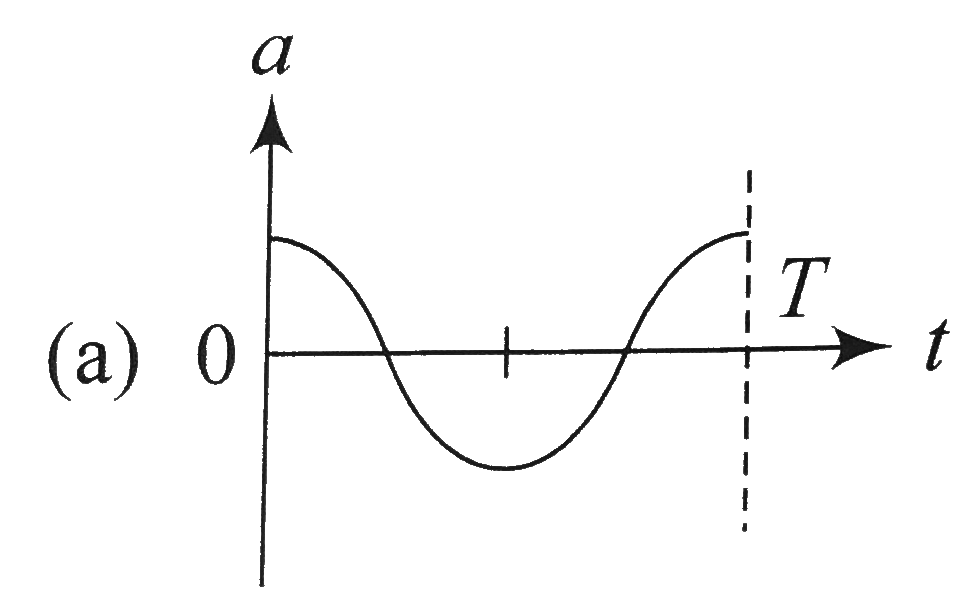
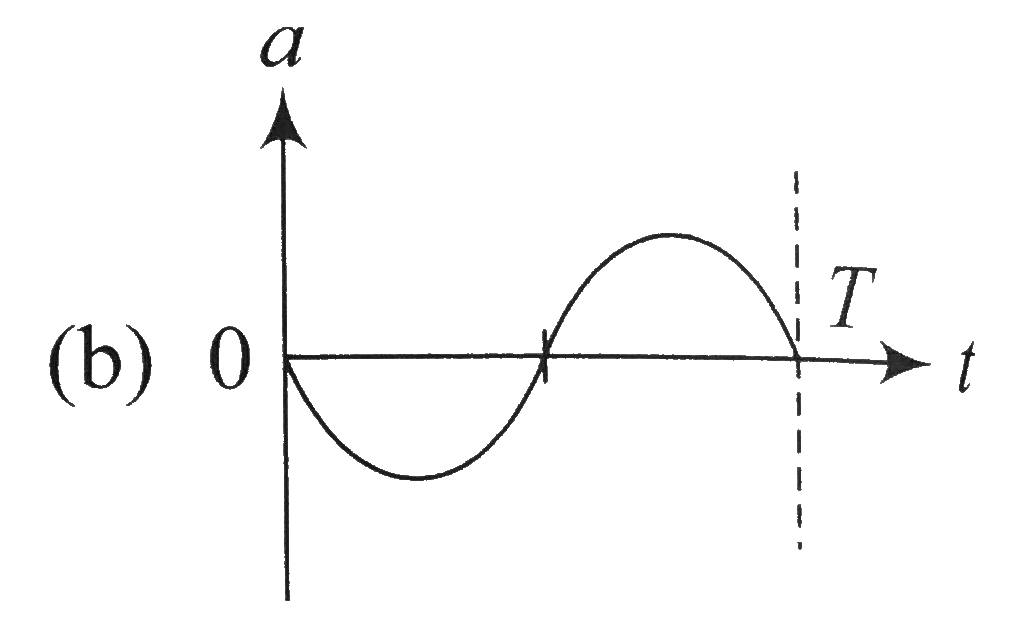
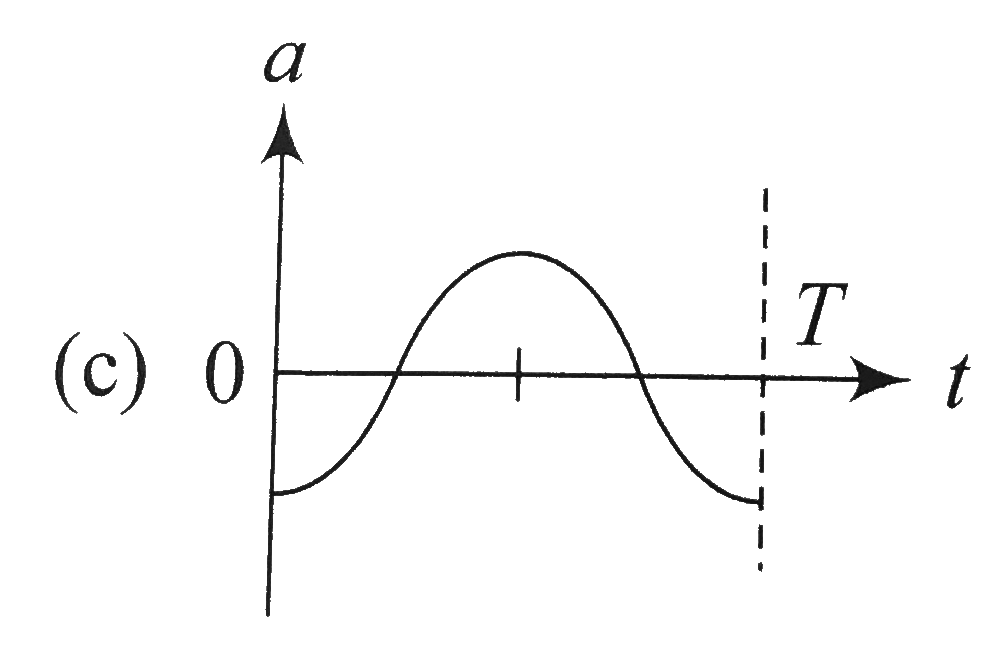
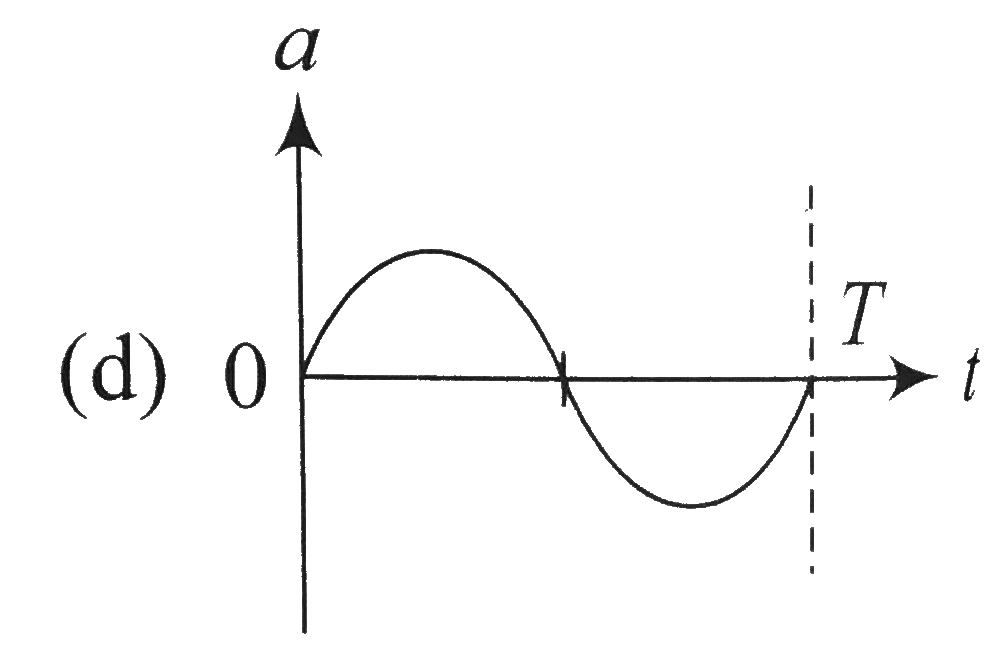
which one of the following graph shown correctly the variation a with t?
The correct Answer is:C
Displacement ,x=Acos(ωt) (given)
Acceleration , a=dvdt=−Aω2cos(ωt)
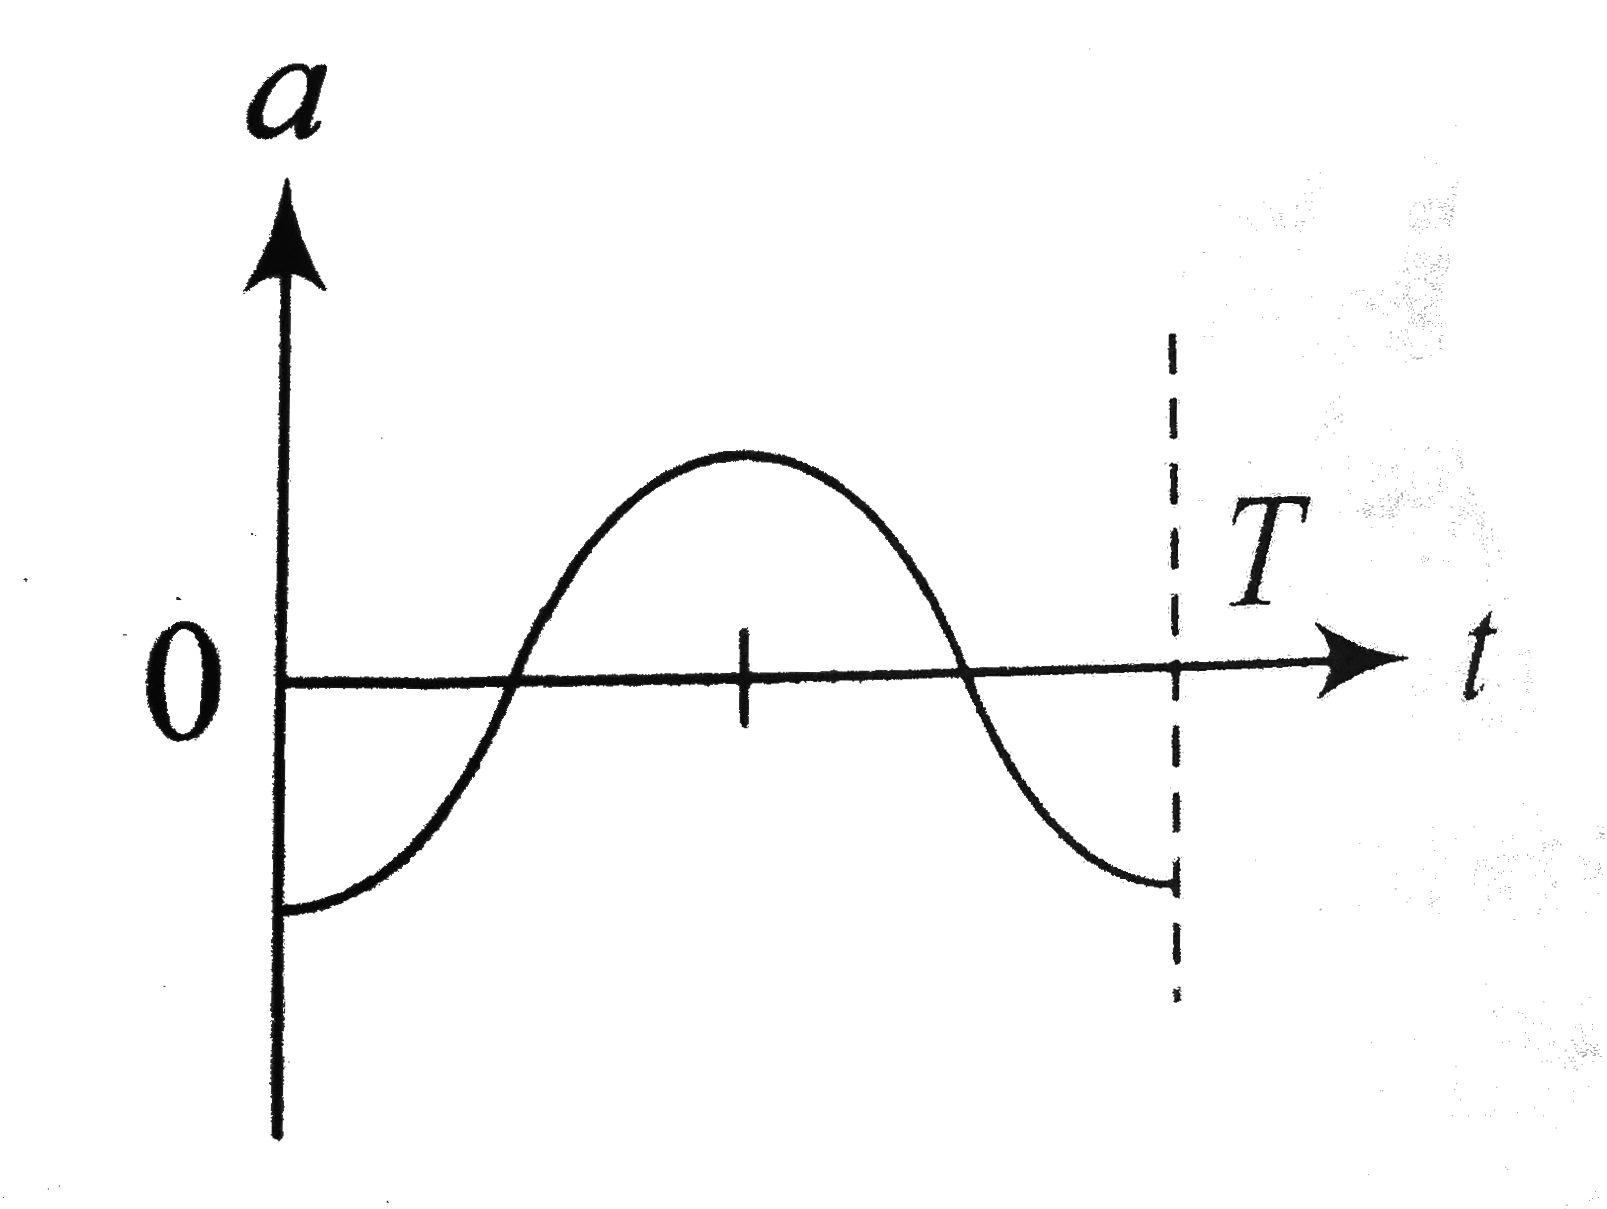
Hence graph c correctly depice the variation of a withh t
Topper's Solved these Questions
- OSCILLATION AND SIMPLE HARMONIC MOTIONBook:A2ZChapter:OSCILLATION AND SIMPLE HARMONIC MOTIONExercise:AIIMS Questions
Explore 24 Videos
- OSCILLATION AND SIMPLE HARMONIC MOTIONBook:A2ZChapter:OSCILLATION AND SIMPLE HARMONIC MOTIONExercise:Chapter Test
Explore 29 Videos
- OSCILLATION AND SIMPLE HARMONIC MOTIONBook:A2ZChapter:OSCILLATION AND SIMPLE HARMONIC MOTIONExercise:Assertion Reasoning
Explore 22 Videos
- NEWTONS LAWS OF MOTIONBook:A2ZChapter:NEWTONS LAWS OF MOTIONExercise:Chapter Test
Explore 30 Videos
- PROPERTIES OF MATTERBook:A2ZChapter:PROPERTIES OF MATTERExercise:Chapter Test
Explore 29 Videos
Similar Questions
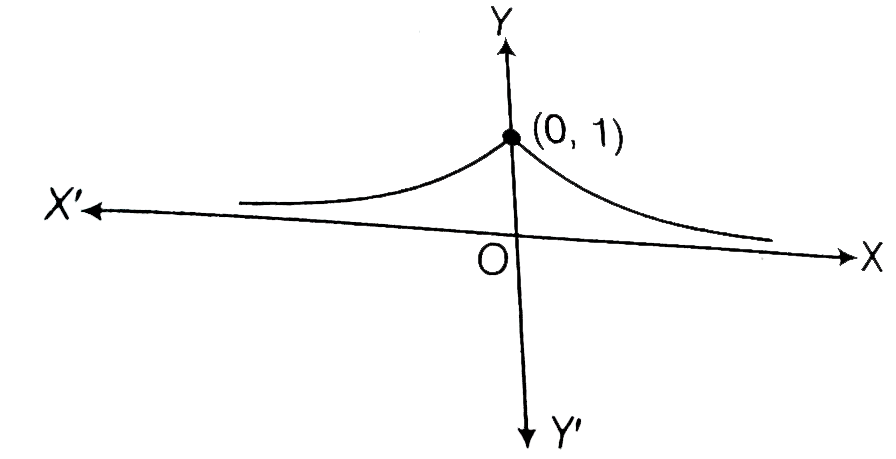
Which one of the following function best represent the graphs as shown below?
View SolutionThe oscillationof a body on a smooth horizontal surface is represented by the equation
x=Acosωt
where x= displacement at time t, ω= frequency of oscillation. Which one of the following graphs shows correctly the variation of acceleration a with time t ?
View Solution
Knowledge Check
The oscillation of a body on a smooth horizontal surface is represented by the equation
X=Acos(ωt)
which one of the following graph shown correctly the variation a with t?A B
B C
C D
D
The oscillation of a body on a smooth horizontal surface is represented by the equation, X=Acos(ωt)
where X = displacement at time t
ω = frequency of oscillation
Which one of the following graphs shows correctly the variation a with t ?A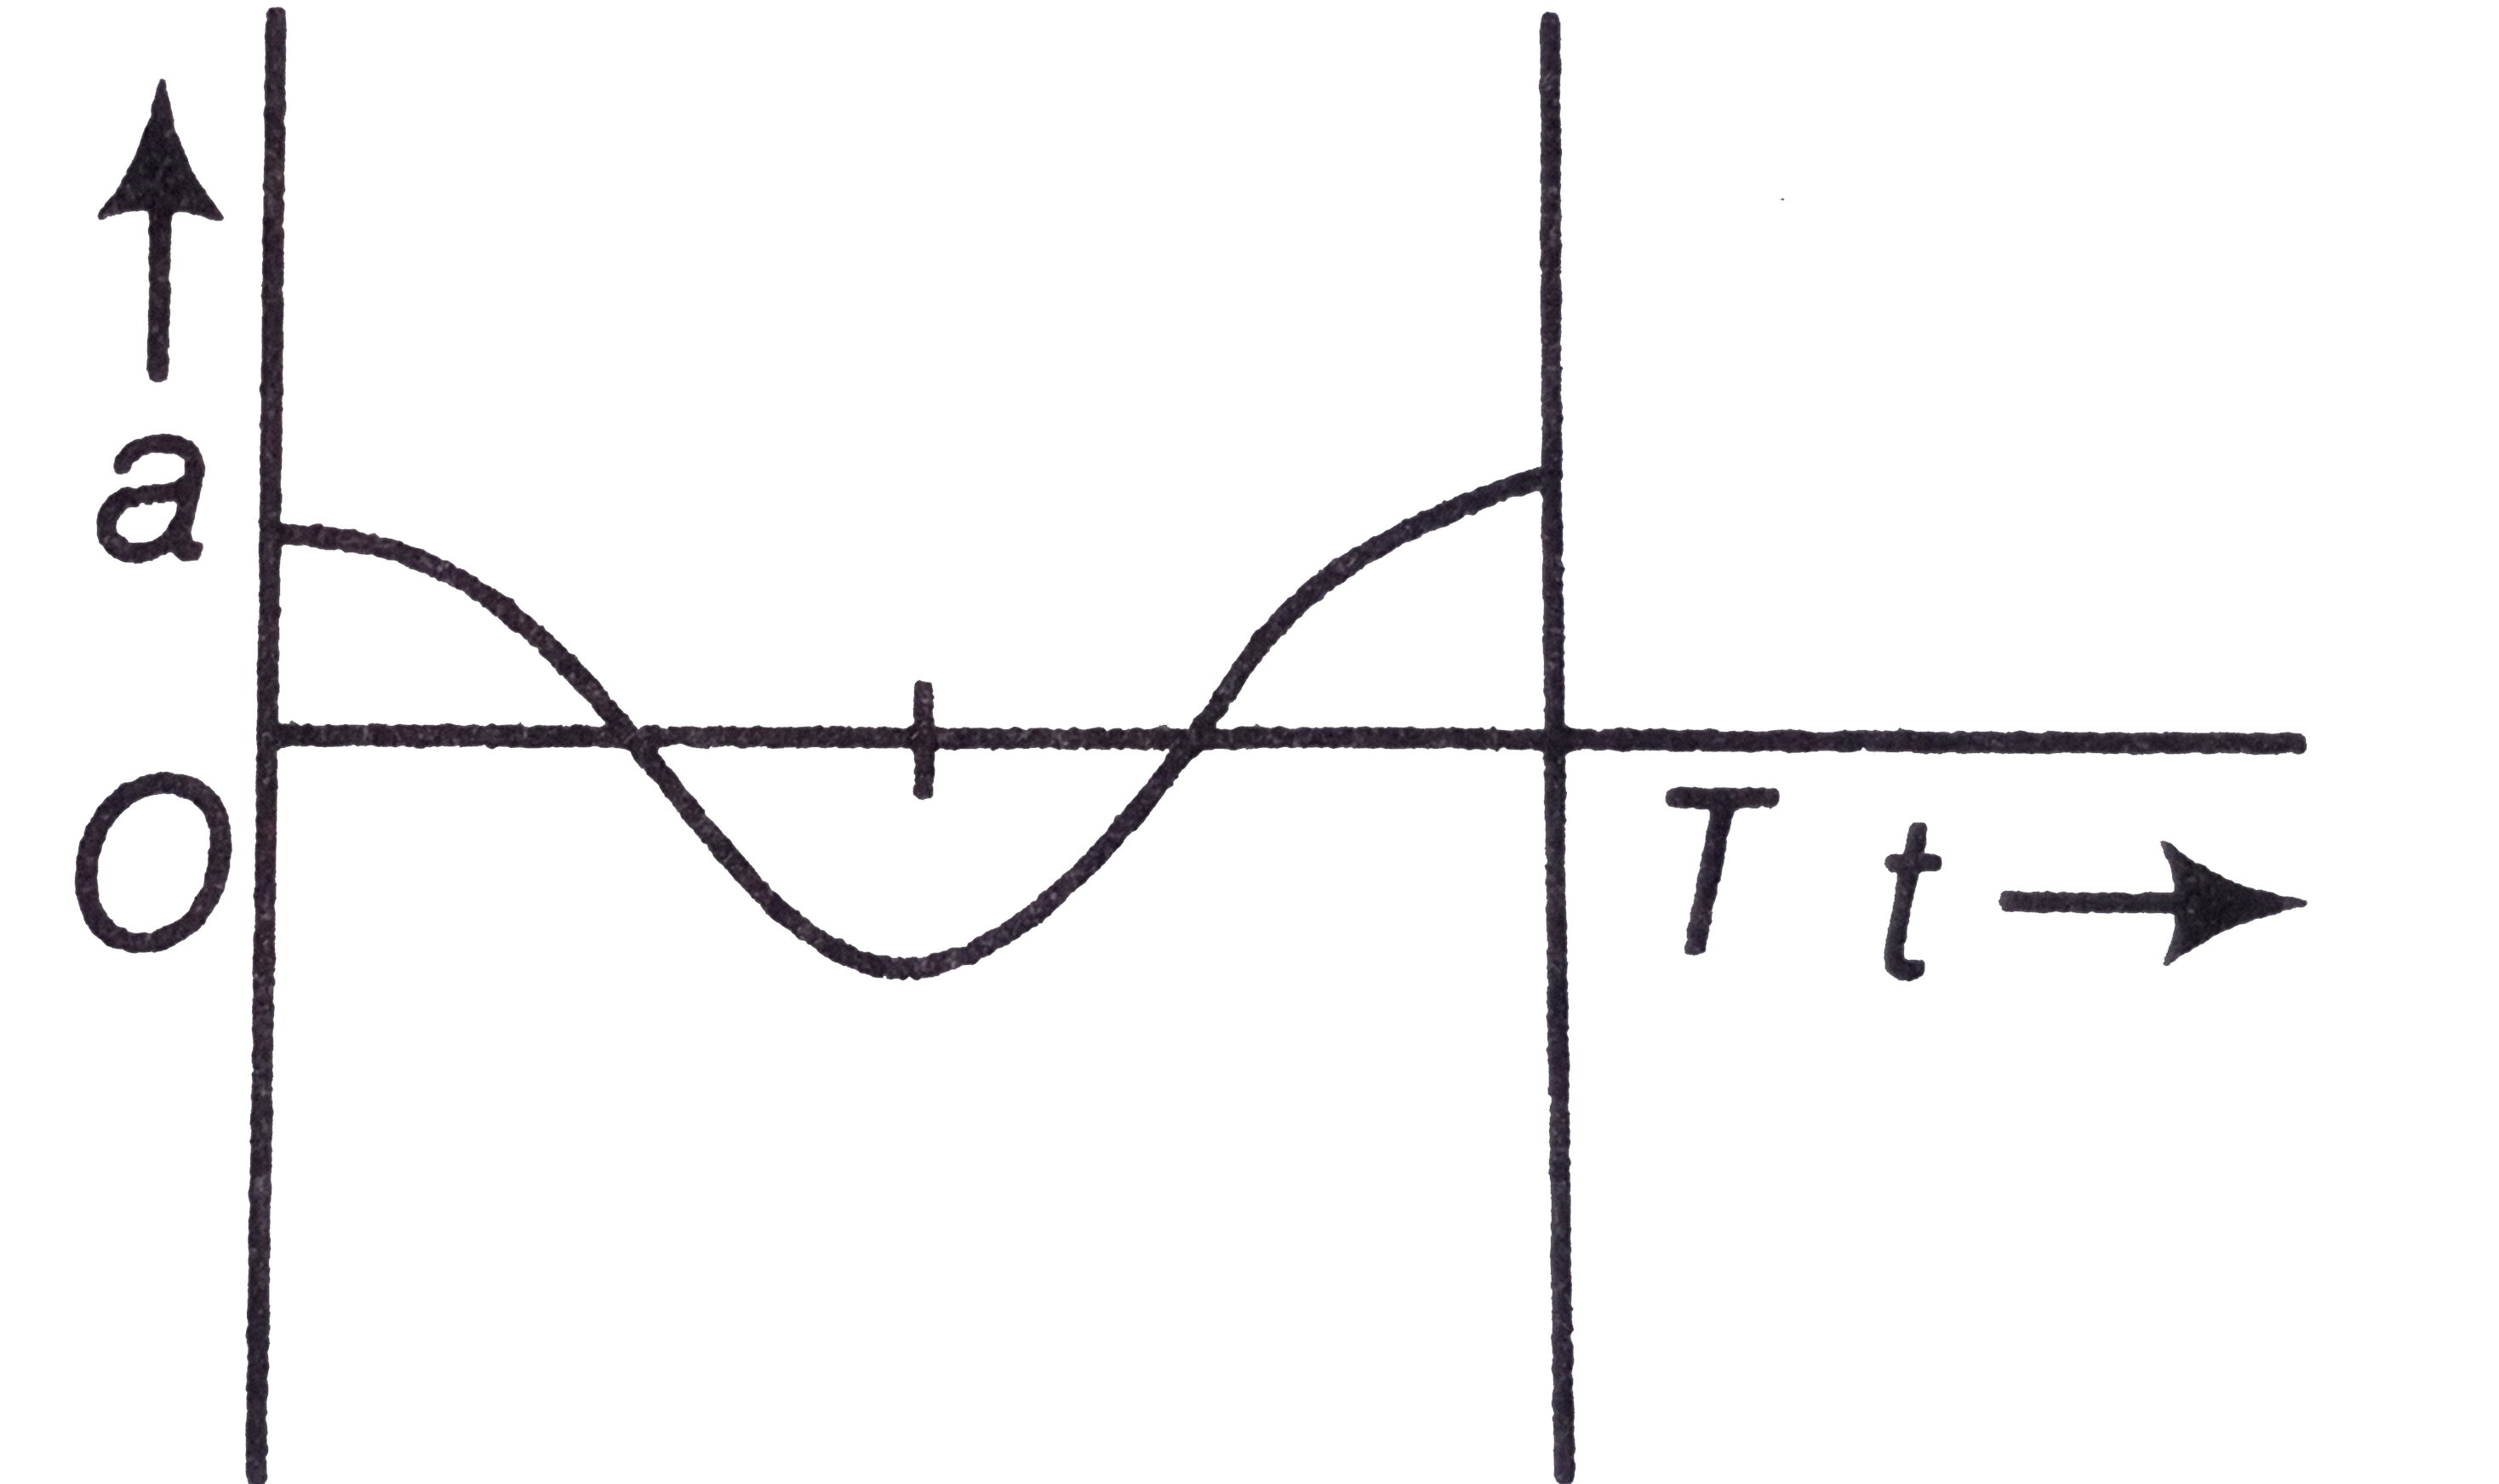 B
B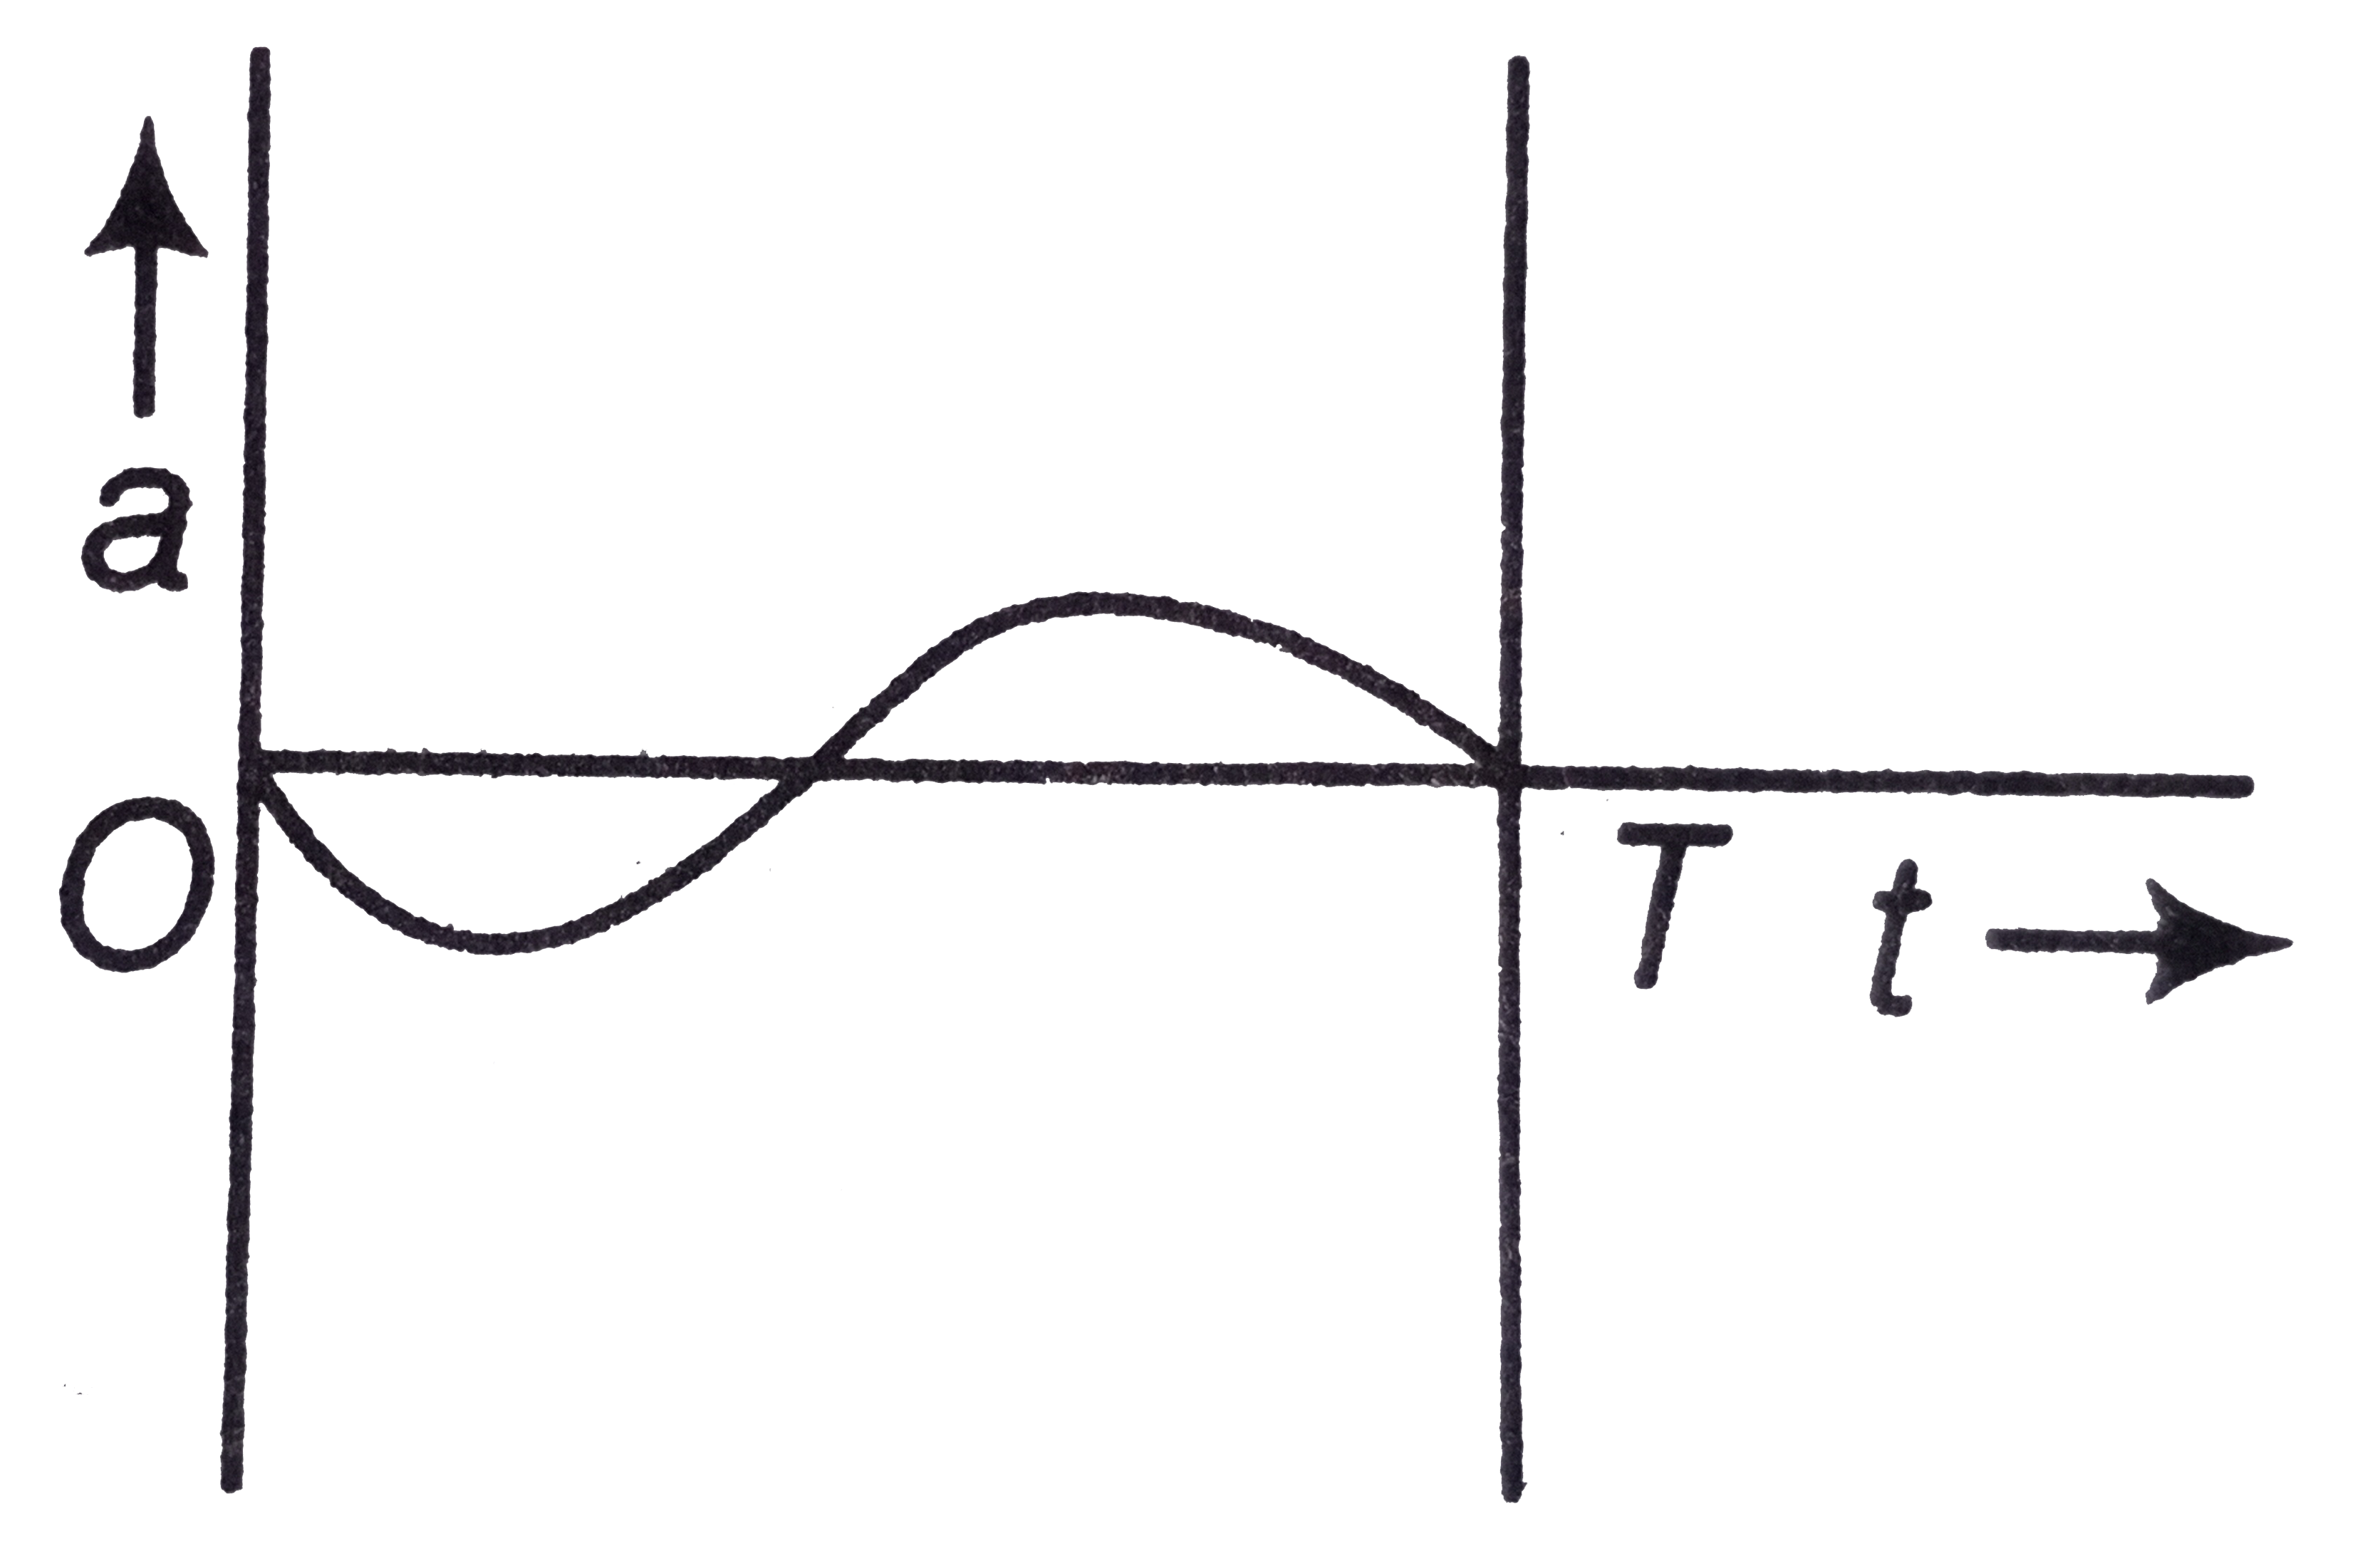 C
C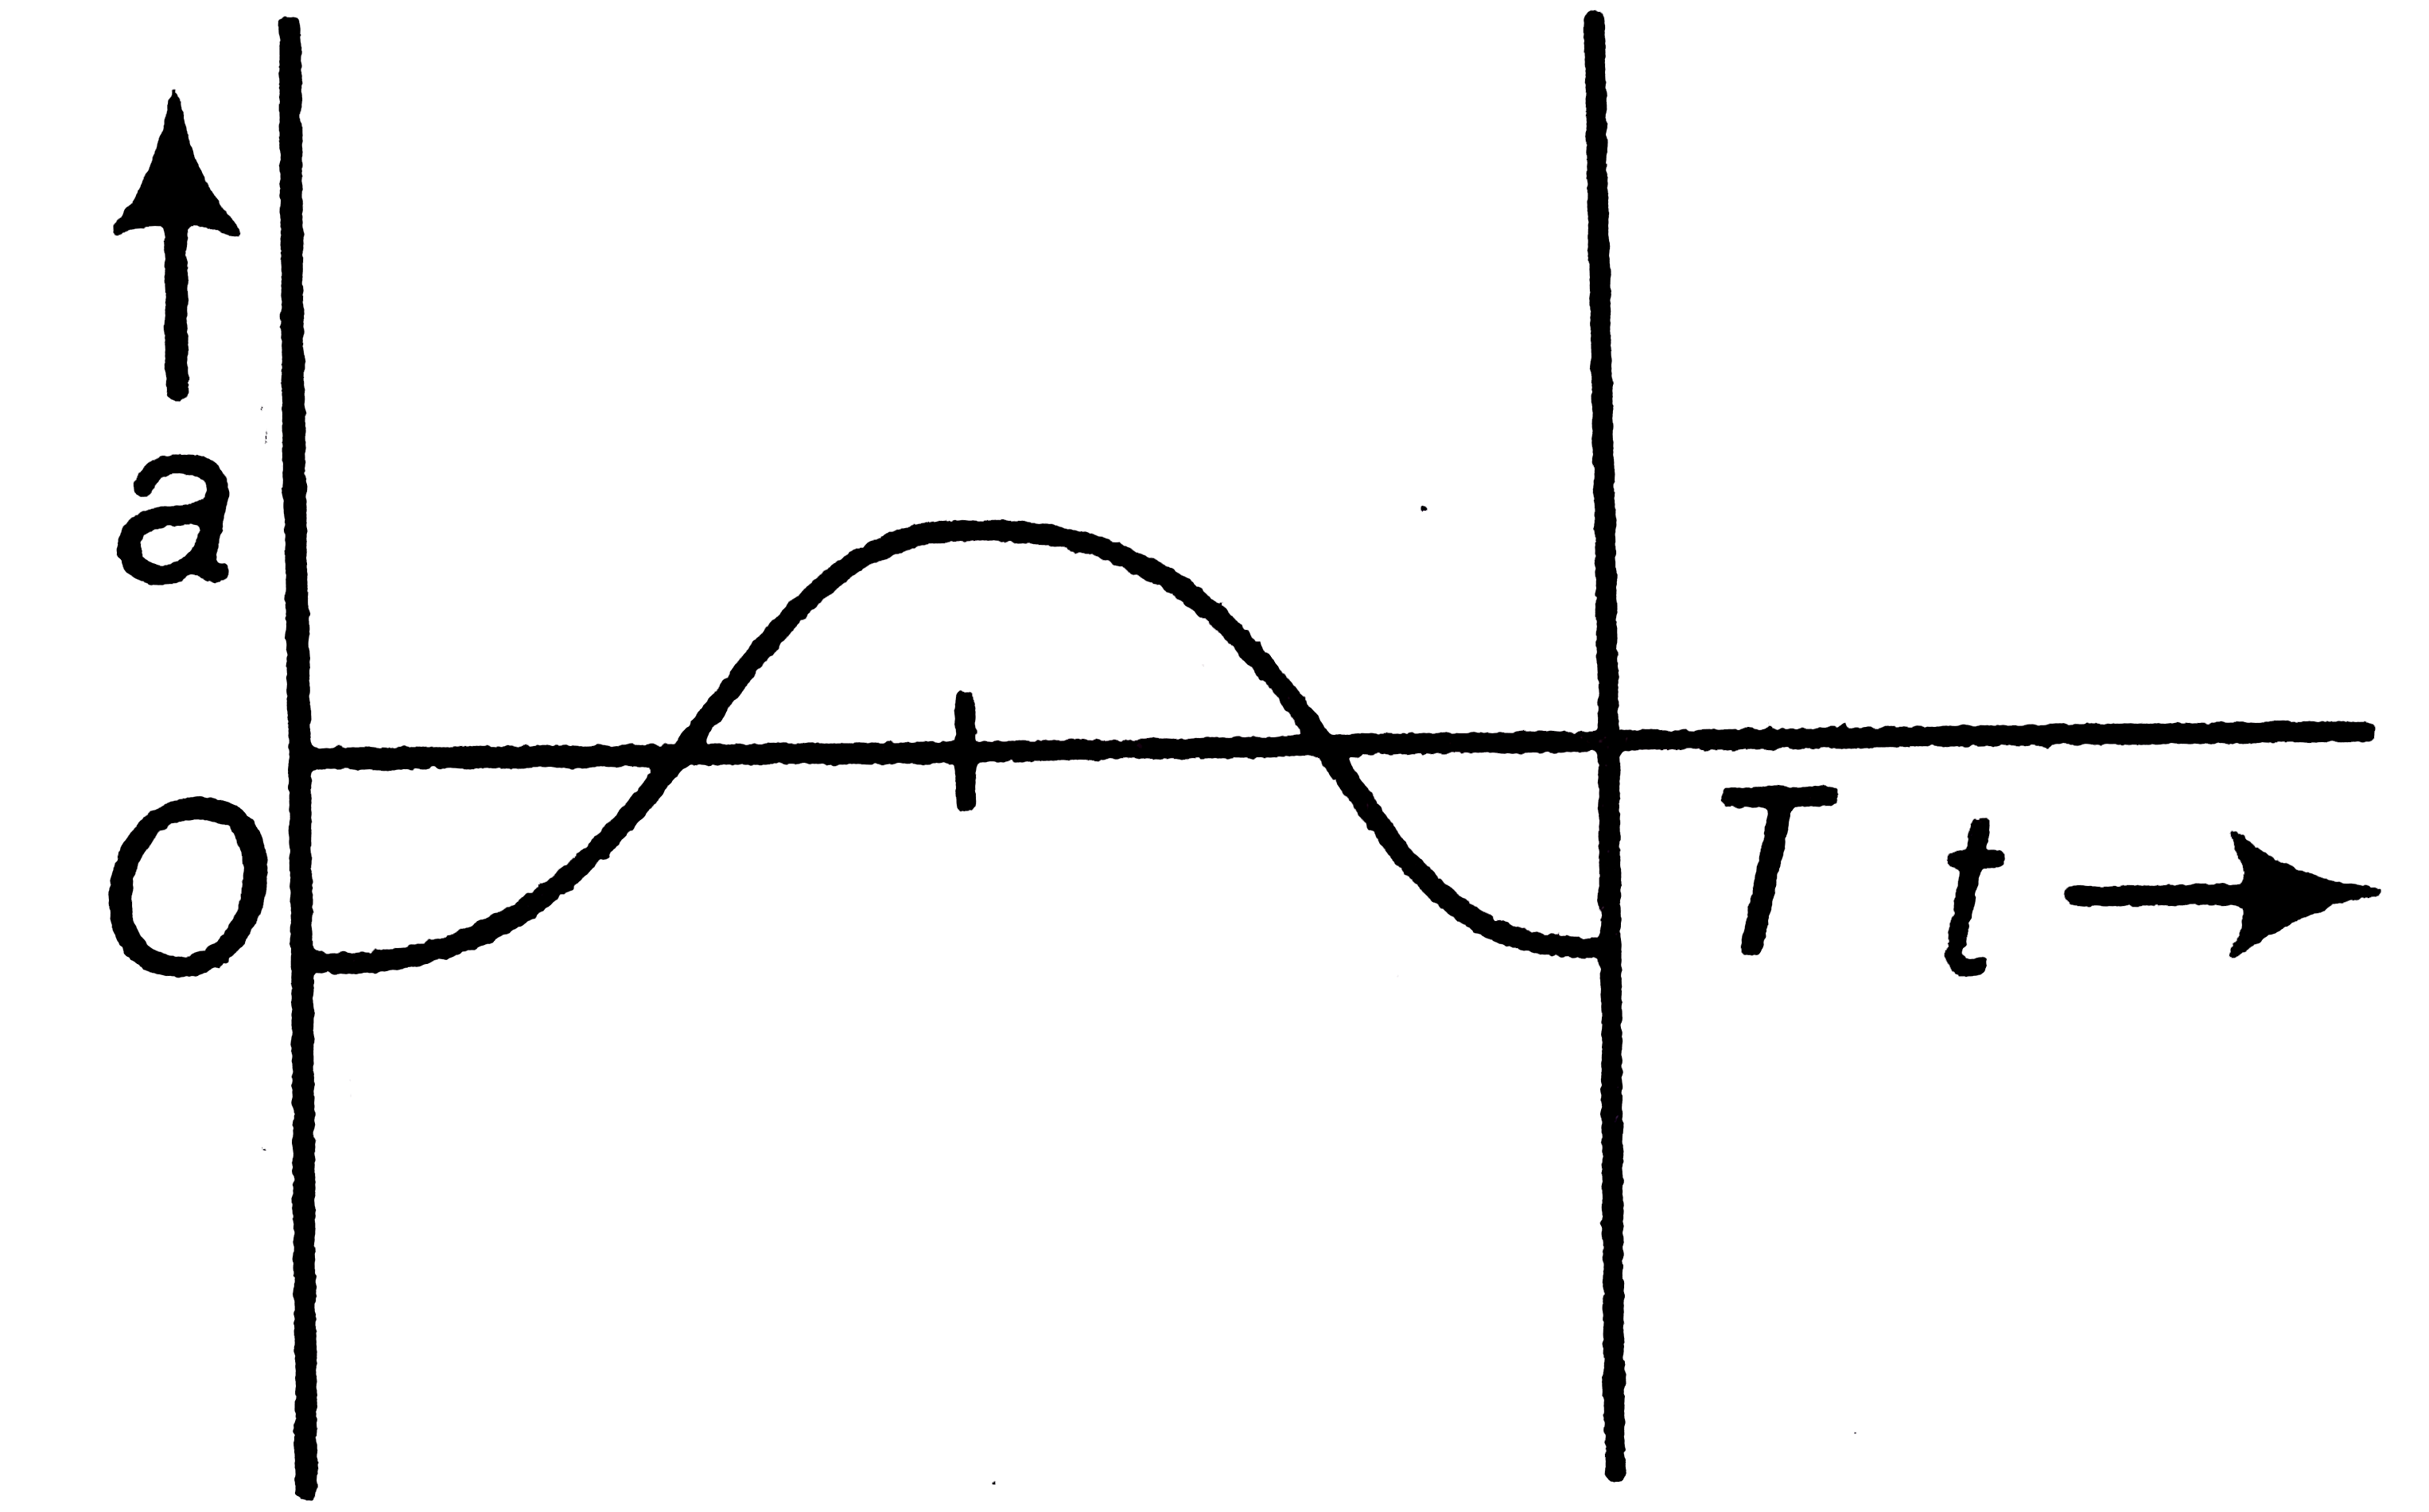 D
D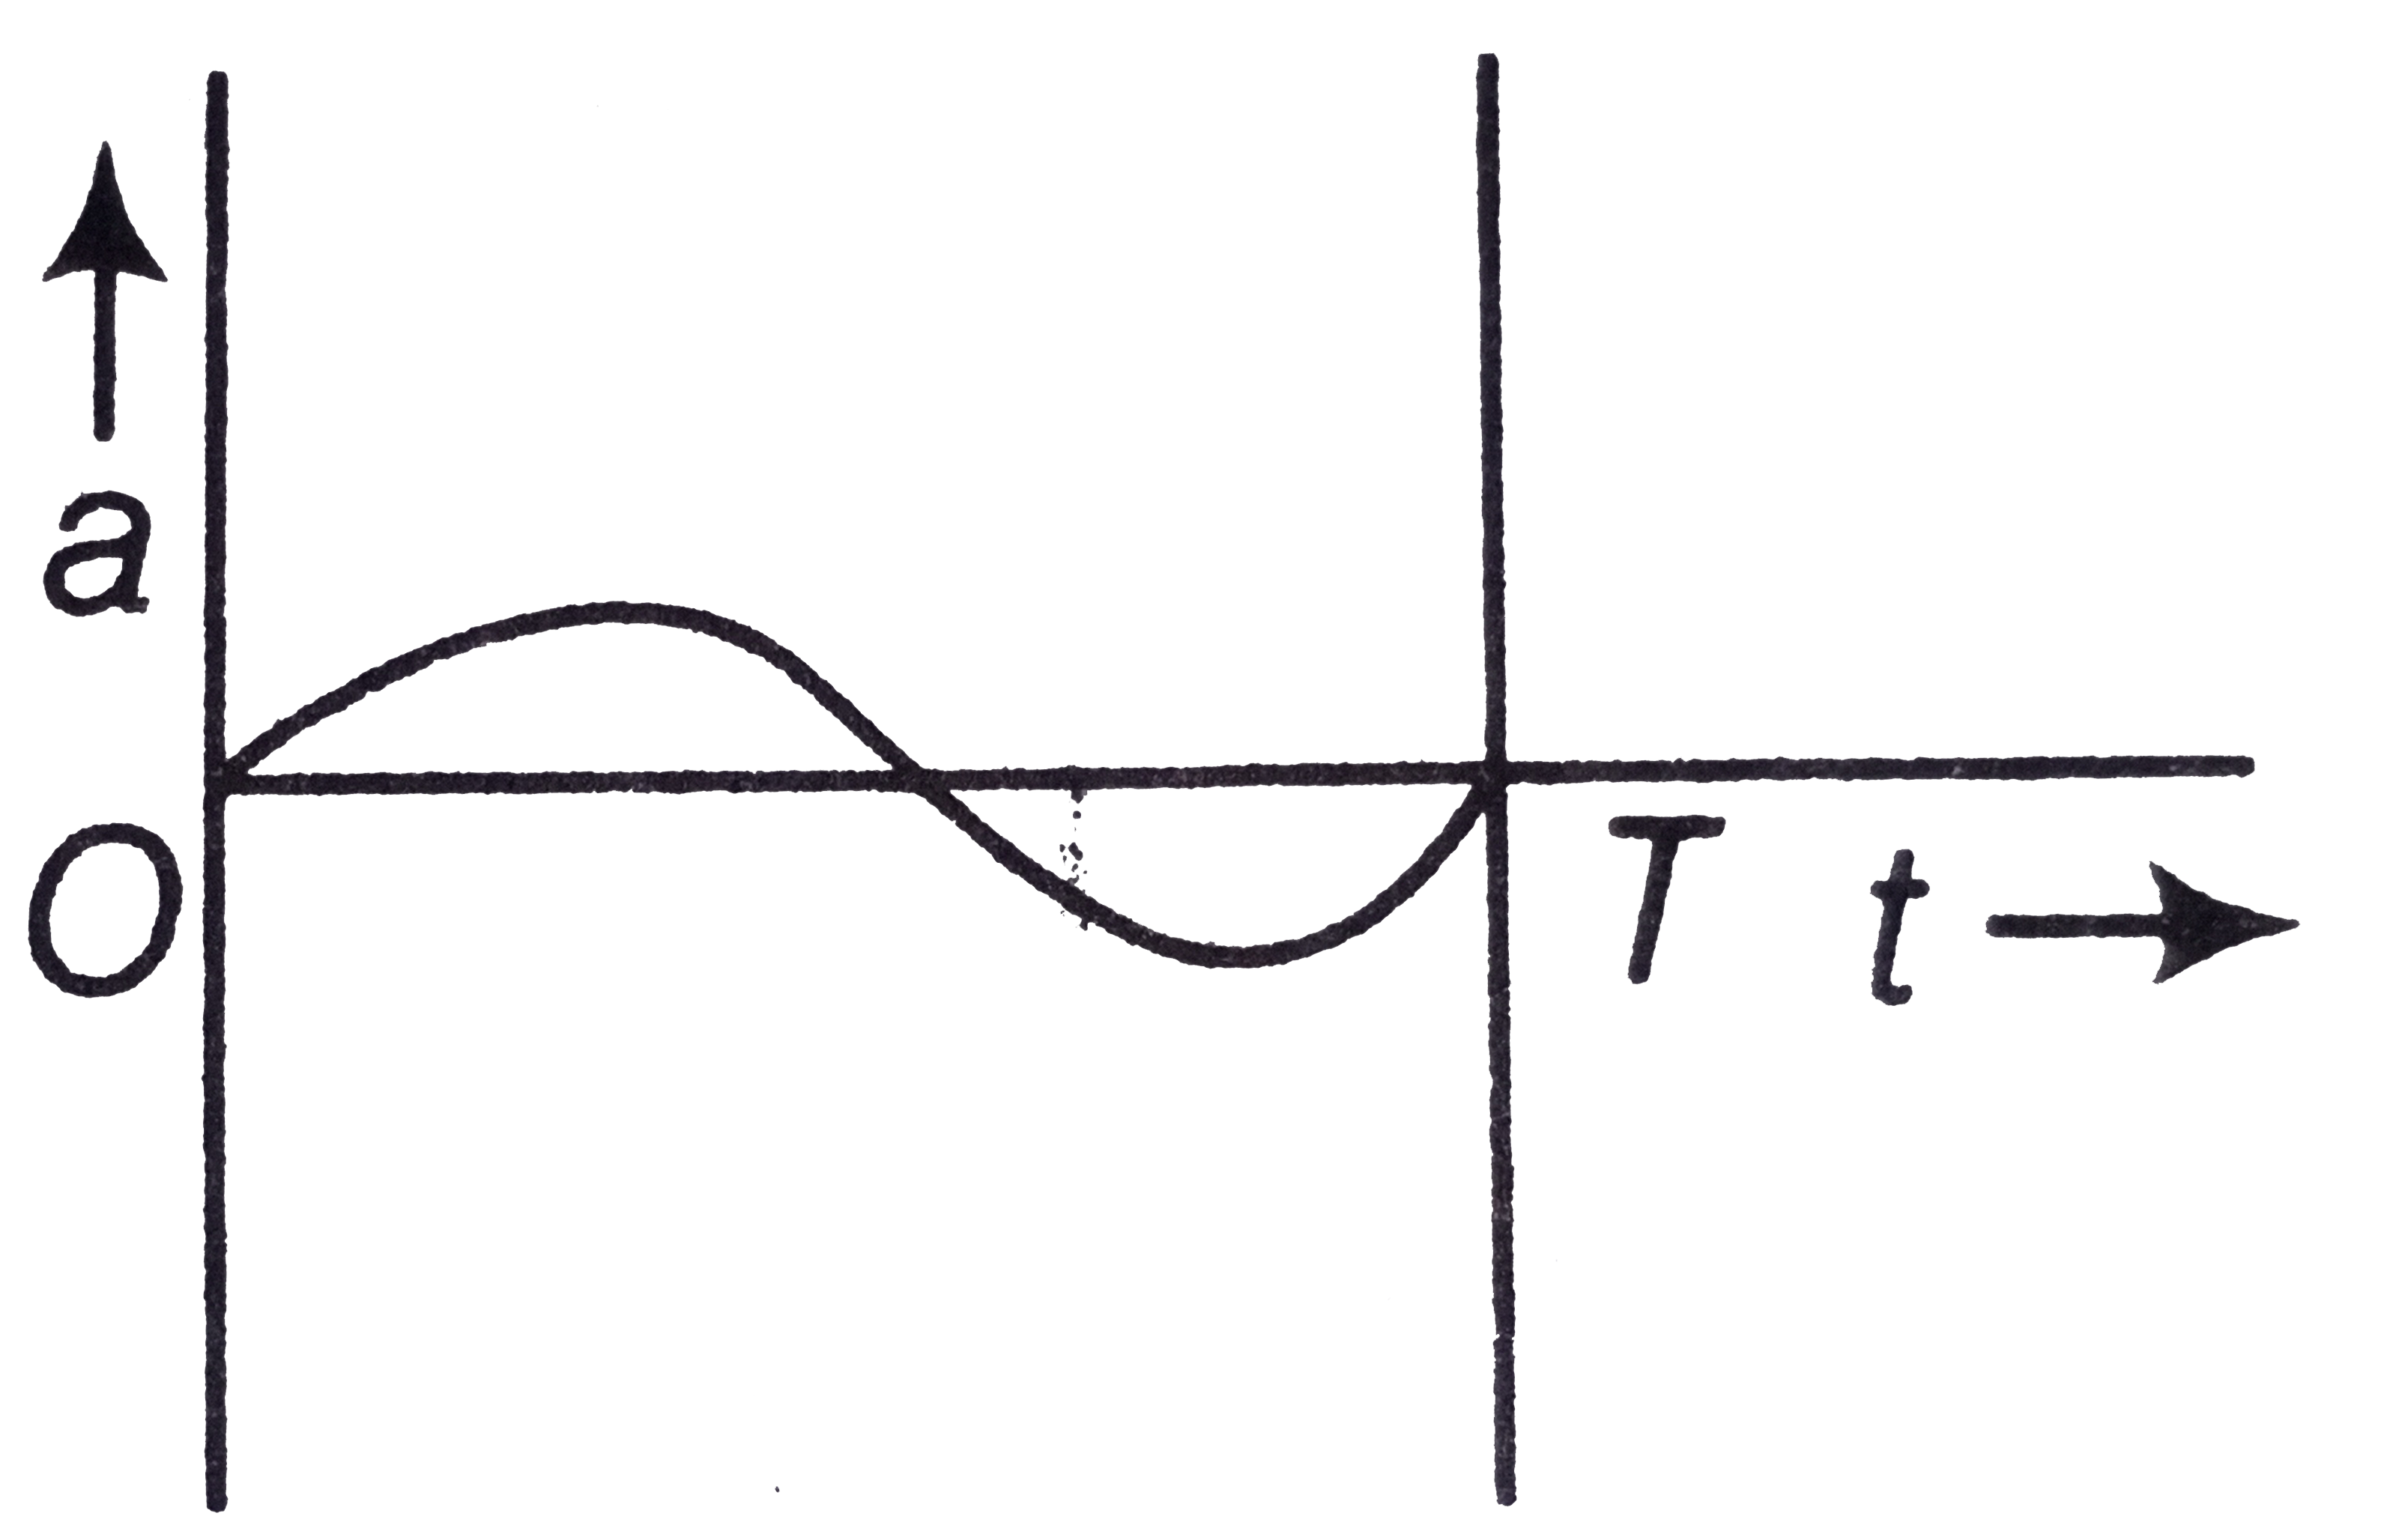
The oscillation of a body on a smooth horizontal surface is represented by the equation,
X=Acos(ωt)
where, X = displacement at time t
ω= frequency of oscillation
Which one of the following graphs shows correctly the variation a with t?
Here, a = acceleration at time t
T = time periodA B
B C
C D
D
Which of the following graph is correctly represented?
View Solutionwhich of the following graphs represents Charles' law correctly ?
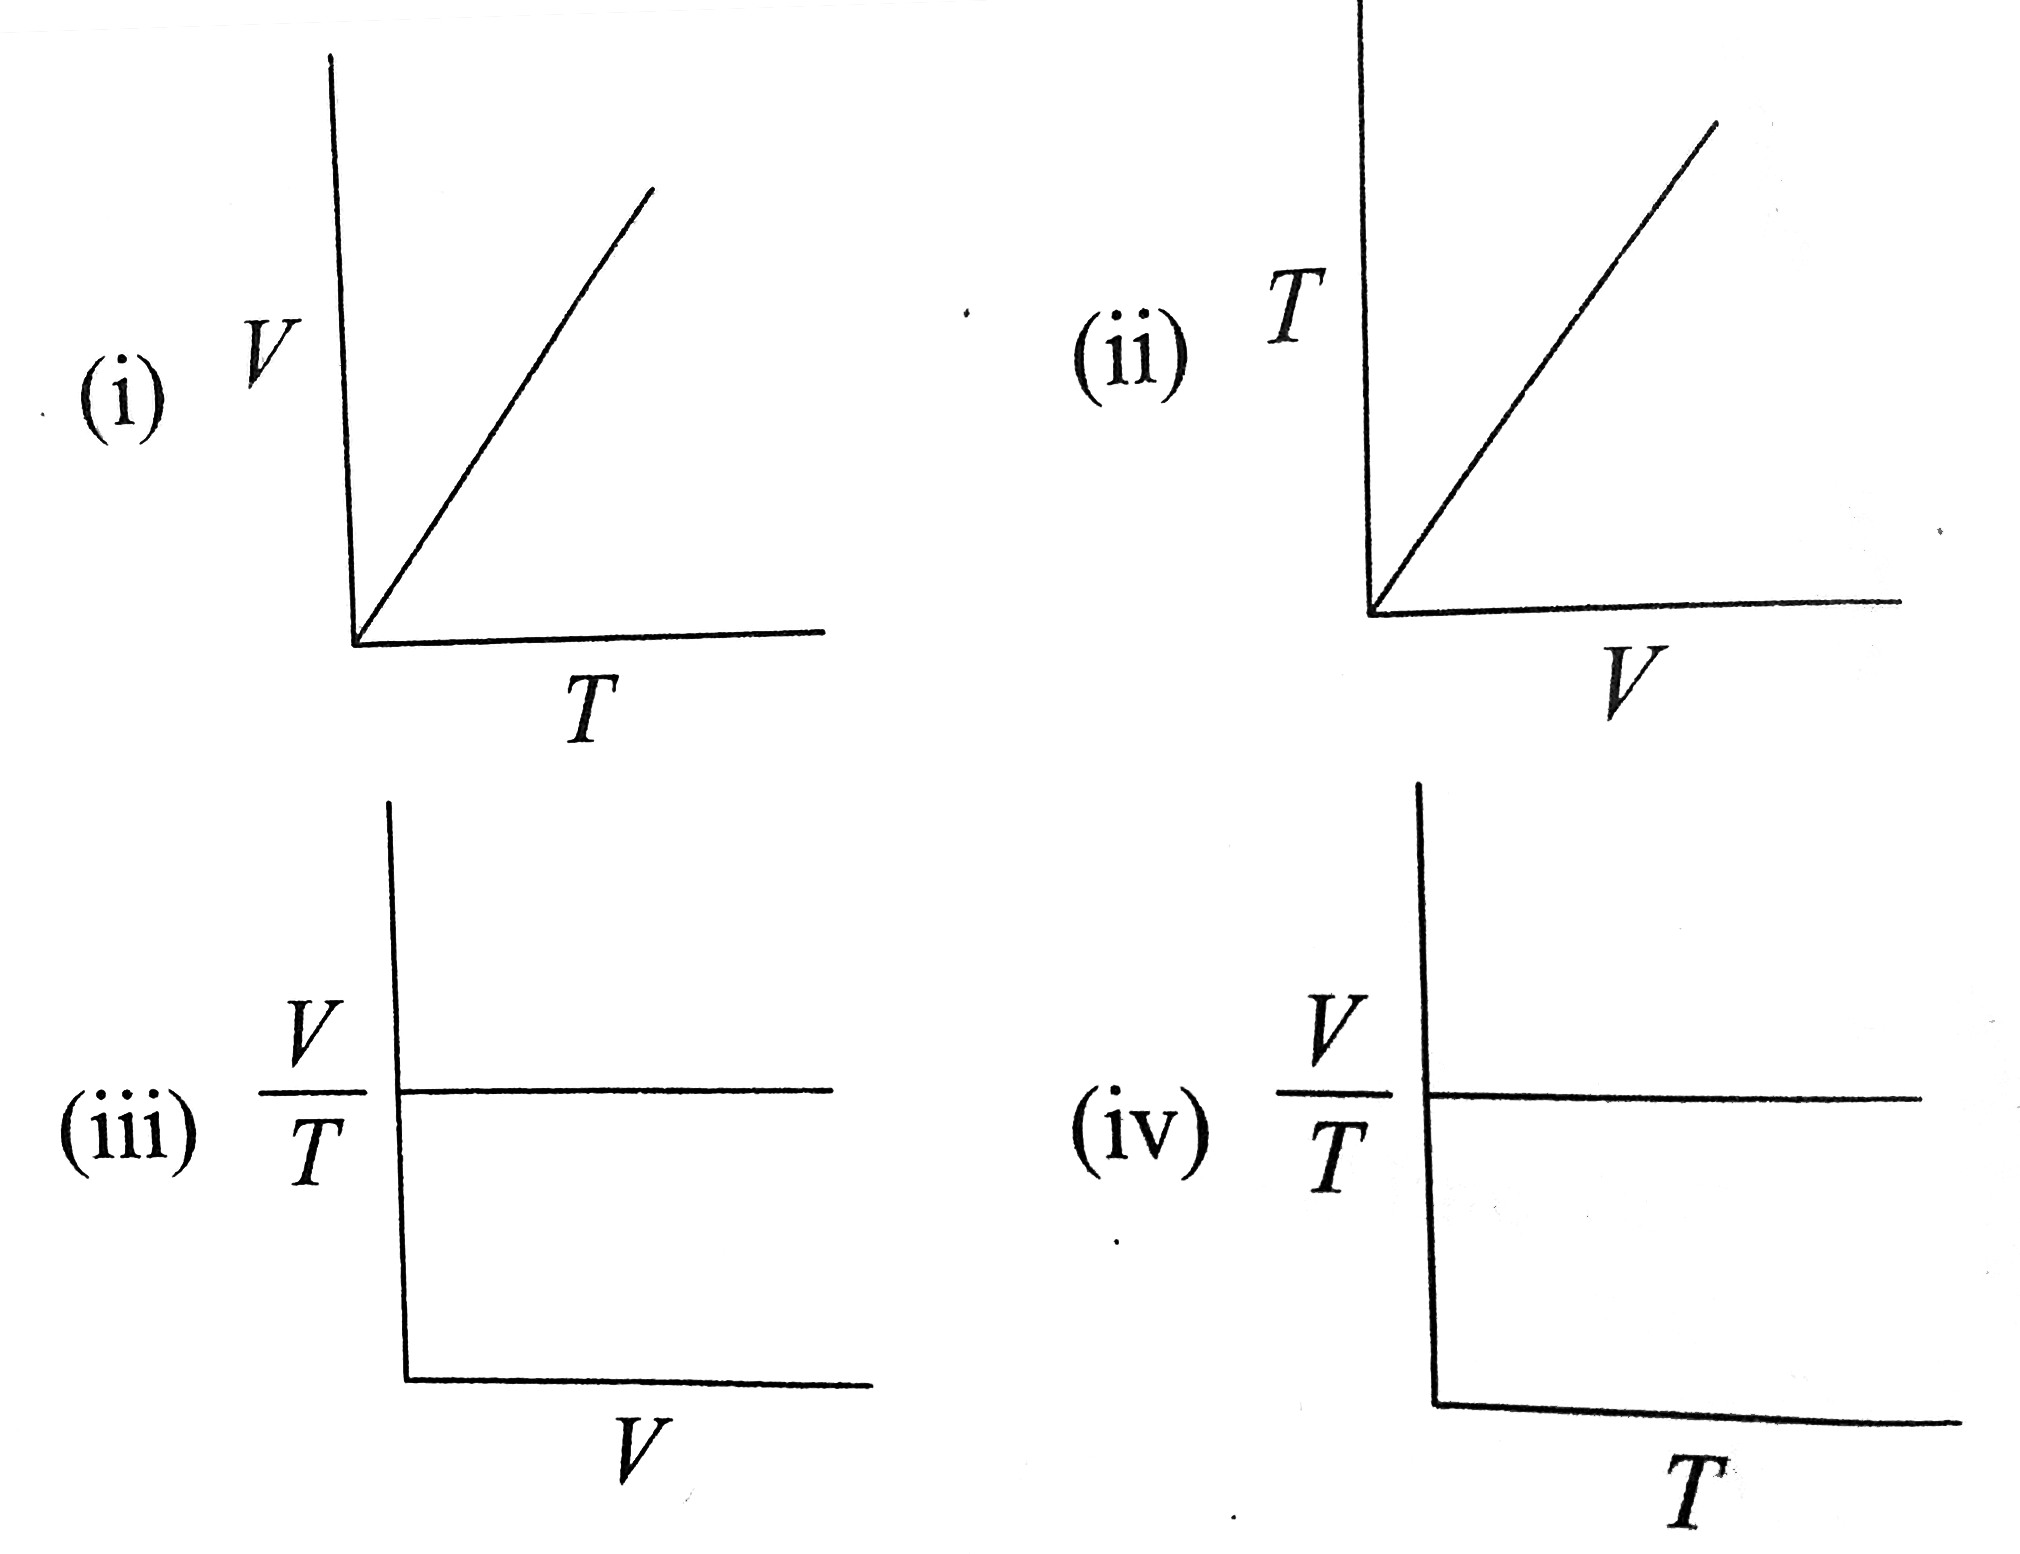
View SolutionA body is thrown vertically upwards. Which one of the following graphs correctly represent the velocity vs time?
View SolutionWhich one of the following represents correctly the variations of surface tension with temperature θ ?
View SolutionWhich of the following plots represents correctly the variation of conductivity with concentration?
View Solution

