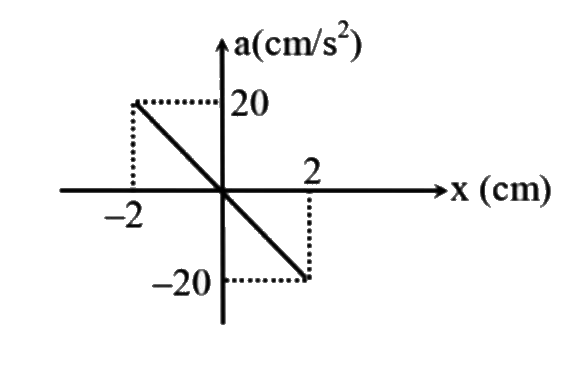
The acceleration-displacement (a−X) graph of a particle executing simple harmonic motion is shown in the figure. Find the frequency of oscillation.
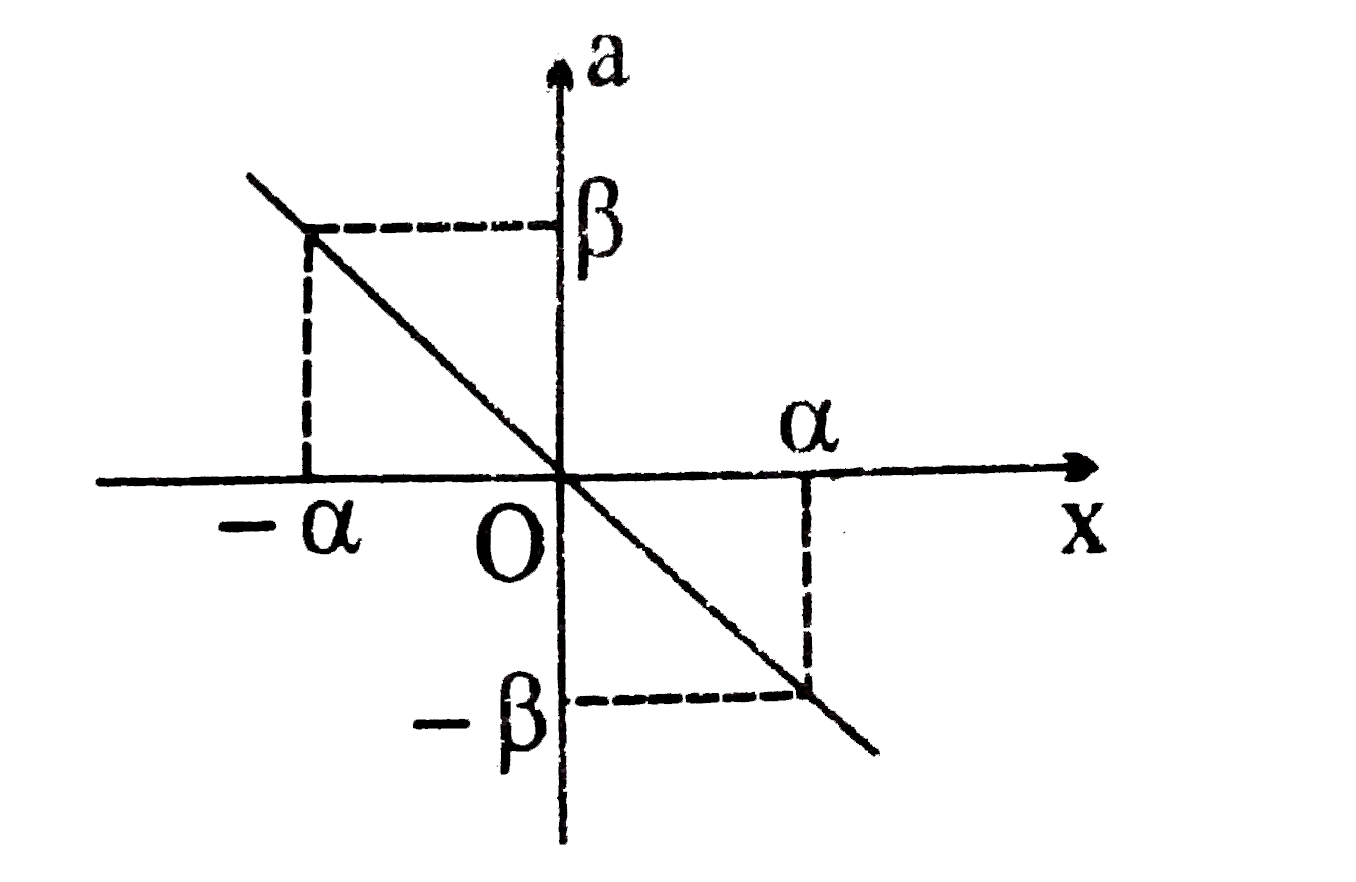
In SHM , α=−ω2x
β=−ω2=(−α)
∴β=ω2=α (from graph)
and ω=√βα
or 2πf=√βα
or f=12π√βα
Topper's Solved these Questions
- LINEAR AND ANGULAR SIMPLE HARMONIC MOTIONBook:CENGAGE PHYSICSChapter:LINEAR AND ANGULAR SIMPLE HARMONIC MOTIONExercise:Exercise 4.2
Explore 23 Videos
- LINEAR AND ANGULAR SIMPLE HARMONIC MOTIONBook:CENGAGE PHYSICSChapter:LINEAR AND ANGULAR SIMPLE HARMONIC MOTIONExercise:Subjective
Explore 21 Videos
- LINEAR AND ANGULAR SIMPLE HARMONIC MOTIONBook:CENGAGE PHYSICSChapter:LINEAR AND ANGULAR SIMPLE HARMONIC MOTIONExercise:Solved Example
Explore 15 Videos
- KINETIC THEORY OF GASES AND FIRST LAW OF THERMODYNAMICSBook:CENGAGE PHYSICSChapter:KINETIC THEORY OF GASES AND FIRST LAW OF THERMODYNAMICSExercise:Interger
Explore 11 Videos
- MISCELLANEOUS KINEMATICSBook:CENGAGE PHYSICSChapter:MISCELLANEOUS KINEMATICSExercise:Interger type
Explore 3 Videos
Similar Questions
Knowledge Check
The velocity of a particle executing simple harmonic motion is
Aω2√A2+x2Bω√A2−x2Cω√A2+x2Dω2√A2−x2The acceleration displacement graph of a particle executing simple harmonic motion is shown in figure. The time period of simple harmonic motion is
A4π√3sB2π√3sCThe given graph doesn't represent simple harmonic motionDinformation is insufficientWhile a particle executes linear simple harmonic motion
Aits linear velocity and acceleration pass through their maximum and minimum values once in each oscillation.BIts linear velocity and acceleration pass through their maximum and minimum values twice in each oscillation.Cits linear velocity and acceleration pass through their maximum and minimum values four times in each oscillation.Dits linear velocity and acceleration always attain their peak values simlataneaously.
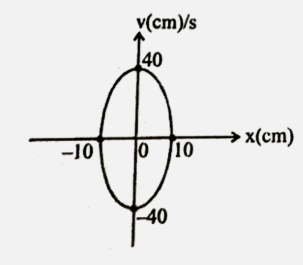
The plot of velocity (v) versus displacement (x) of a particle executing simple harmonic motion is shown in figure. The time period of oscillation of particle is :-
View SolutionThe displacement-time graph of a particle executing simple harmonic motion is shown in the figure
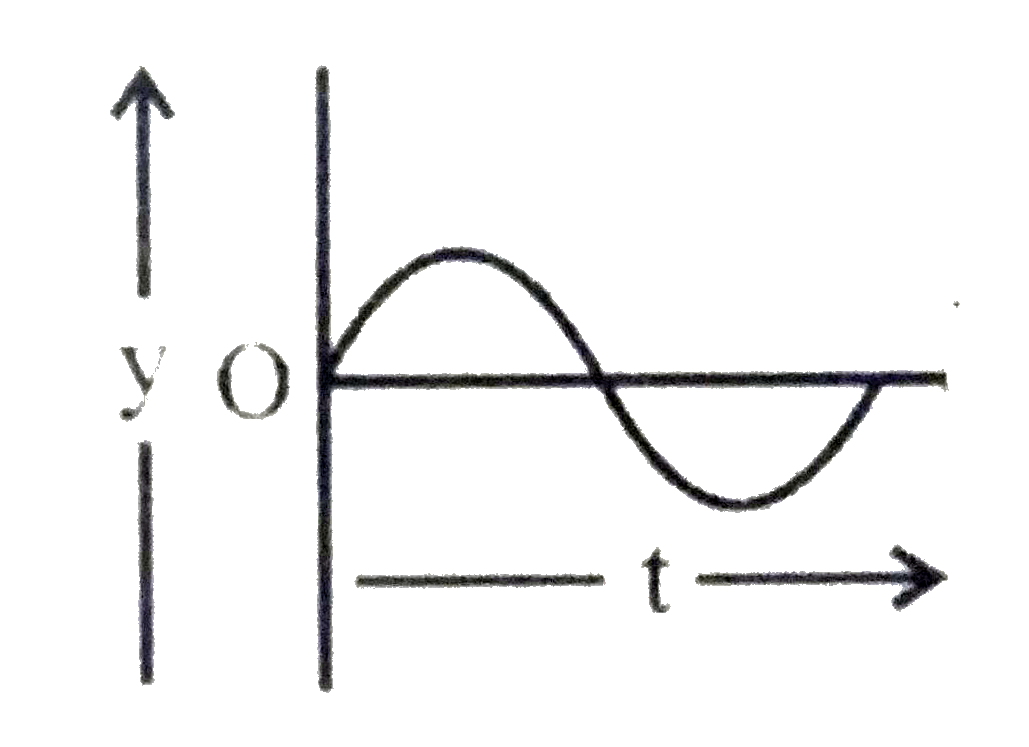
Which one of the following graphs is the correct forcetime graph for the motion of the particle ?
View SolutionThe variation of displacement with time of a particle executing free simple harmonic motion is shown in the figure.

The potential energy U(x) versus time (t) plot of the particle is correctly shown in figure :
View SolutionThe phase of a particle executing simple harmonic motion is π2 when it has
View SolutionThe displacement - time (x−t) graph of a particle executing simple harmonic motion is shown in figure. The correct variation of net force F action on the particle as a function of time is
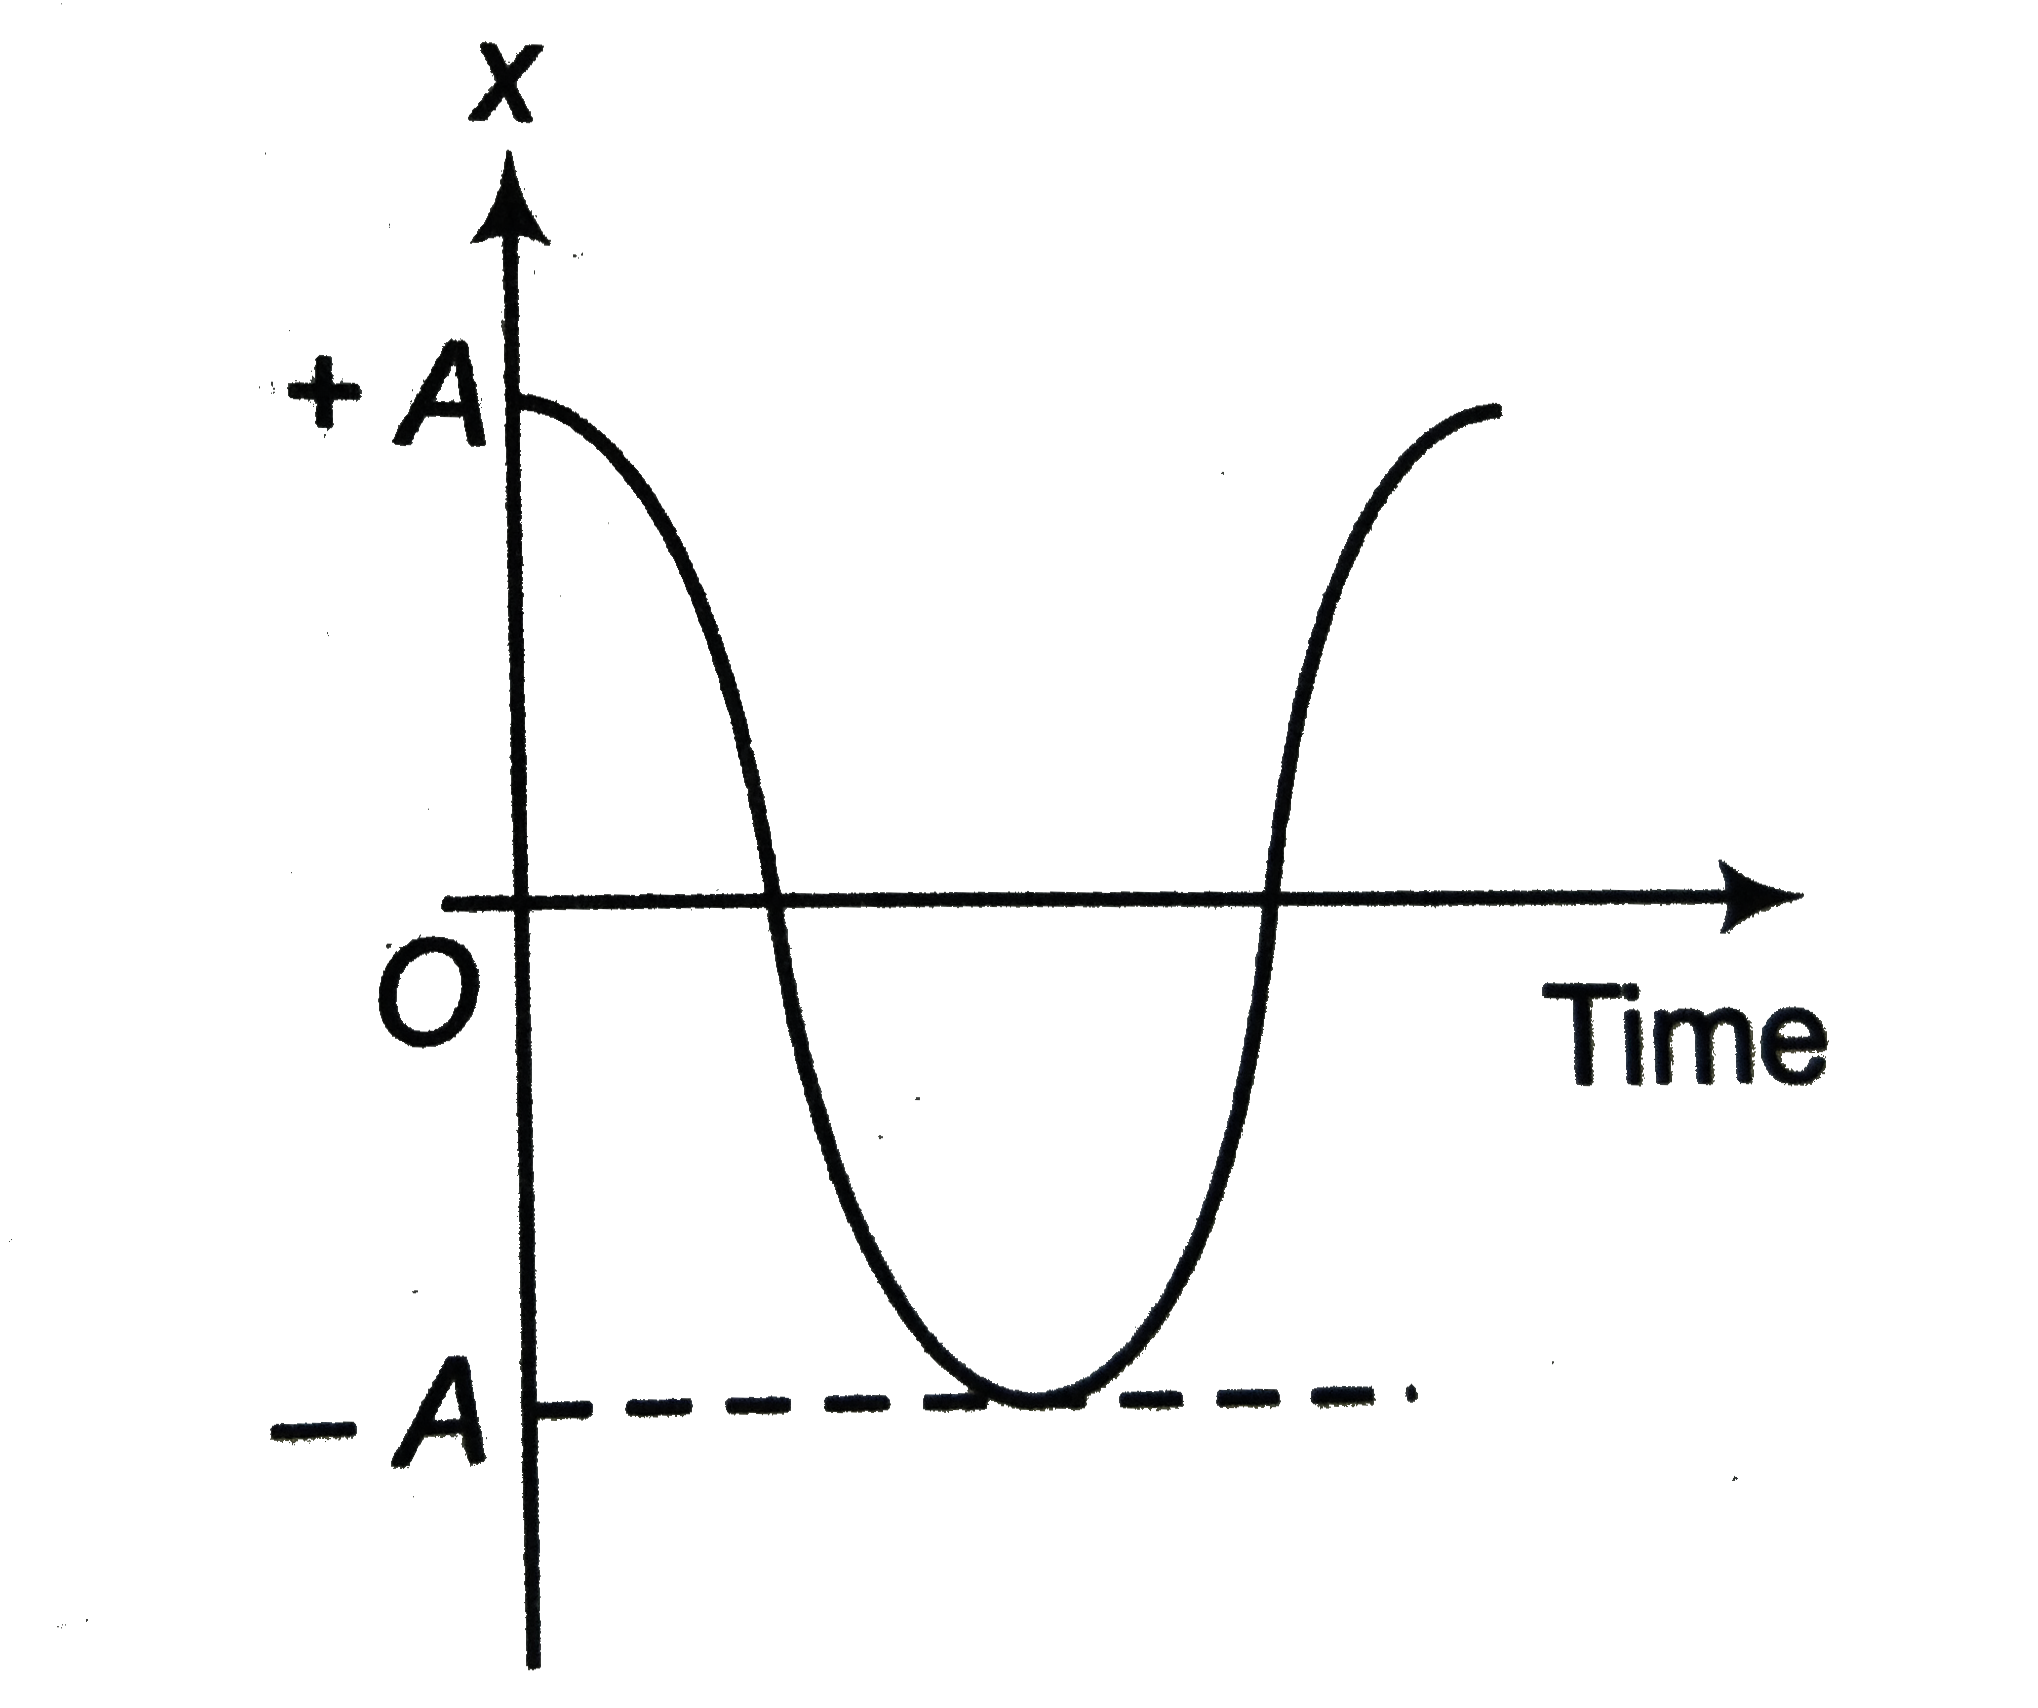
View Solution


