Which graph will show equilibrium condition?
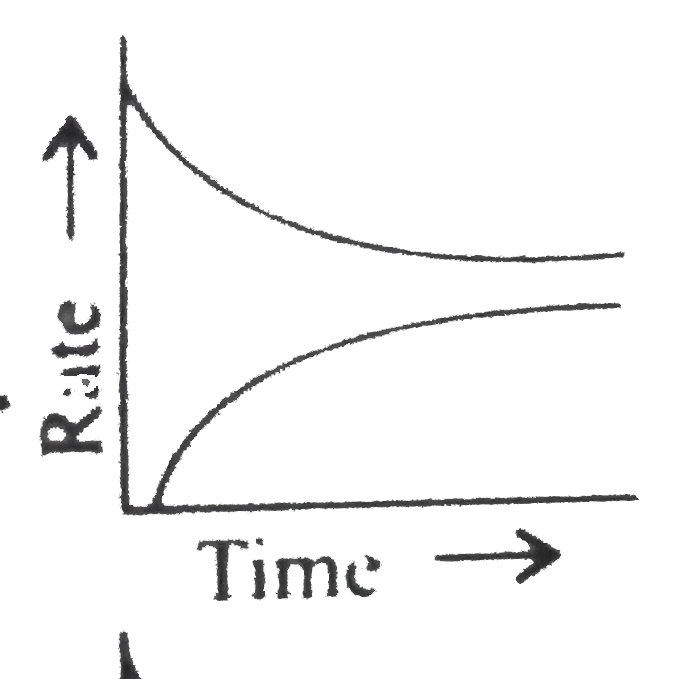
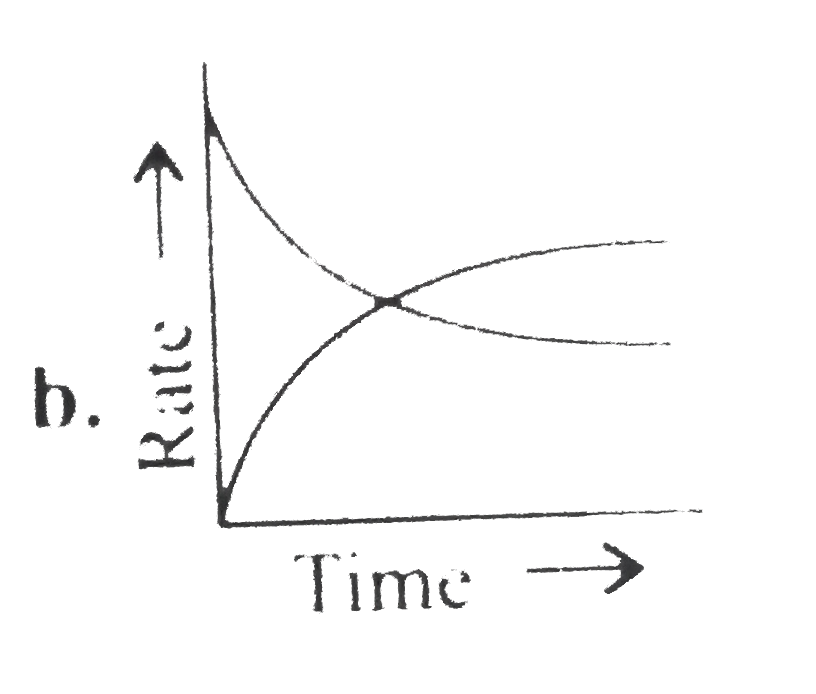
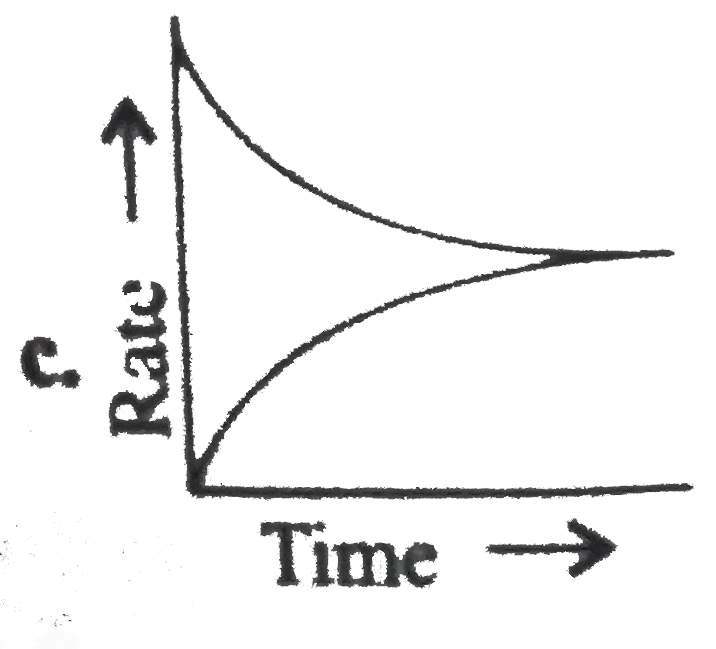
None of these
The correct Answer is:C
To determine which graph shows the equilibrium condition, we need to understand the concept of equilibrium in a chemical reaction. Here’s a step-by-step solution:
Step 1: Understand Forward and Backward Reactions
In a chemical reaction, the forward reaction is when reactants A and B convert to products C and D. The backward reaction is the reverse process, where products C and D convert back to reactants A and B.
Step 2: Define Equilibrium
Equilibrium is reached when the rate of the forward reaction equals the rate of the backward reaction. At this point, the concentrations of reactants and products remain constant over time.
Step 3: Analyze the Graphs
To identify which graph represents equilibrium, we need to look for the following characteristics:
- The rates of the forward and backward reactions should be equal.
- The concentrations of reactants and products should not change over time.
Step 4: Evaluate Each Option
1. Graph A: If the graph shows that the rate of the forward reaction is increasing while the rate of the backward reaction is decreasing, it indicates that the system is not at equilibrium.
2. Graph B: If the graph shows that both rates are changing and not equal, it also indicates that the system is not at equilibrium.
3. Graph C: If the graph shows that the rates of the forward and backward reactions are constant and equal, this indicates that the system is at equilibrium.
Step 5: Conclusion
The graph that shows equilibrium condition will have the rate of the forward reaction equal to the rate of the backward reaction, and both rates will remain constant over time.
Final Answer
The graph that shows equilibrium condition is Graph C.
---
In a chemical reaction, the forward reaction is when reactants A and B convert to products C and D. The backward reaction is the reverse process, where products C and D convert back to reactants A and B.
Equilibrium is reached when the rate of the forward reaction equals the rate of the backward reaction. At this point, the concentrations of reactants and products remain constant over time.
To identify which graph represents equilibrium, we need to look for the following characteristics:
- The rates of the forward and backward reactions should be equal.
- The concentrations of reactants and products should not change over time.
1. Graph A: If the graph shows that the rate of the forward reaction is increasing while the rate of the backward reaction is decreasing, it indicates that the system is not at equilibrium.
2. Graph B: If the graph shows that both rates are changing and not equal, it also indicates that the system is not at equilibrium.
3. Graph C: If the graph shows that the rates of the forward and backward reactions are constant and equal, this indicates that the system is at equilibrium.
The graph that shows equilibrium condition will have the rate of the forward reaction equal to the rate of the backward reaction, and both rates will remain constant over time.
The graph that shows equilibrium condition is Graph C.
Topper's Solved these Questions
- CHEMICAL EQUILIBRIUMBook:CENGAGE CHEMISTRYChapter:CHEMICAL EQUILIBRIUMExercise:Concept Applicationexercise 7.1
Explore 53 Videos
- CHEMICAL EQUILIBRIUMBook:CENGAGE CHEMISTRYChapter:CHEMICAL EQUILIBRIUMExercise:Ex 7.2
Explore 40 Videos
- CHEMICAL BONDING AND MOLECULAR STRUCTUREBook:CENGAGE CHEMISTRYChapter:CHEMICAL BONDING AND MOLECULAR STRUCTUREExercise:Archives Subjective
Explore 15 Videos
- CLASSIFICATION AND NOMENCLATURE OF ORGANIC COMPOUNDSBook:CENGAGE CHEMISTRYChapter:CLASSIFICATION AND NOMENCLATURE OF ORGANIC COMPOUNDSExercise:Analytical and Descriptive Type
Explore 3 Videos
Similar Questions
Knowledge Check
Which graph will show equilibrium, R=P ?
A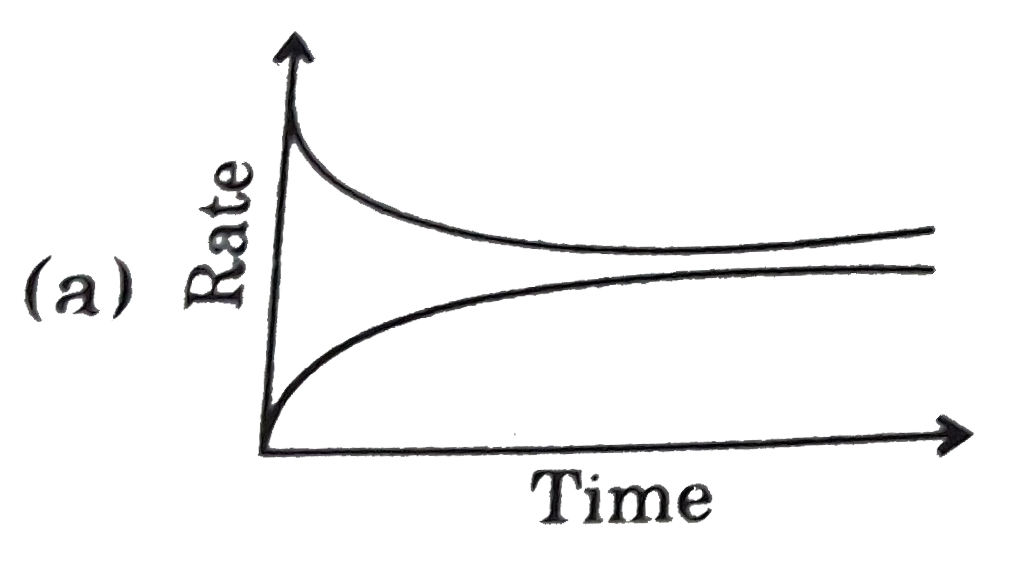 B
B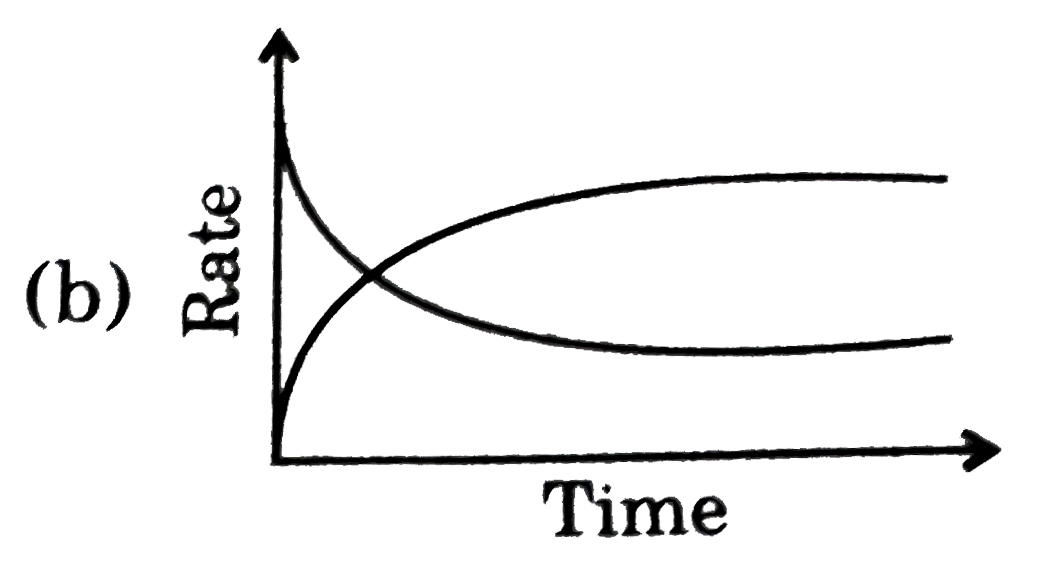 C
C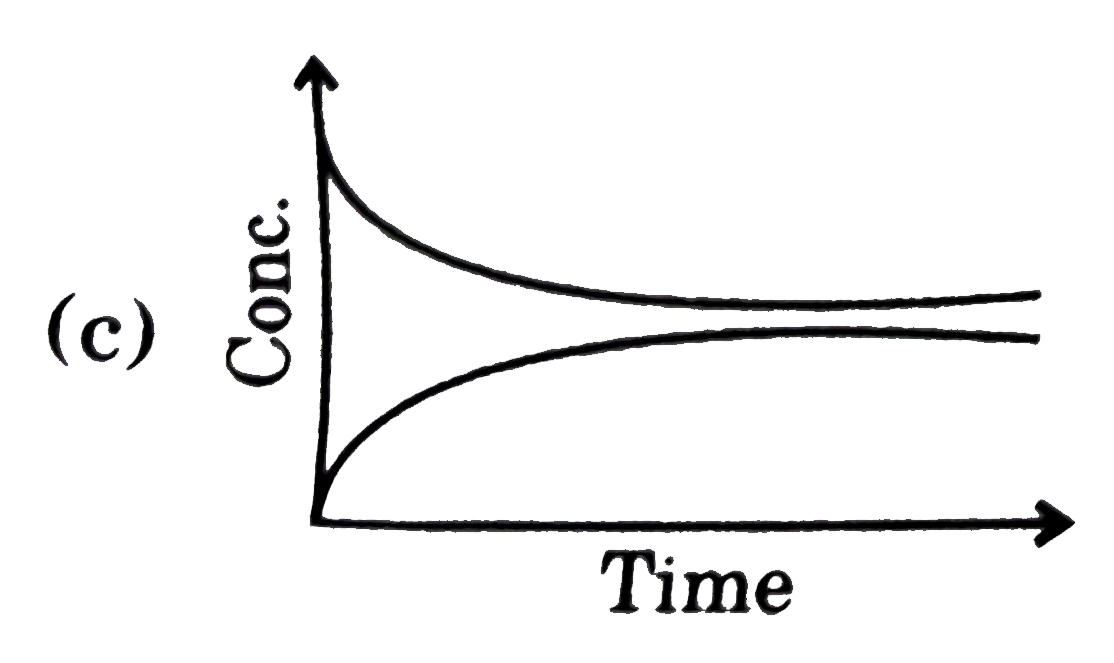 D
D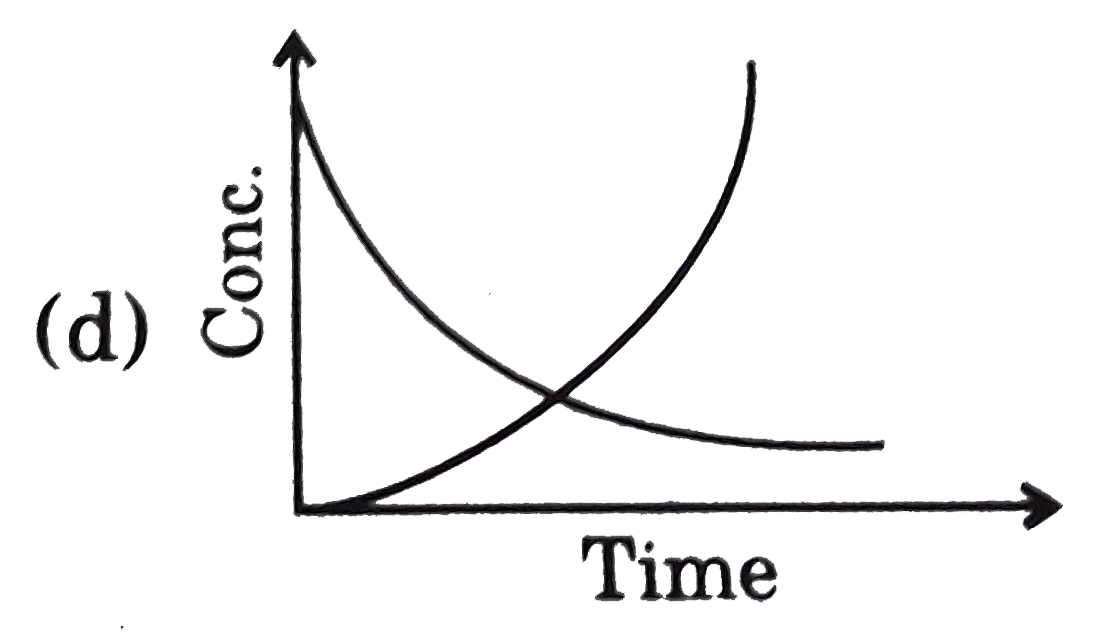
Which graph shows zero activation energy ?
A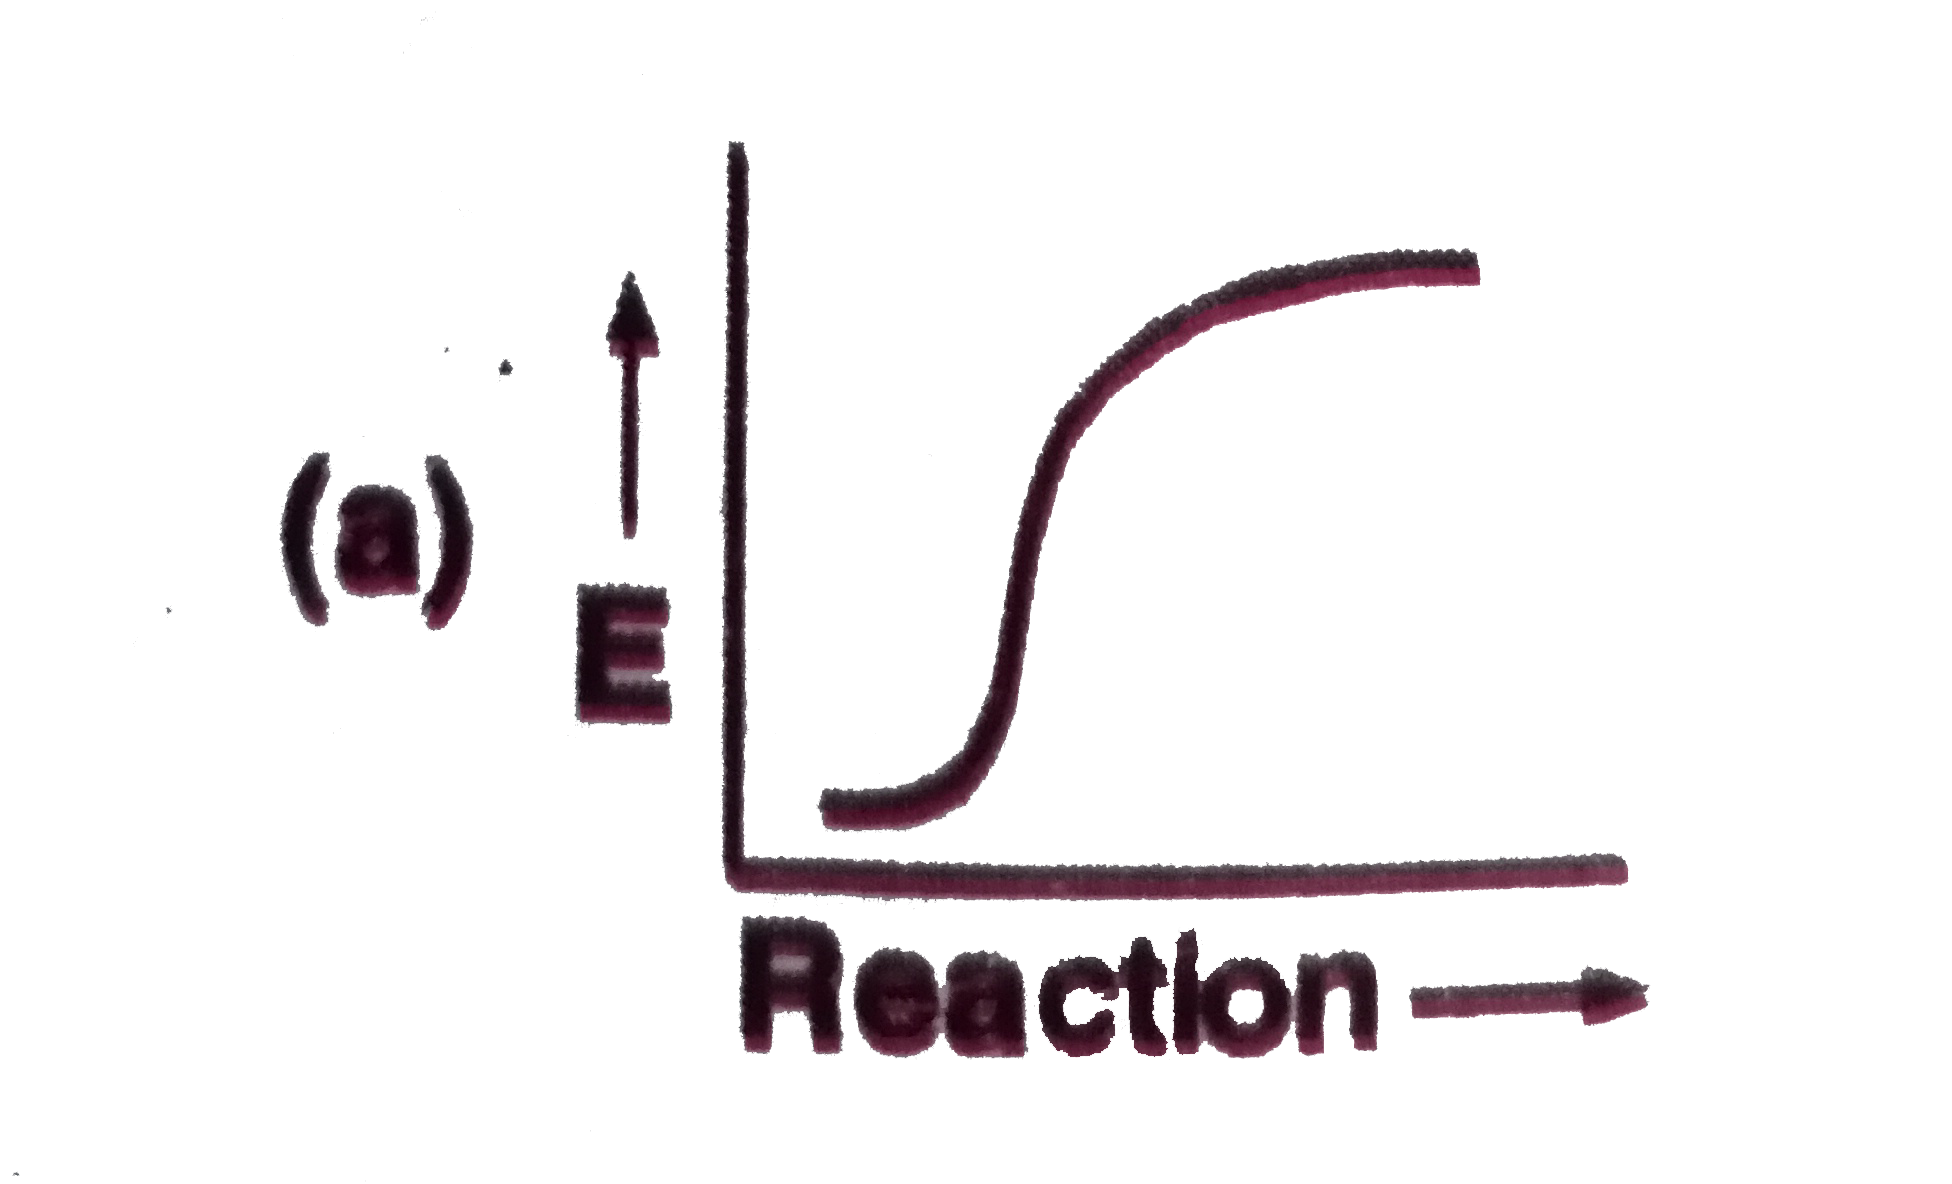 B
B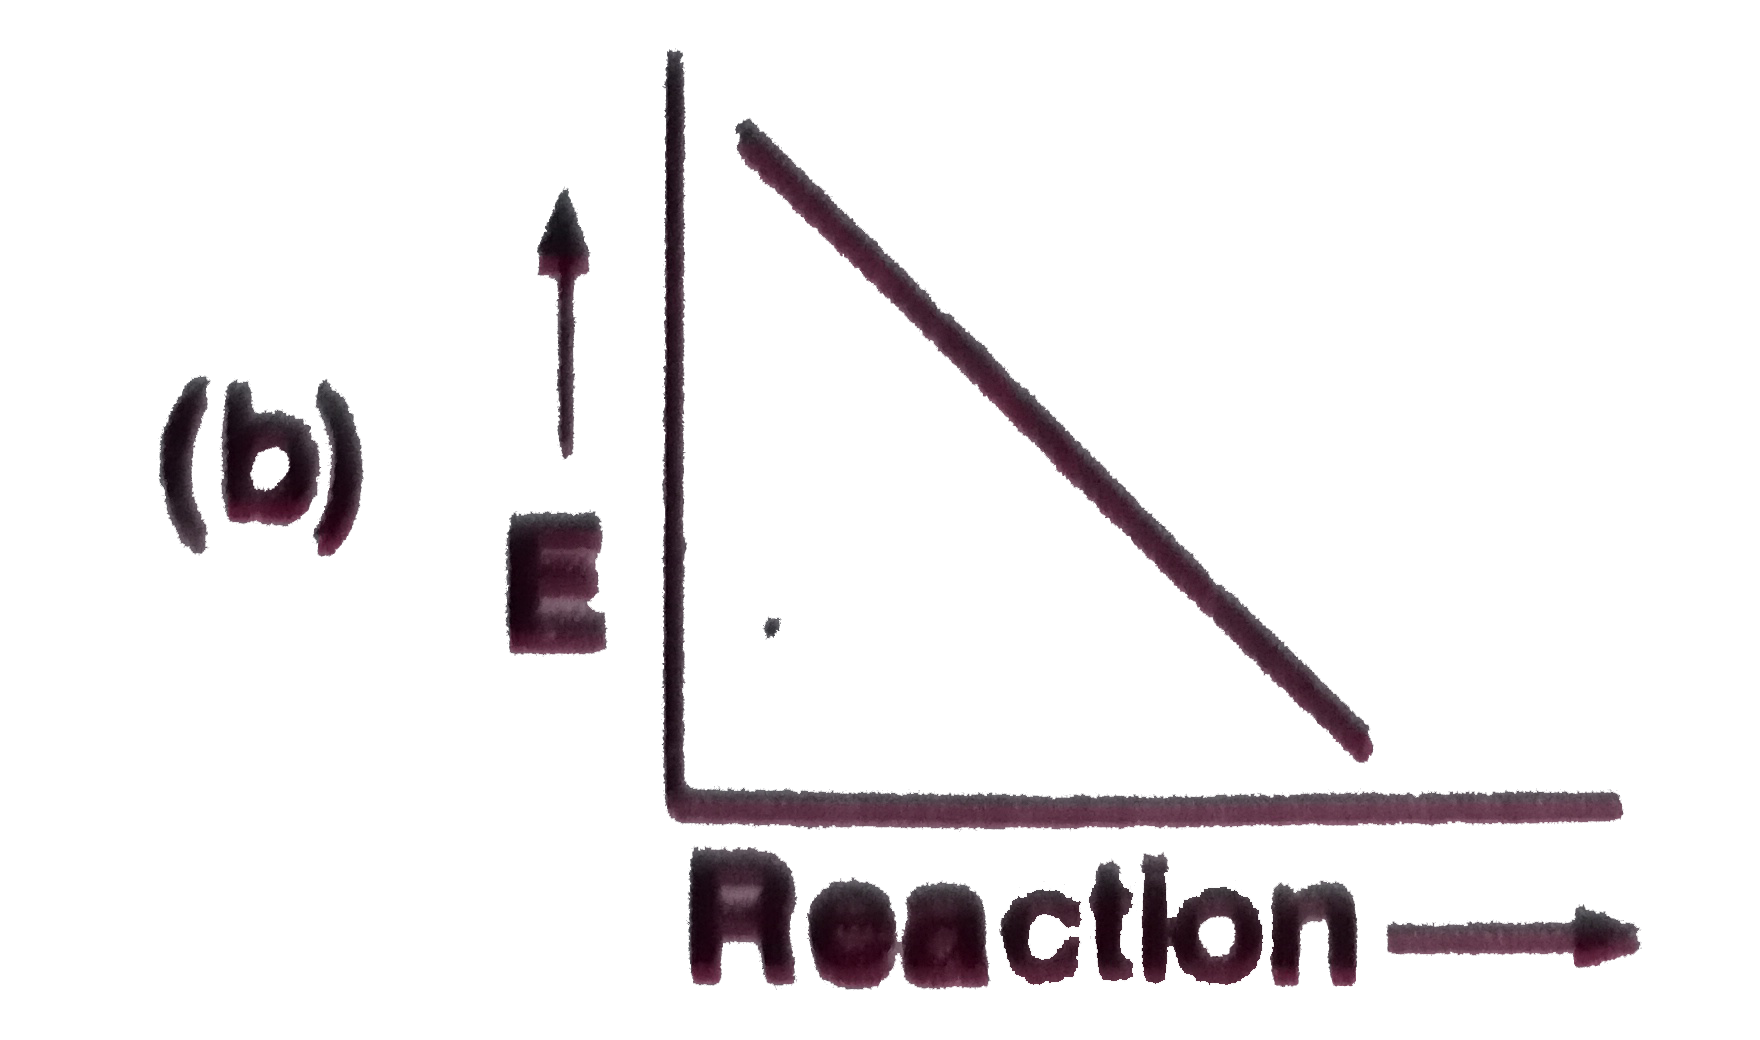 C
C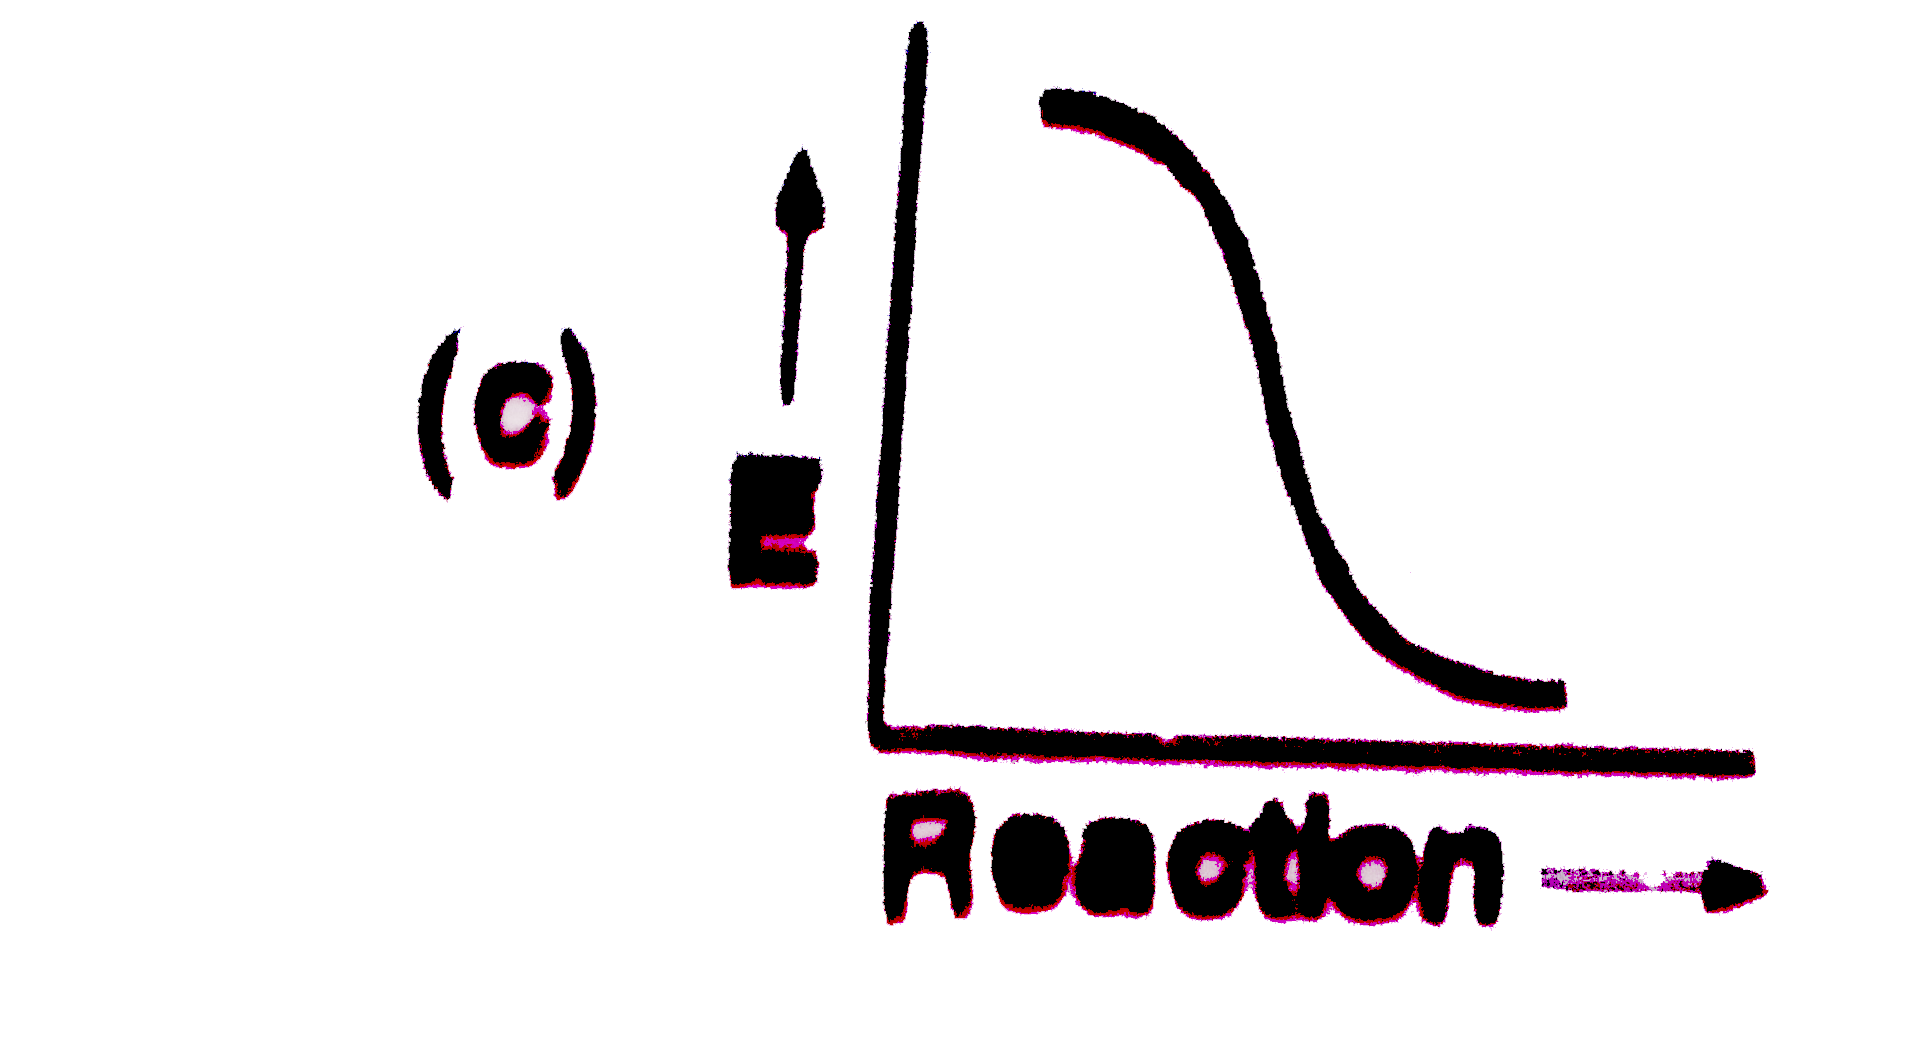 D
D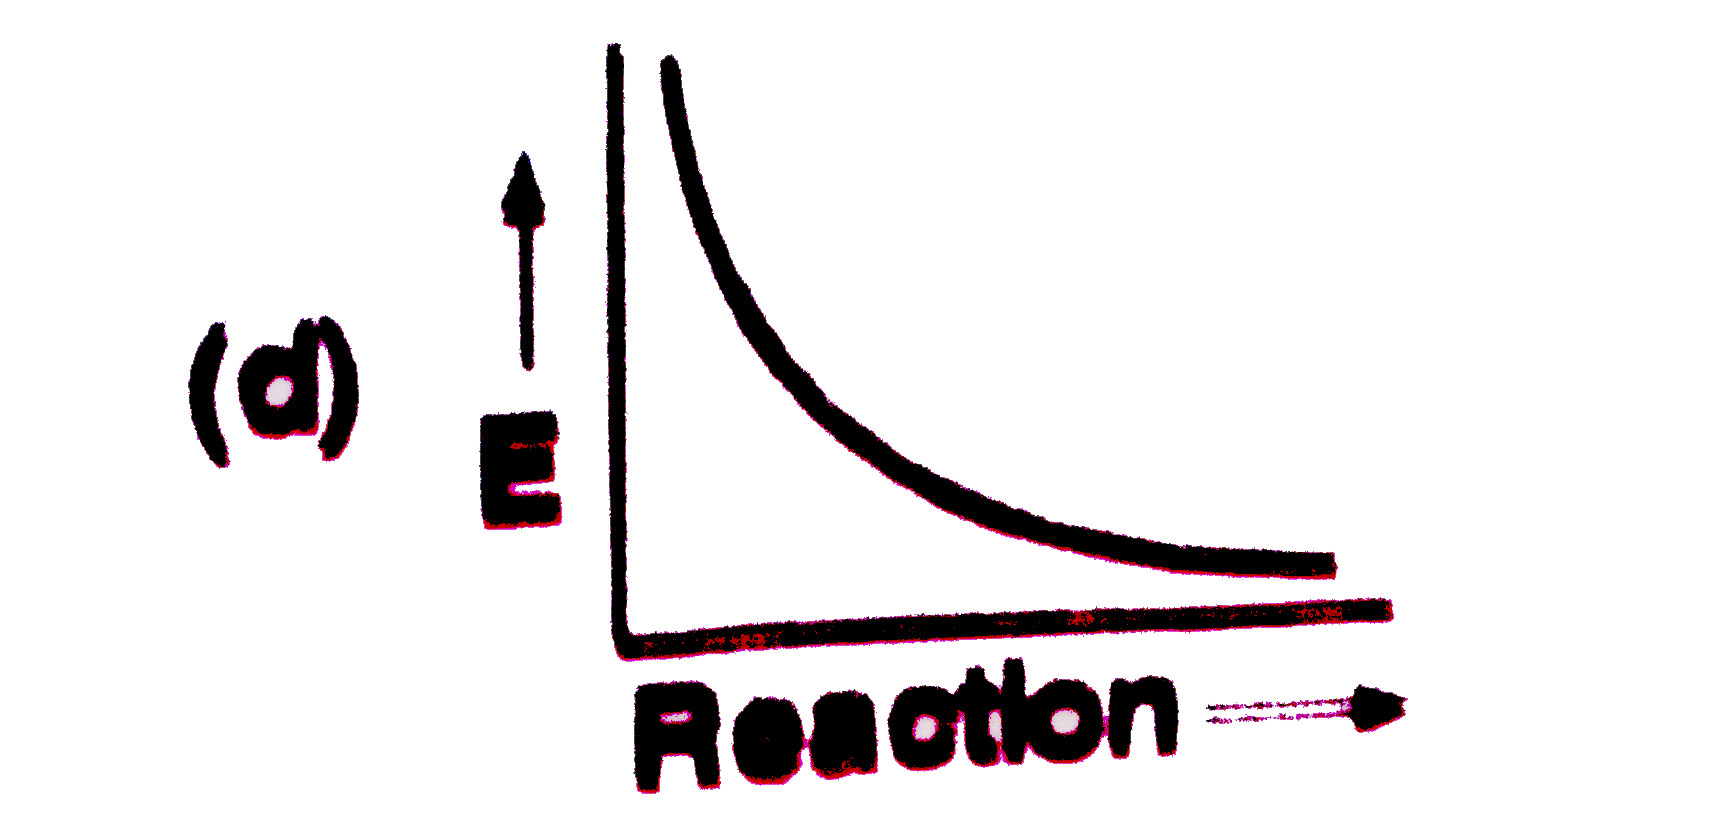
Which of the following genotype will show the diseased condition in sickle cell anaemia?
AHbAHbABHbAHbSCHbSHbSDBoth B and C
Explain why will a producer not be in equilibrium if the conditions of equilibrium are not met.
View SolutionExplain why will a producer not be in equilibrium if the conditions of equilibrium are not met.
View SolutionThe temperature of a particular place is continuously decreasing. Which of the following graphs shows the condition?
View SolutionThe temperature of a particular place is continuously decreasing. Which of the following graphs shows the condition?
View SolutionThe temperature of a particular place is continuously decreasing, Which of the following graphs shows the condition?
View Solution

