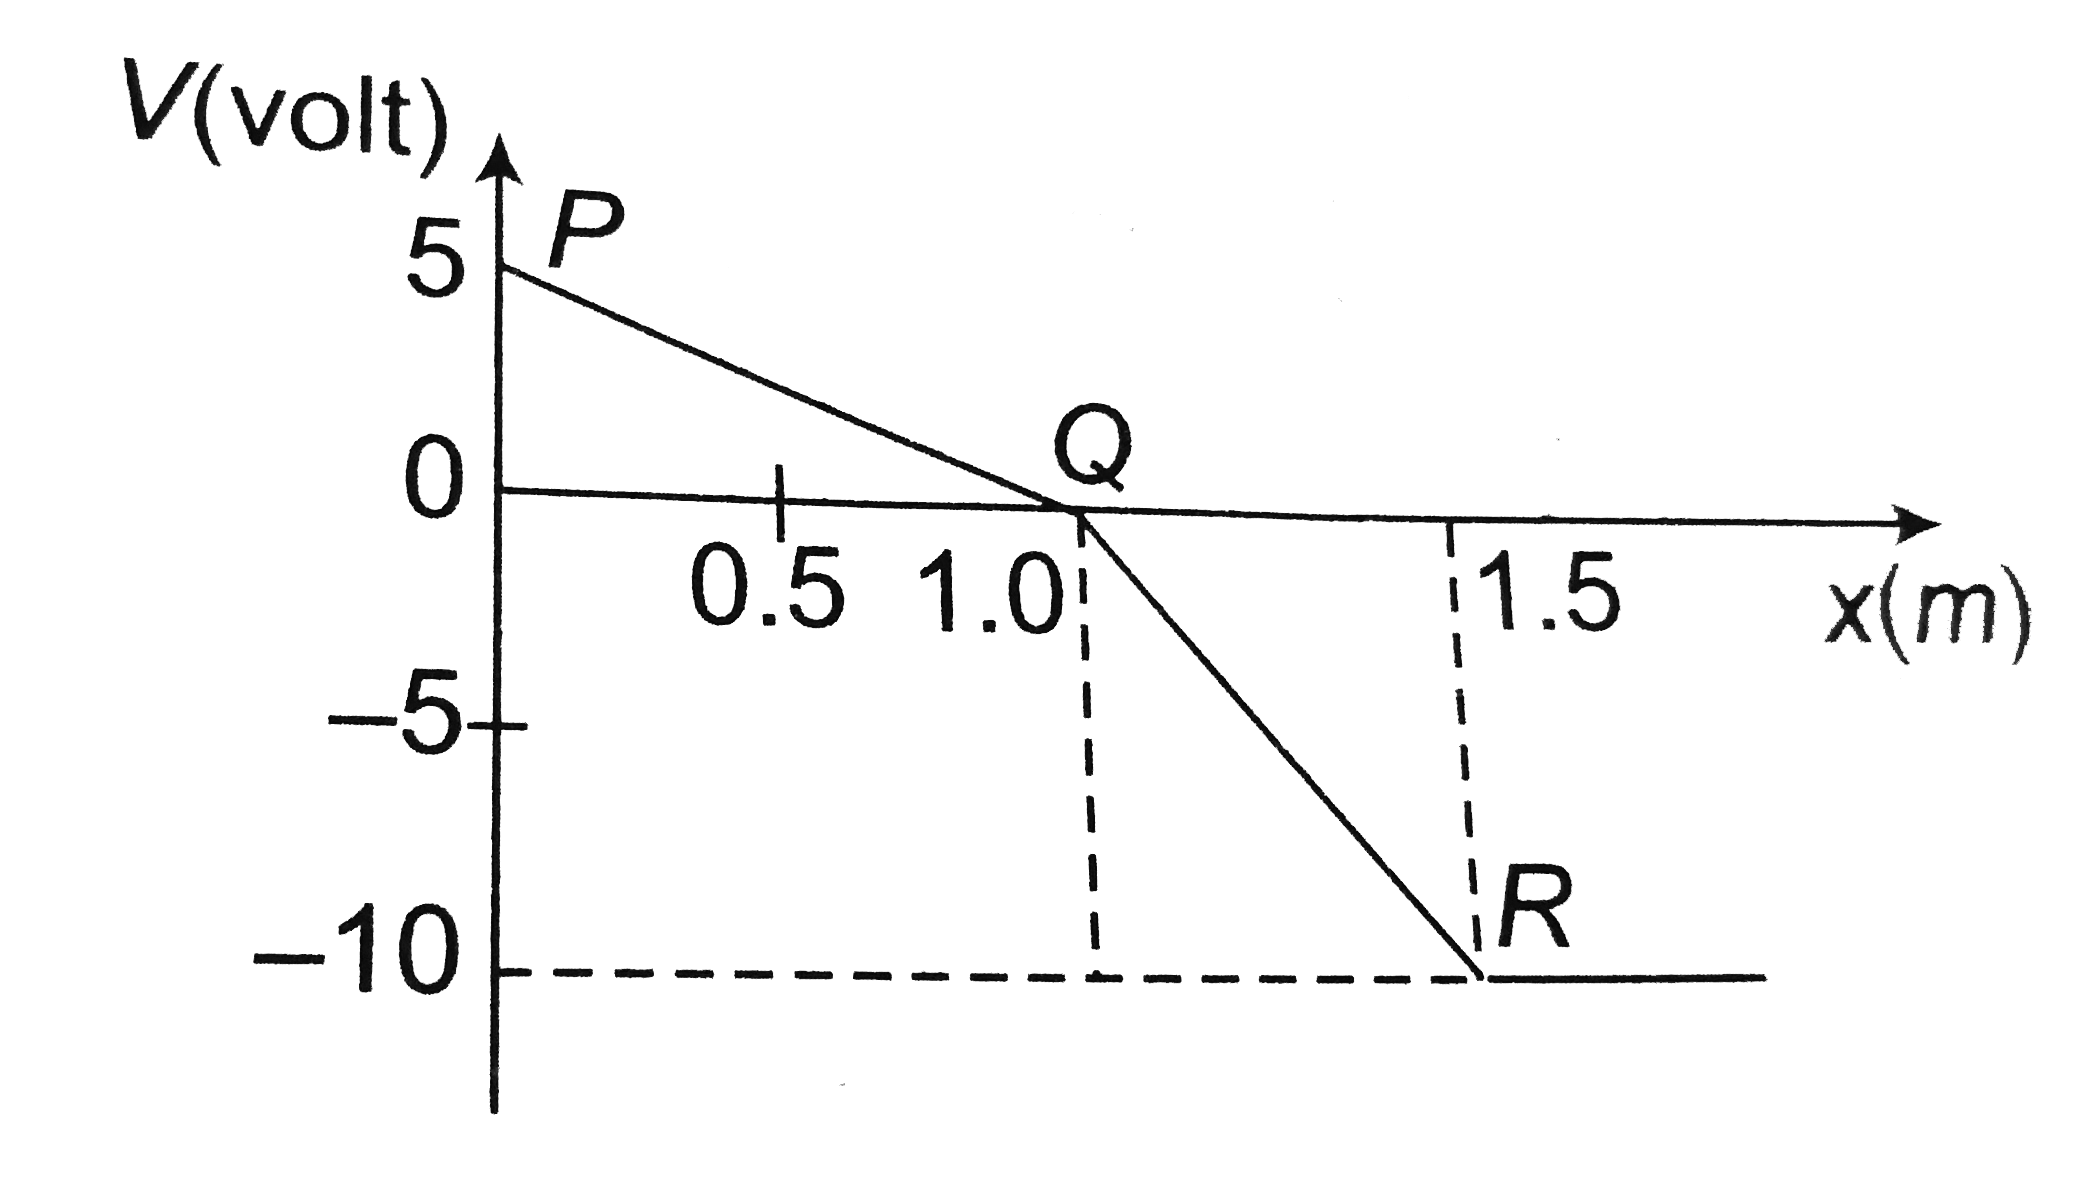
The electrical potential function for an electrical field directed parallel to the x-axis is shown in the given graph.
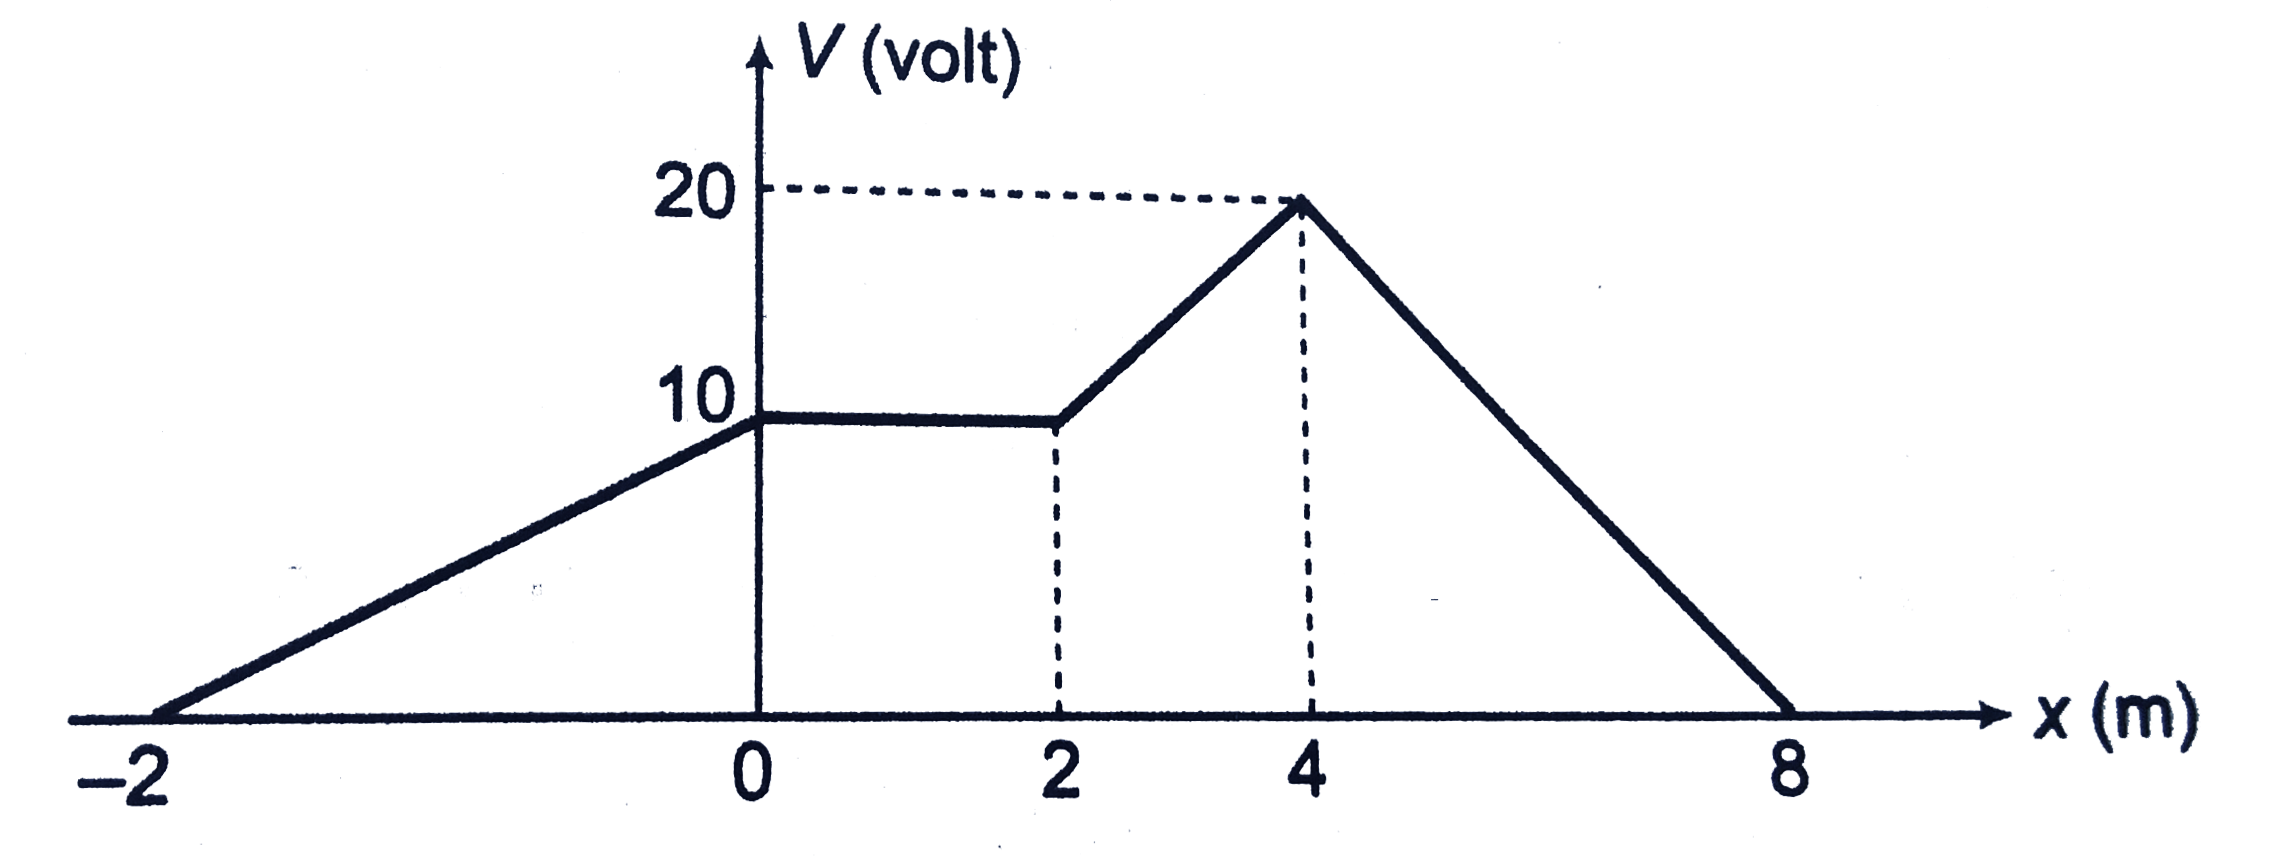 Draw the graph of electric field strength.
Video Solution
Text Solution
The correct Answer is:A, B, C, D
E=−dVdx=− Slope V-x graph.
From x=−2m to x=0, slope =+5V/m
∴E=−5V/m
From x=0 to x=2m, slope =0
∴E=0
From x=2m to x=4m,slope=+5V//m,<br>:. E=-5V//m<br>Fromx=4m→x=8m, slope x=−−5V/m
∴E=+5V/m
Corresponding E-x graph is as shown in answer.
|
Topper's Solved these Questions
- ELECTROSTATICSBOOK - DC PANDEYCHAPTER - ELECTROSTATICSEXERCISE - Level 1 Objective
82 Videos
- ELECTROSTATICSBOOK - DC PANDEYCHAPTER - ELECTROSTATICSEXERCISE - Level 1 Subjective
15 Videos
- ELECTROSTATICSBOOK - DC PANDEYCHAPTER - ELECTROSTATICSEXERCISE - Exercise 24.7
2 Videos
- ELECTROSTATIC POTENTIAL AND CAPACITORSBOOK - DC PANDEYCHAPTER - ELECTROSTATIC POTENTIAL AND CAPACITORSEXERCISE - (C) Chapter exercises
50 Videos
- GRAVITATIONBOOK - DC PANDEYCHAPTER - GRAVITATIONEXERCISE - All Questions
120 Videos
Similar Questions
Knowledge Check
The electrical potential function for an electrical field directed parallel to the x - axis is shown in (Fig. 3.152).
 .
.
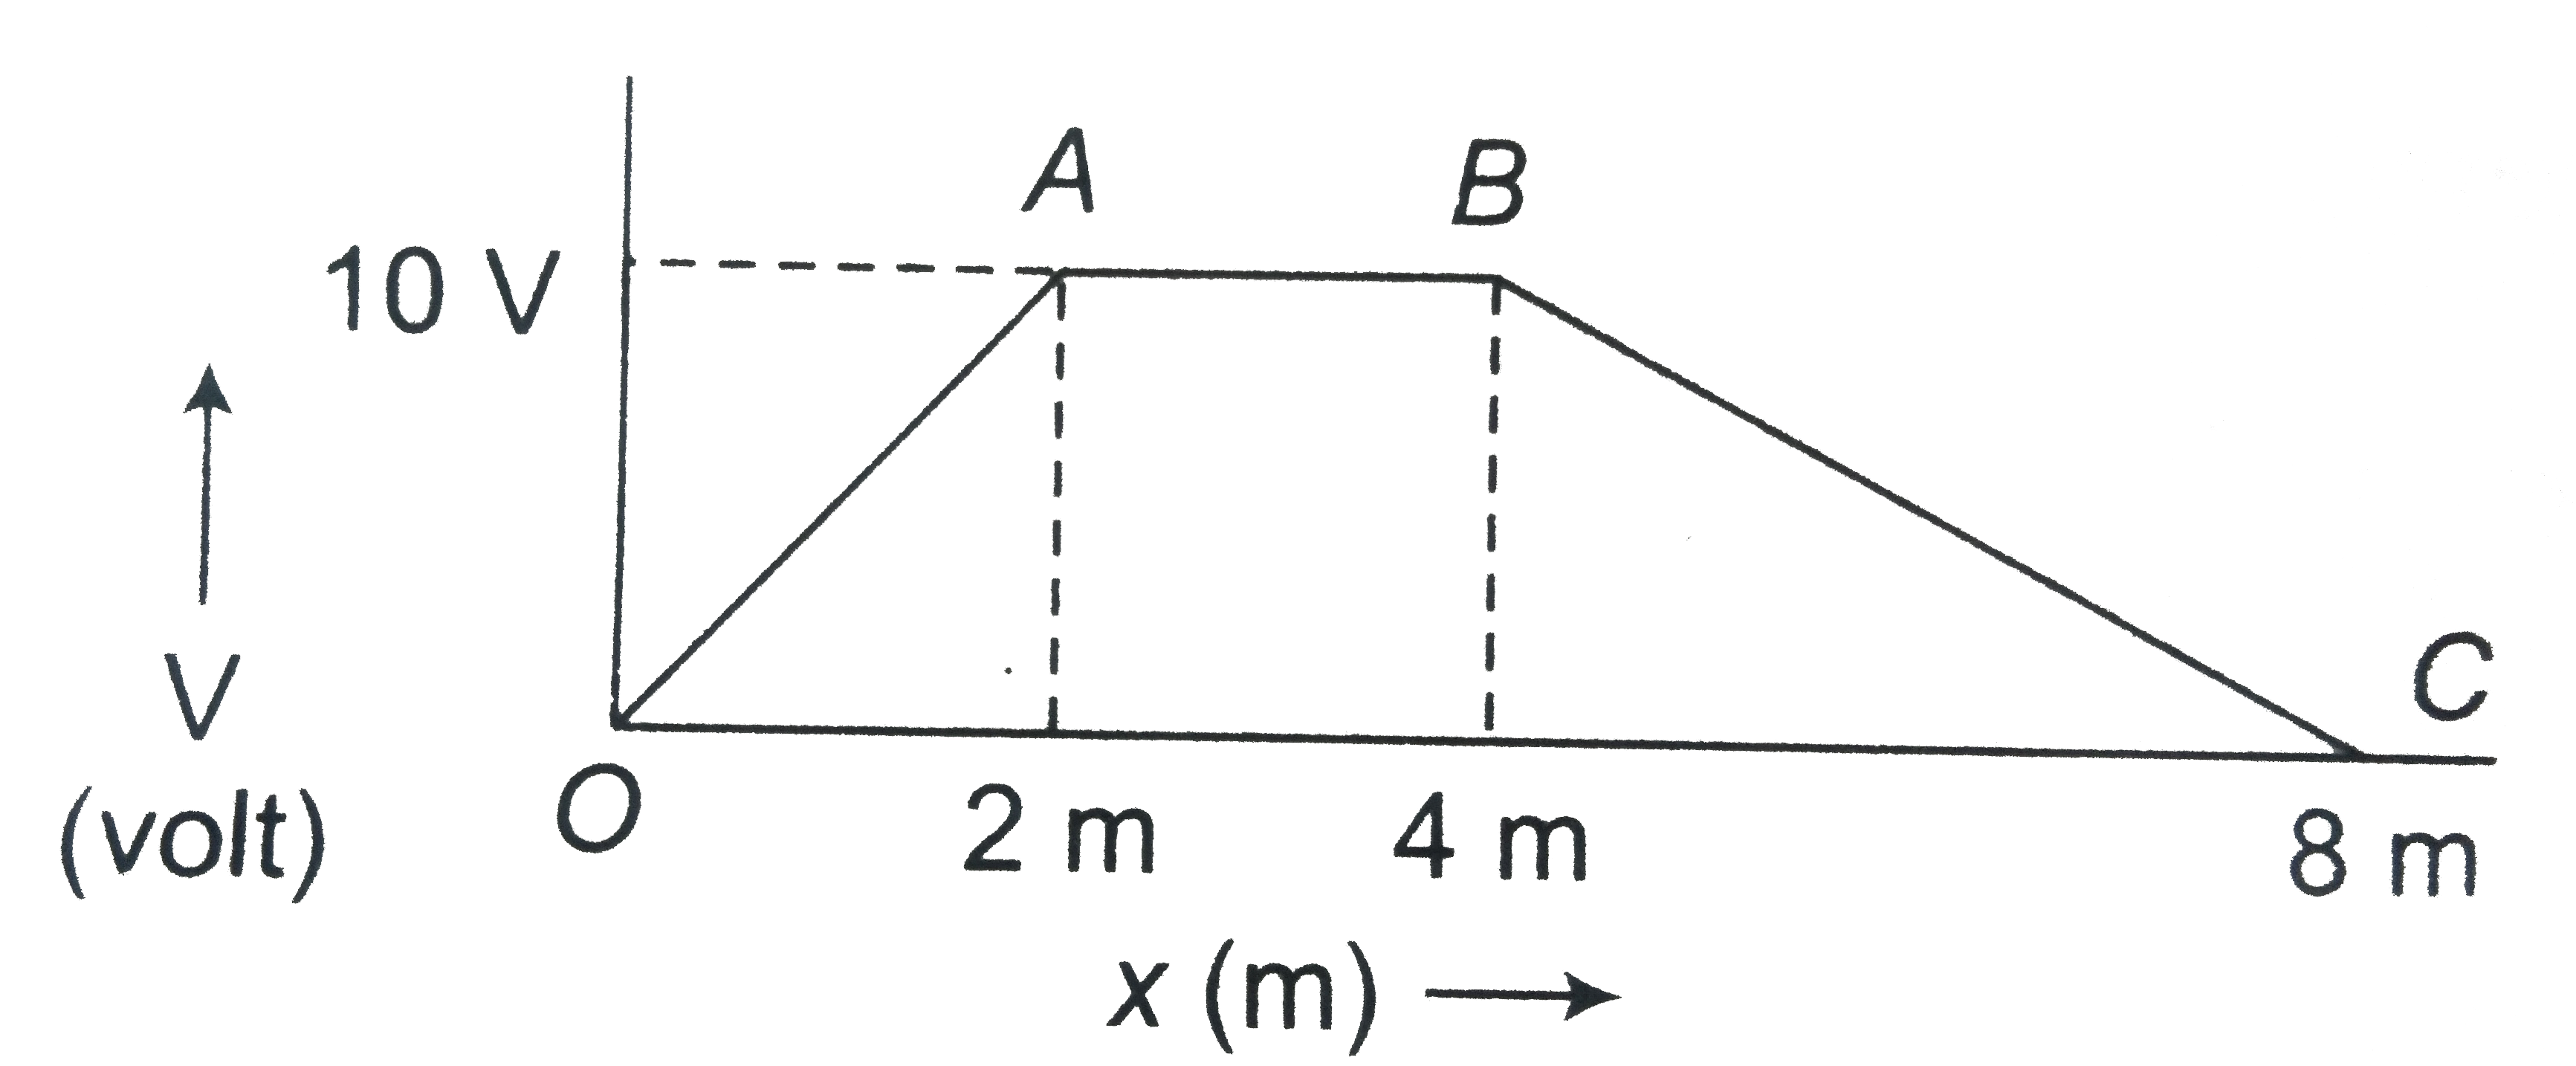
The magnitude of the electric field in the x - direction in the interval 4≤x≤8 isA2.5NC−1B5NC−1C−2.5NC−1D−5NC−1In the following graph , the magnitude of maximum electric field is
 A5V/mB2.5V/mC1.25V/mD10V/m
Due to an electric dipole shown in fig., the electric field intensity is parallel to dipole axis :
 Aat P onlyBat Q onlyCboth at P and at QDneither at P nor at Q
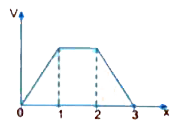
The electric potential as a function of distance 'x' is shown in the figure . Draw a graph of the electric field E as a function of x.
View SolutionThe electric potential is V=(x2−2x). What is the electric field strength at x=1?
View SolutionExamples||Graphs On Electric Field
View SolutionThe potential field of an electric field →E=(yˆi+yˆi) is
View SolutionIn an electric field region, the electric potential varies along the x-axis as shown in the graph. The x components of the electirc field in the regions for the intervals PQ and QR as market in the garph, in N/C, are respectively:
View Solution

 .
.