The p-T graph for the given mass of an ideal gas is shown in figure. What inference can be drawn regarding the change in volume (whether it is constant, increasing or decreasing) ?
How to proceed Definitely, it is not constant. Because when volume of the gas is constant p−T graph is a straight line passing through origin. The given line does not pass through origin, hence volume is not constant. 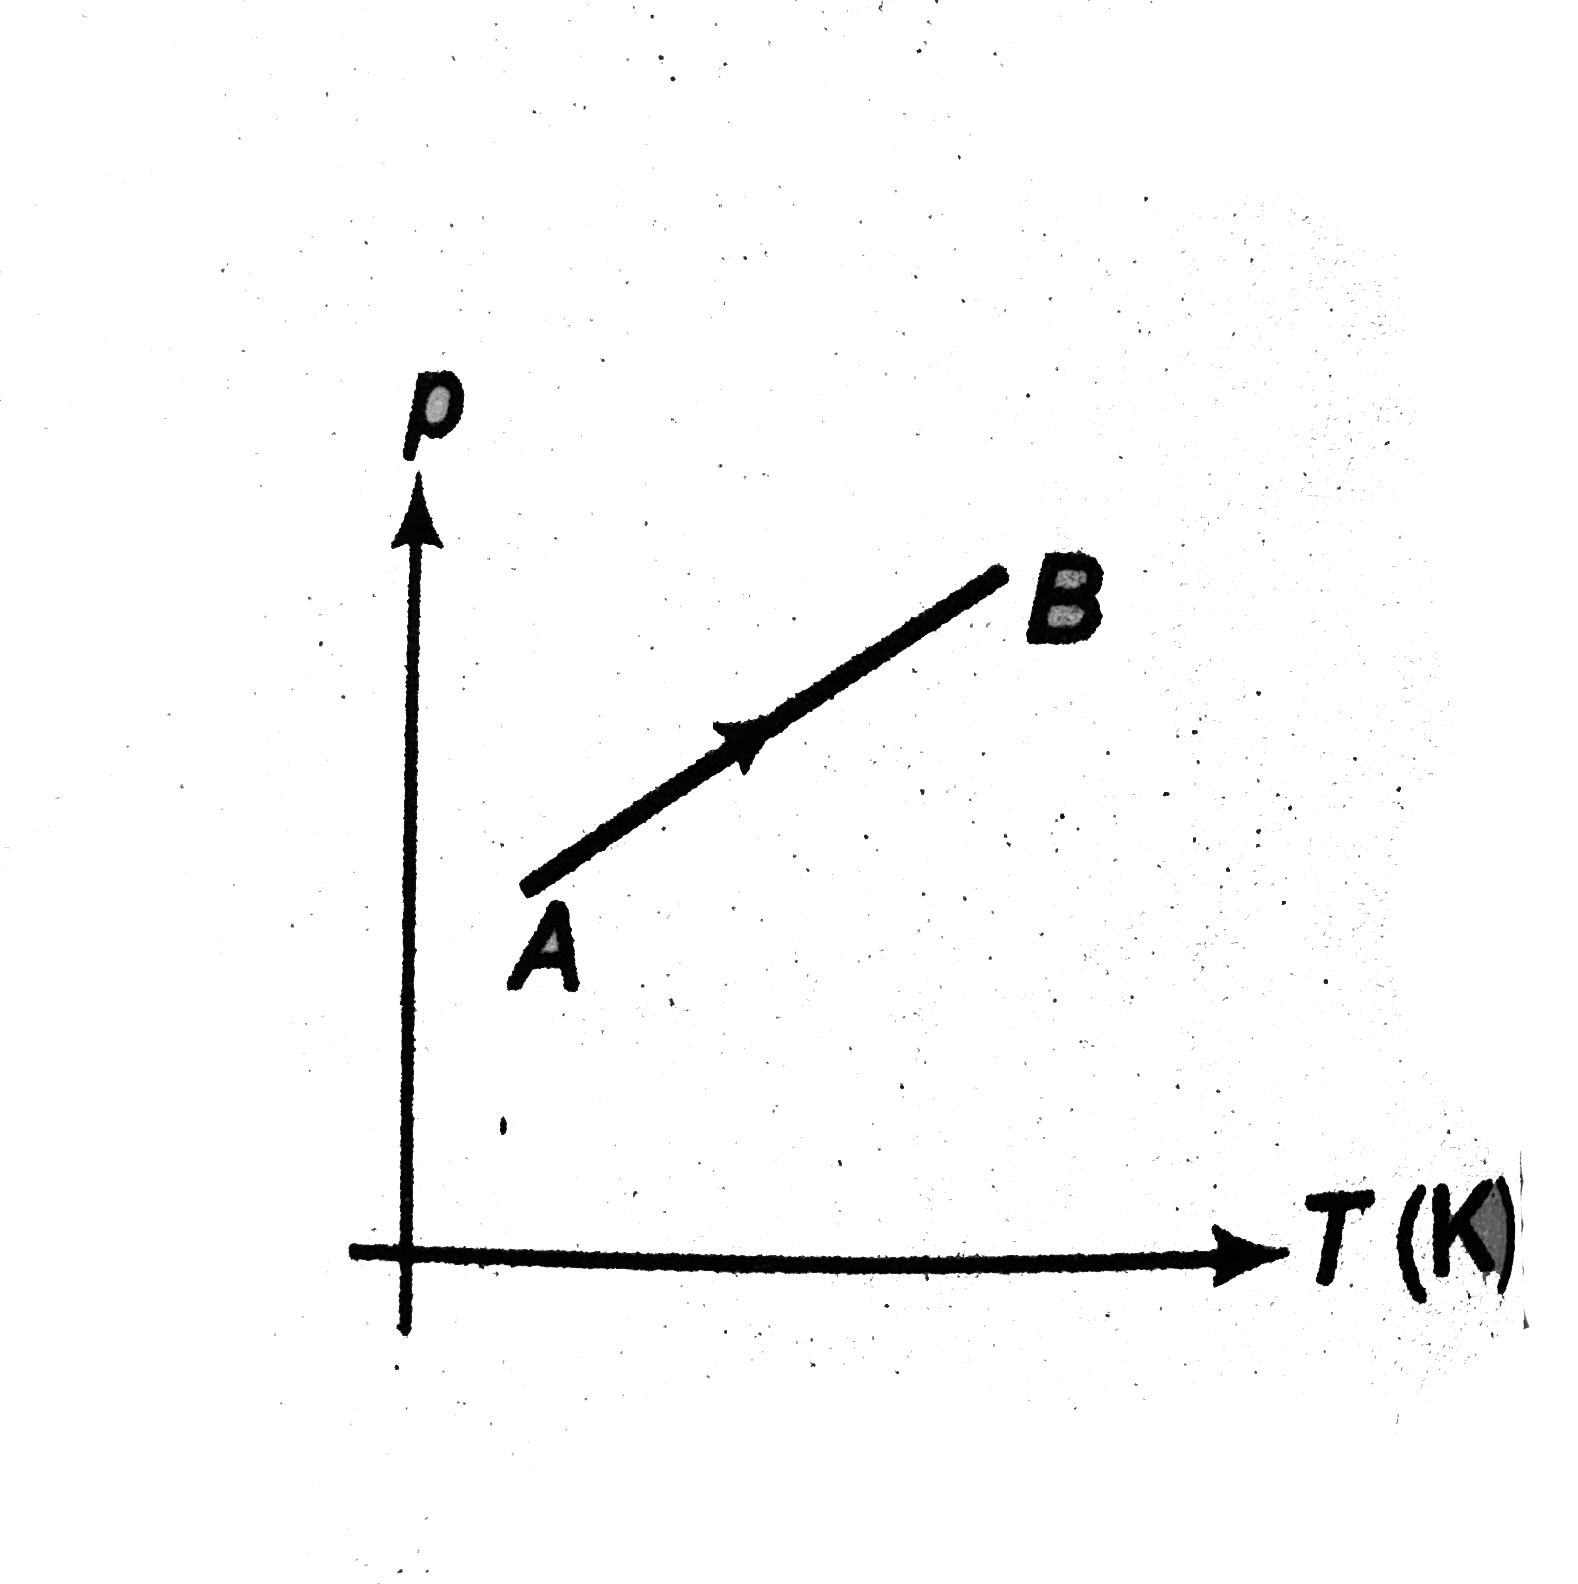 .
.
V=(nR)(TP)
Now, to see volume of the gas we will have to see whether TP is increasing or decreasing.
The correct Answer is:A, B
From the given graph, we can write the p−Tequation as
p=aT+b
Now, TB>TA
:. bTB<bTAor(PT)B<(PT)A
or (TP)B>(PT)A
or VB>VA
Thus, as we move from A to B, volume of the gas is increasimg.
Topper's Solved these Questions
- THERMOMETRY,THERMAL EXPANSION & KINETIC THEORY OF GASESBOOK - DC PANDEYCHAPTER - THERMOMETRY,THERMAL EXPANSION & KINETIC THEORY OF GASESEXERCISE - Example Type 1
1 Video
- THERMOMETRY,THERMAL EXPANSION & KINETIC THEORY OF GASESBOOK - DC PANDEYCHAPTER - THERMOMETRY,THERMAL EXPANSION & KINETIC THEORY OF GASESEXERCISE - Example Type 2
1 Video
- THERMOMETRY THERMAL EXPANSION AND KINETIC THEORY OF GASESBOOK - DC PANDEYCHAPTER - THERMOMETRY THERMAL EXPANSION AND KINETIC THEORY OF GASESEXERCISE - Medical entrance gallary
30 Videos
- UNIT AND DIMENSIONSBOOK - DC PANDEYCHAPTER - UNIT AND DIMENSIONSEXERCISE - Assertion And Reason
2 Videos
Similar Questions
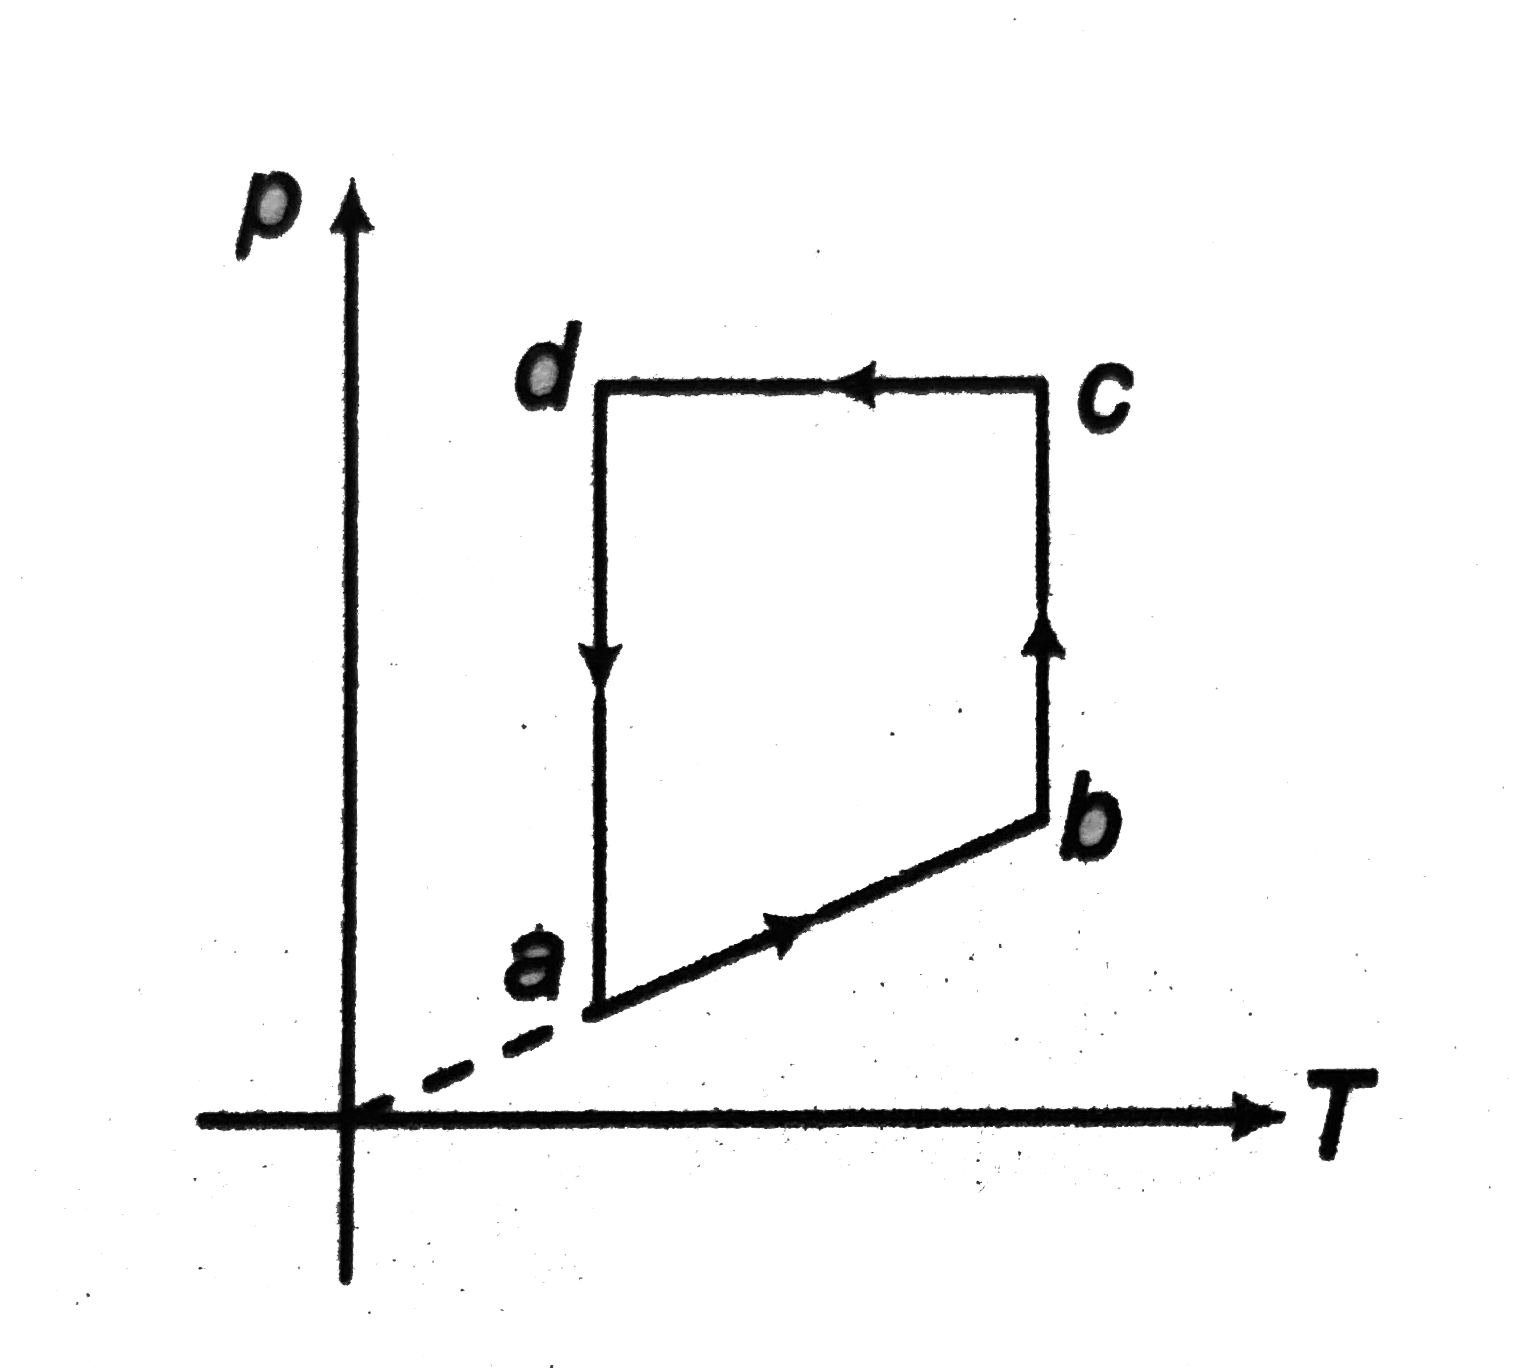
Corresponding to (p - T) graph as shown in figure, draw
(a) P - V graph
(b) V - T graph
( c) ρ - T graph and
(d) U - T graph.
View SolutionAn insulated box containing a monoatomic gas of molar mass (M) moving with a speed v0 is suddenly stopped. Find the increment is gas temperature as a result of stopping the box.
View SolutionA fiven sample of an ideal gas occupise a volume V at a pressure p and sbsoulte temperature T.The mass of each molecule of the gas is m. Which of the following fives the dinsity of the gas ?
View SolutionAssertion Velocity , volume and acceleration can be taken as fundemental quantities because
Reason: All the three are independent from each other .
View SolutionStraight line on (p - T) graph for an ideal gas represents isochoric process.
If p∝T,V=constant.
View SolutionThe P-T graph for the given mass of an ideal gas is shown in figure. Then the volume
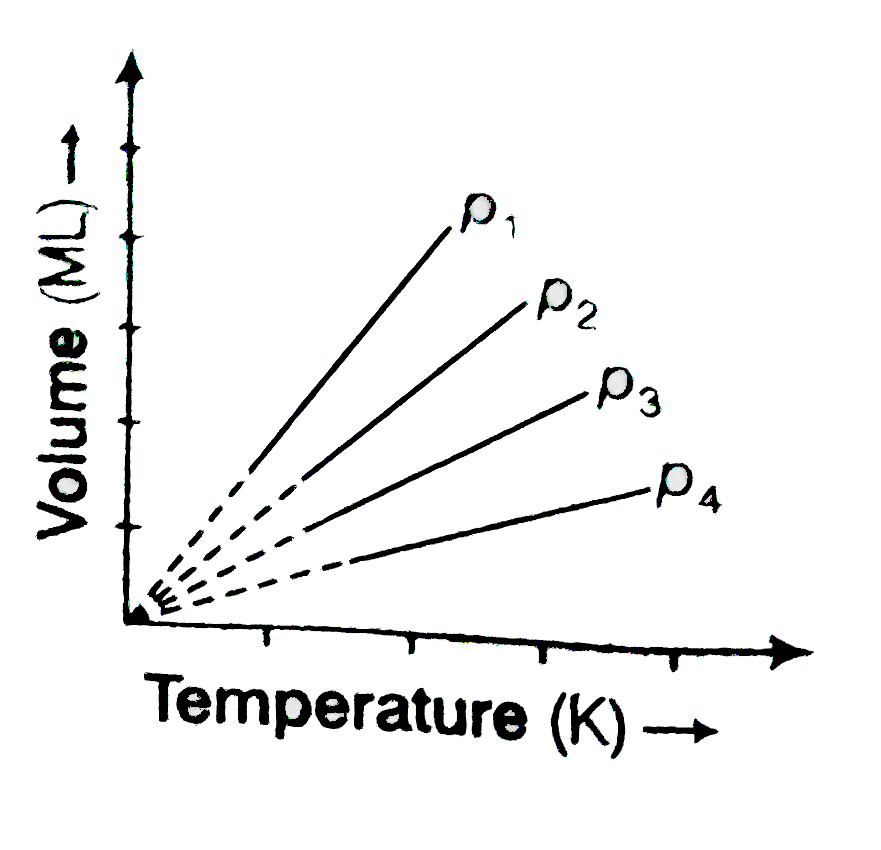
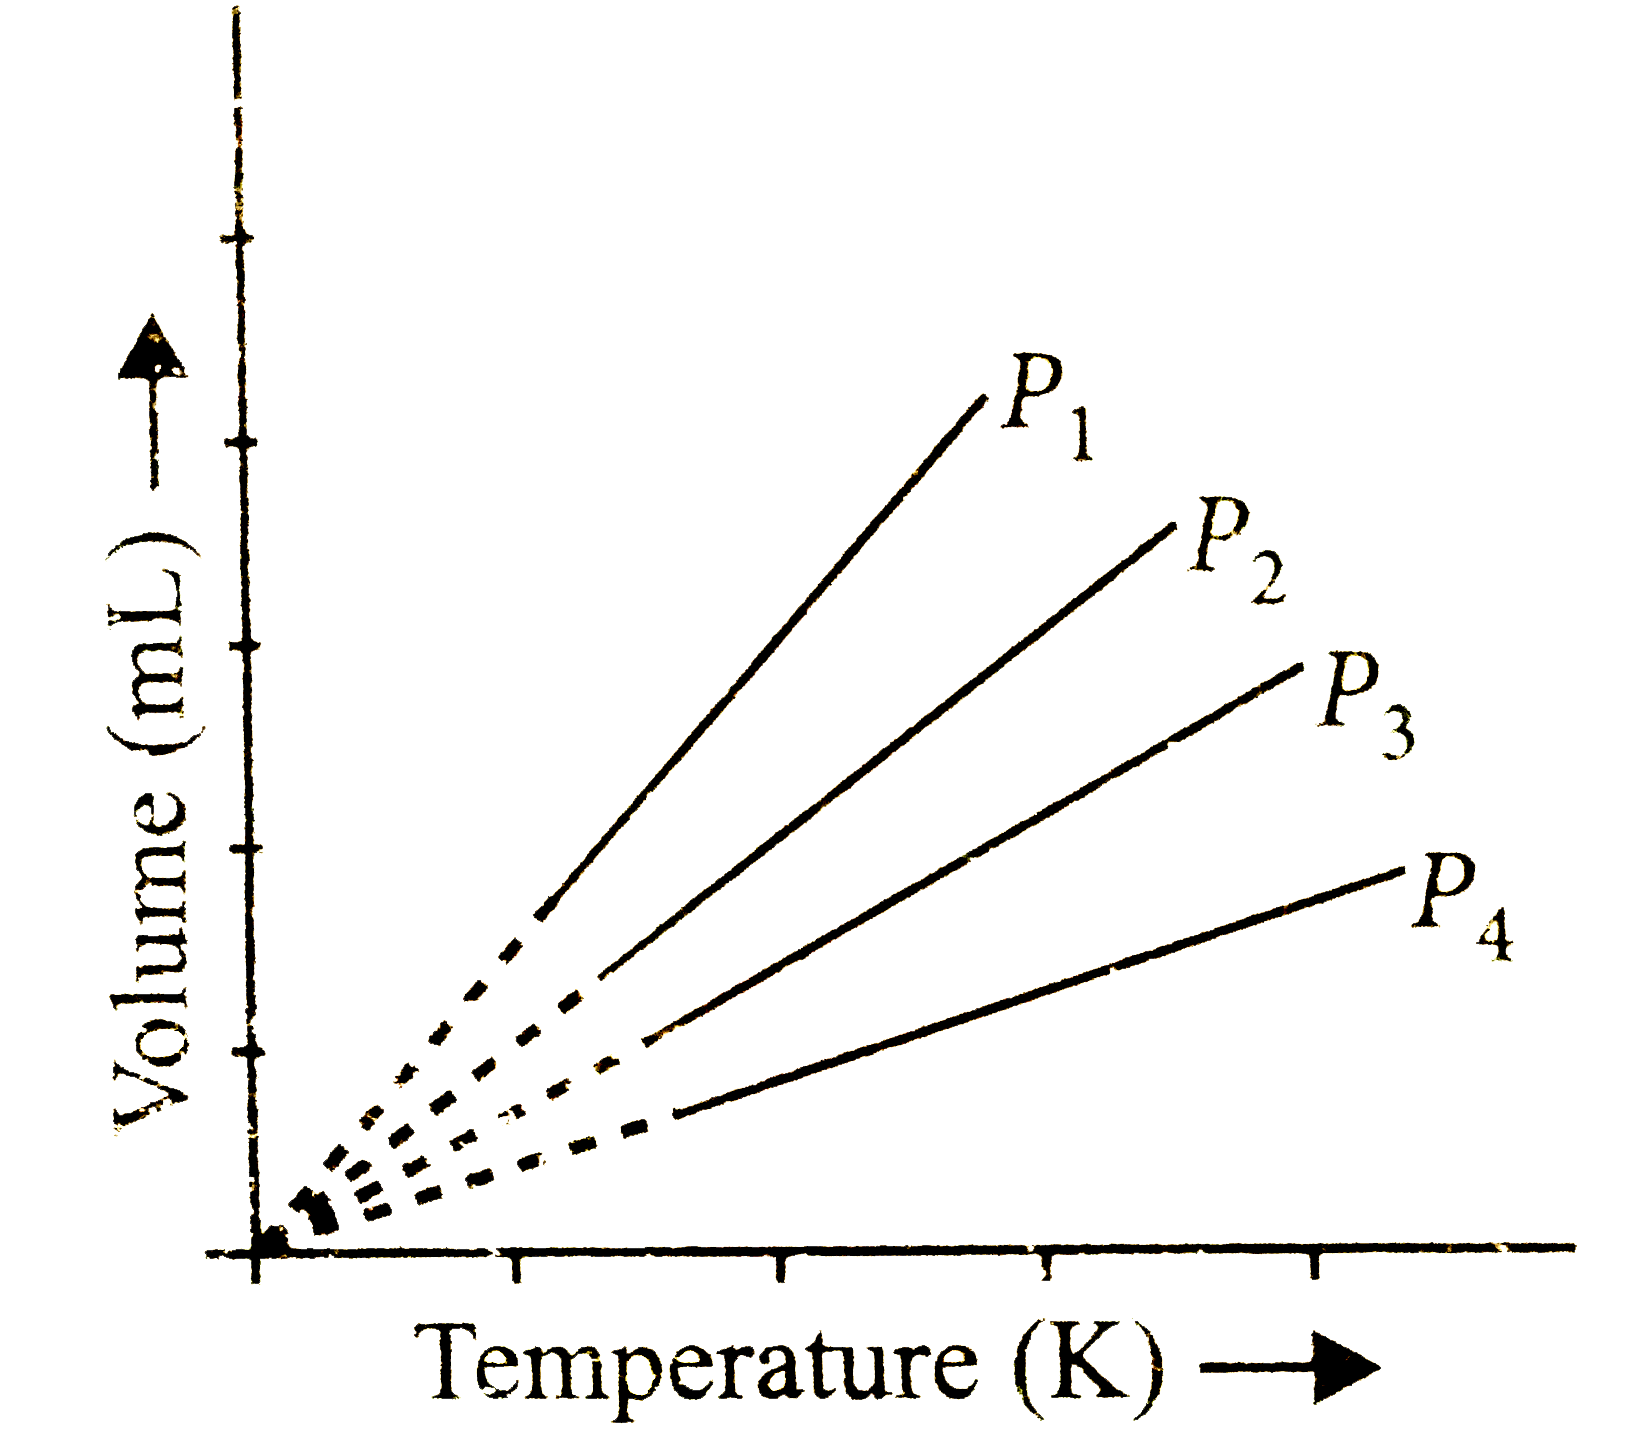
View SolutionA plot of volume (V) versus temperature (T) for a gas at constant pressure is a straight line passing through the origin. The plots at different values of pressure are shown in figure. Which of the following order of pressure is correct for this gas ?
View SolutionThe p-T graph for the given mass of an ideal gas is shown in figure. What inference can be drawn regarding the change in Volume (whtherit is constant, increasing or decreasing) ?
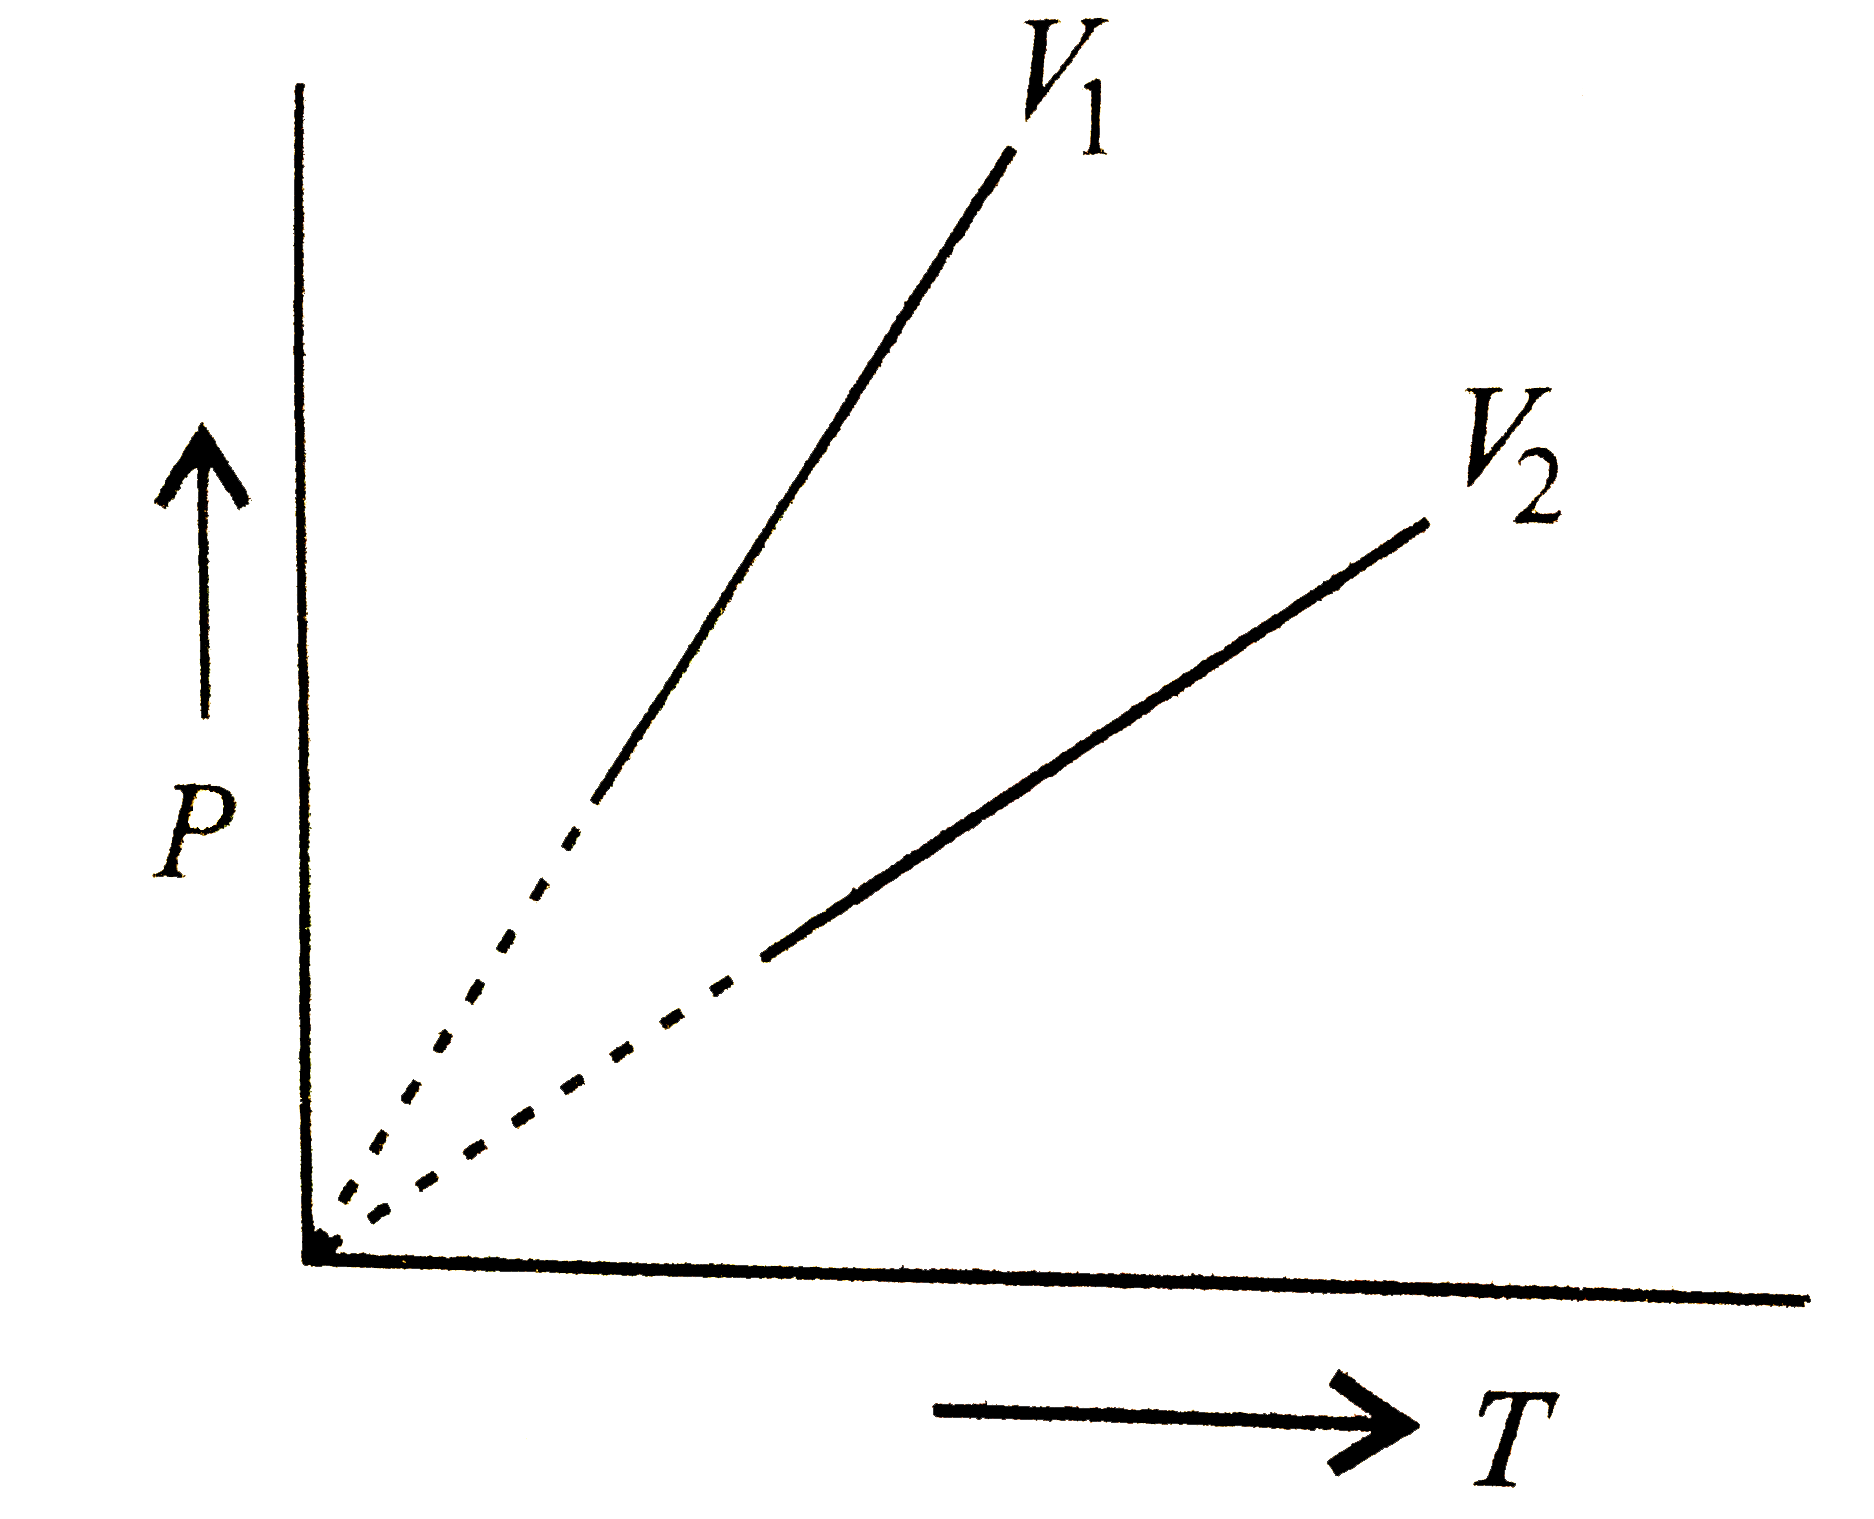
View SolutionA plot of P vs T for a given mass of gas at constant volume is a straight line . P vs T at constant volumes V1 and V2 for an ideal gas are shown below :
Which of the following is correct ?
View SolutionThe plot of pressure (P) versus temperature (T) for an ideal gas will be a straight line passing through the origin if ______and ______remain constant.
View SolutionThe graph between (P/T) and T for a gas at constant volume will be:
View SolutionThe graph of P vs T is a straight line for a given mass of a gas at a fixed volume. Fixed volume for an ideal gas V_(1) "व" V_(2) But P vs T is shown Which of the following is correct ?
View SolutionA plot of volume (V) versus temperature (T) for a gas at constant pressure is a straight line passing through the origin. The plots at different values of pressure are shown in figure. Which of the following order of pressure is correct for this gas ?

View Solution(A) : V-t graph for a gas at constant pressure is a straight line passing through origin [t - temp in celsius]
( R) : Volume of a gas is inversely proportional to its absolute temperature at constant pressure.
View SolutionA plot of P vs T for a given mass of gas at constant volume is a straight line . P vs T at constant volumes V_(1) and V_(2) for an ideal gas are shown below : Which of the following is correct ?
View SolutionA plot of volume (V) versus temperature (T) for a gas at constant pressure is a straight line passing through the origin . The plots at different values of pressure are shown in figure .
Which of the following order of pressure is correct for this gas ?
View Solution
