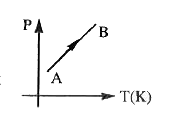
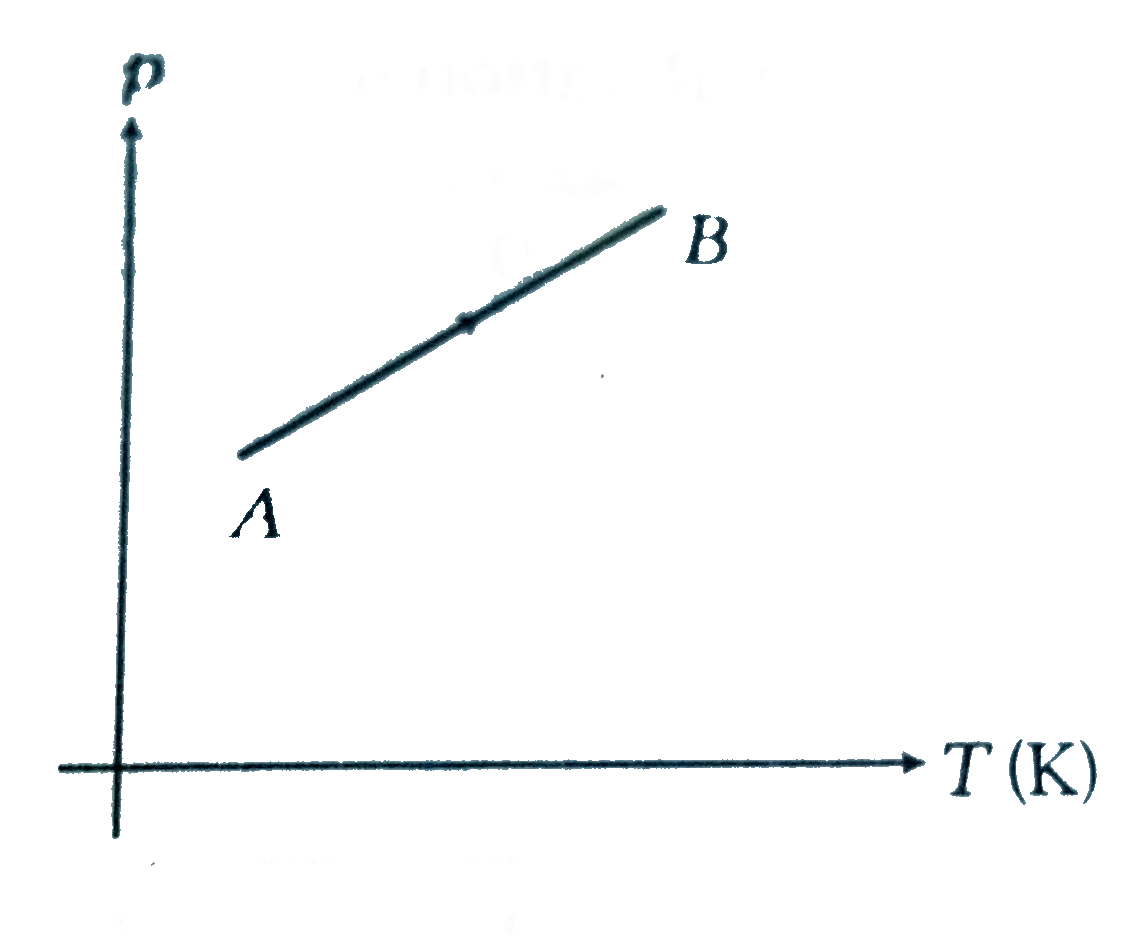
The P-T graph for the given mass of an ideal gas is shown in figure. Then the volume
 Solution in Telugu
increases
decreases
remains constant
data insufficient
The correct Answer is:A
Step by step video, text & image solution for The P-T graph for the given mass of an ideal gas is shown in figure. Then the volume by Physics experts to help you in doubts & scoring excellent marks in Class 11 exams.
Updated on:21/07/2023Similar Questions
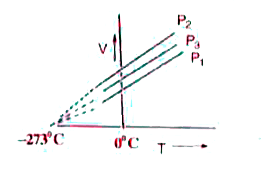
The volume-temperature graphs of a given mass of an ideal gas at constant pressures are shown below. What is the correct order of pressures?
View SolutionA plot of P vs T for a given mass of gas at constant volume is a straight line . P vs T at constant volumes V_(1) and V_(2) for an ideal gas are shown below : Which of the following is correct ?
View SolutionPlot P-V, V-T and p-T graph correspongidng to the P-T graph for an ideal gas shown in figure.
View SolutionThe p-T graph for the given mass of an ideal gas is shown in figure. What inference can be drawn regarding the change in volume (whether it is constant, increasing or decreasing) ?
How to proceed Definitely, it is not constant. Because when volume of the gas is constant p−T graph is a straight line passing through origin. The given line does not pass through origin, hence volume is not constant.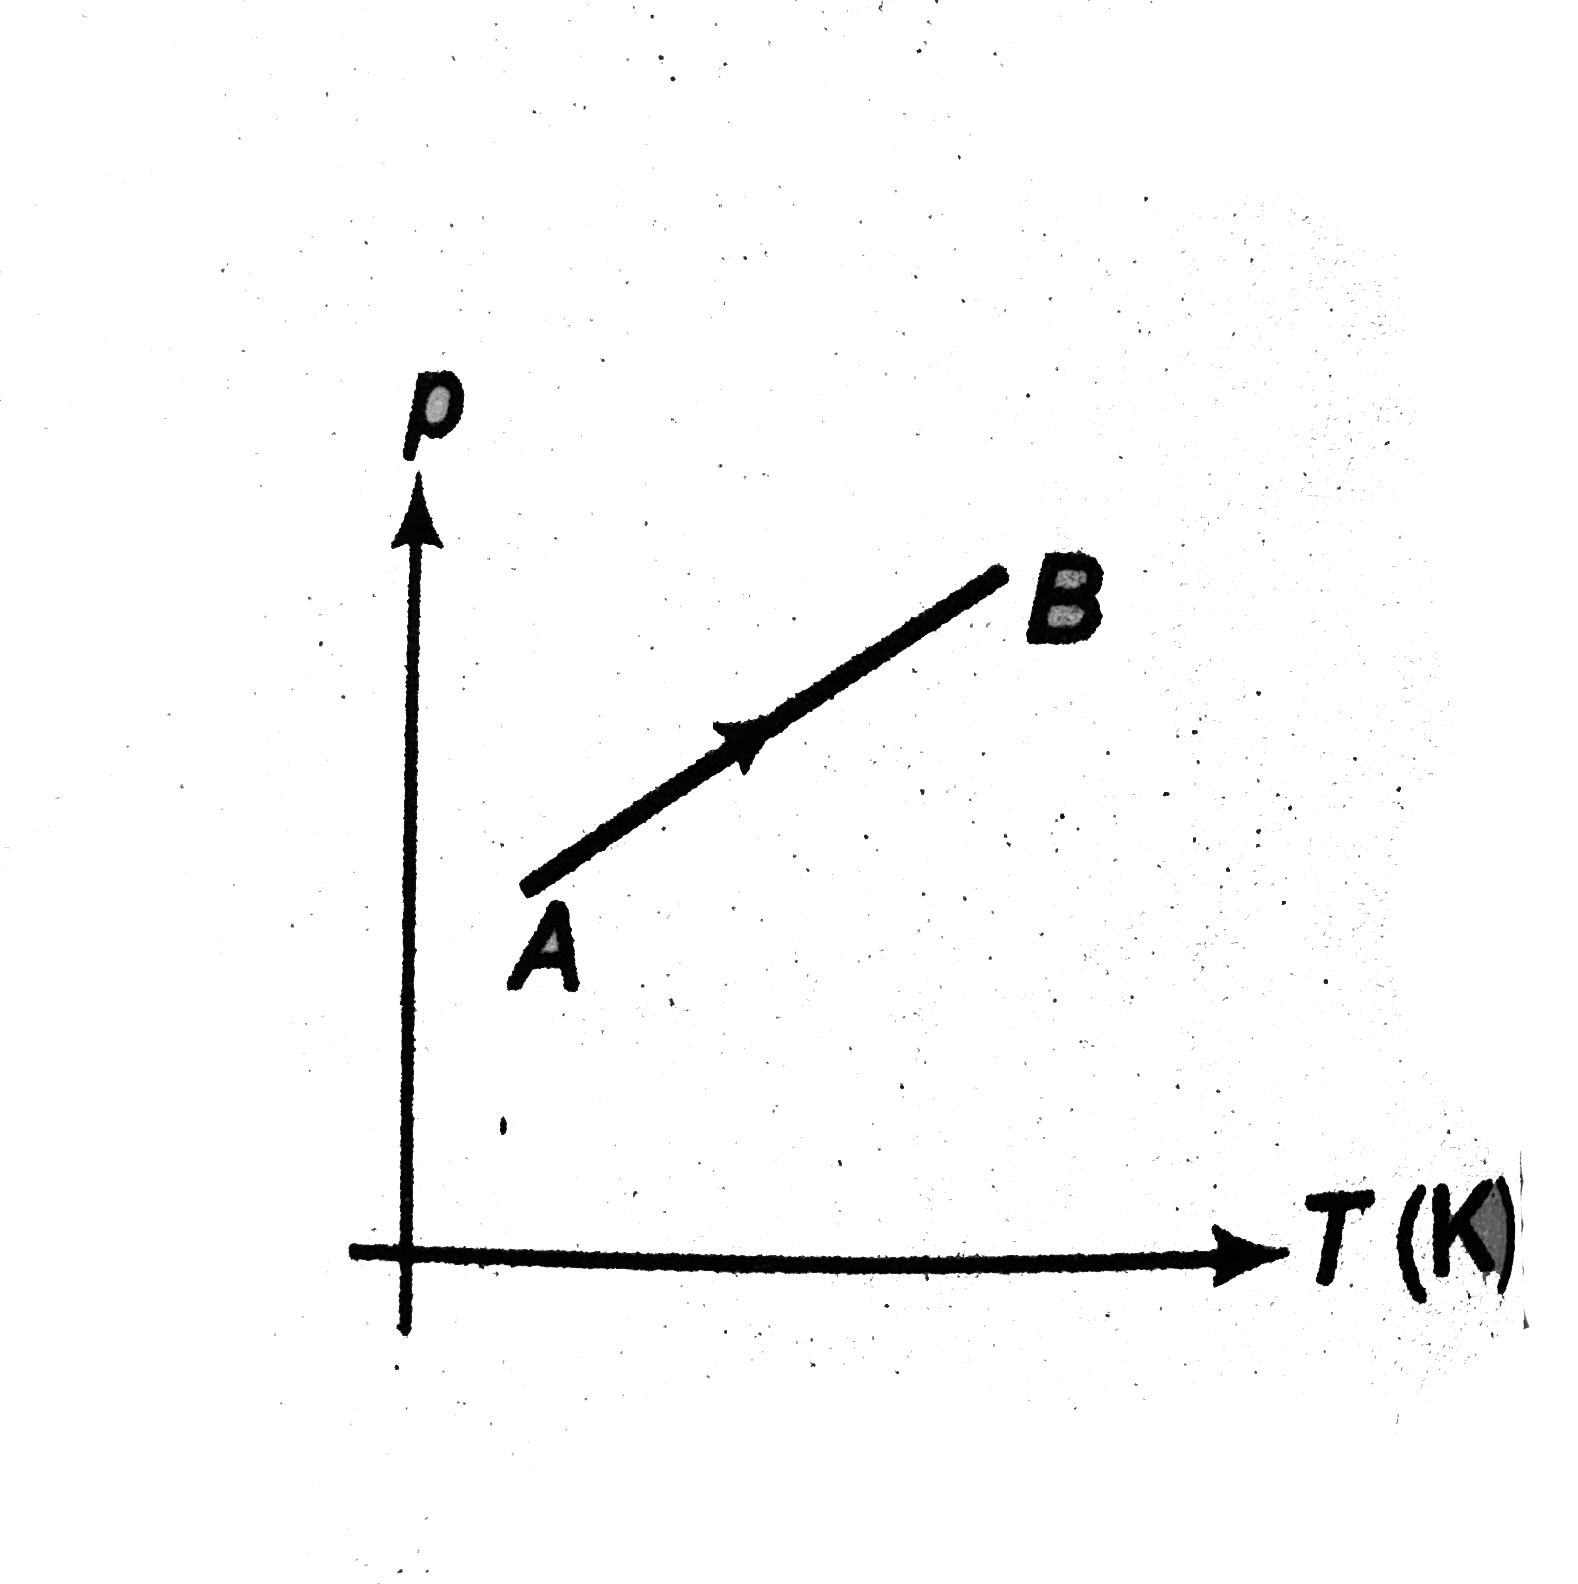 .
.
V=(nR)(TP)
Now, to see volume of the gas we will have to see whether TP is increasing or decreasing.
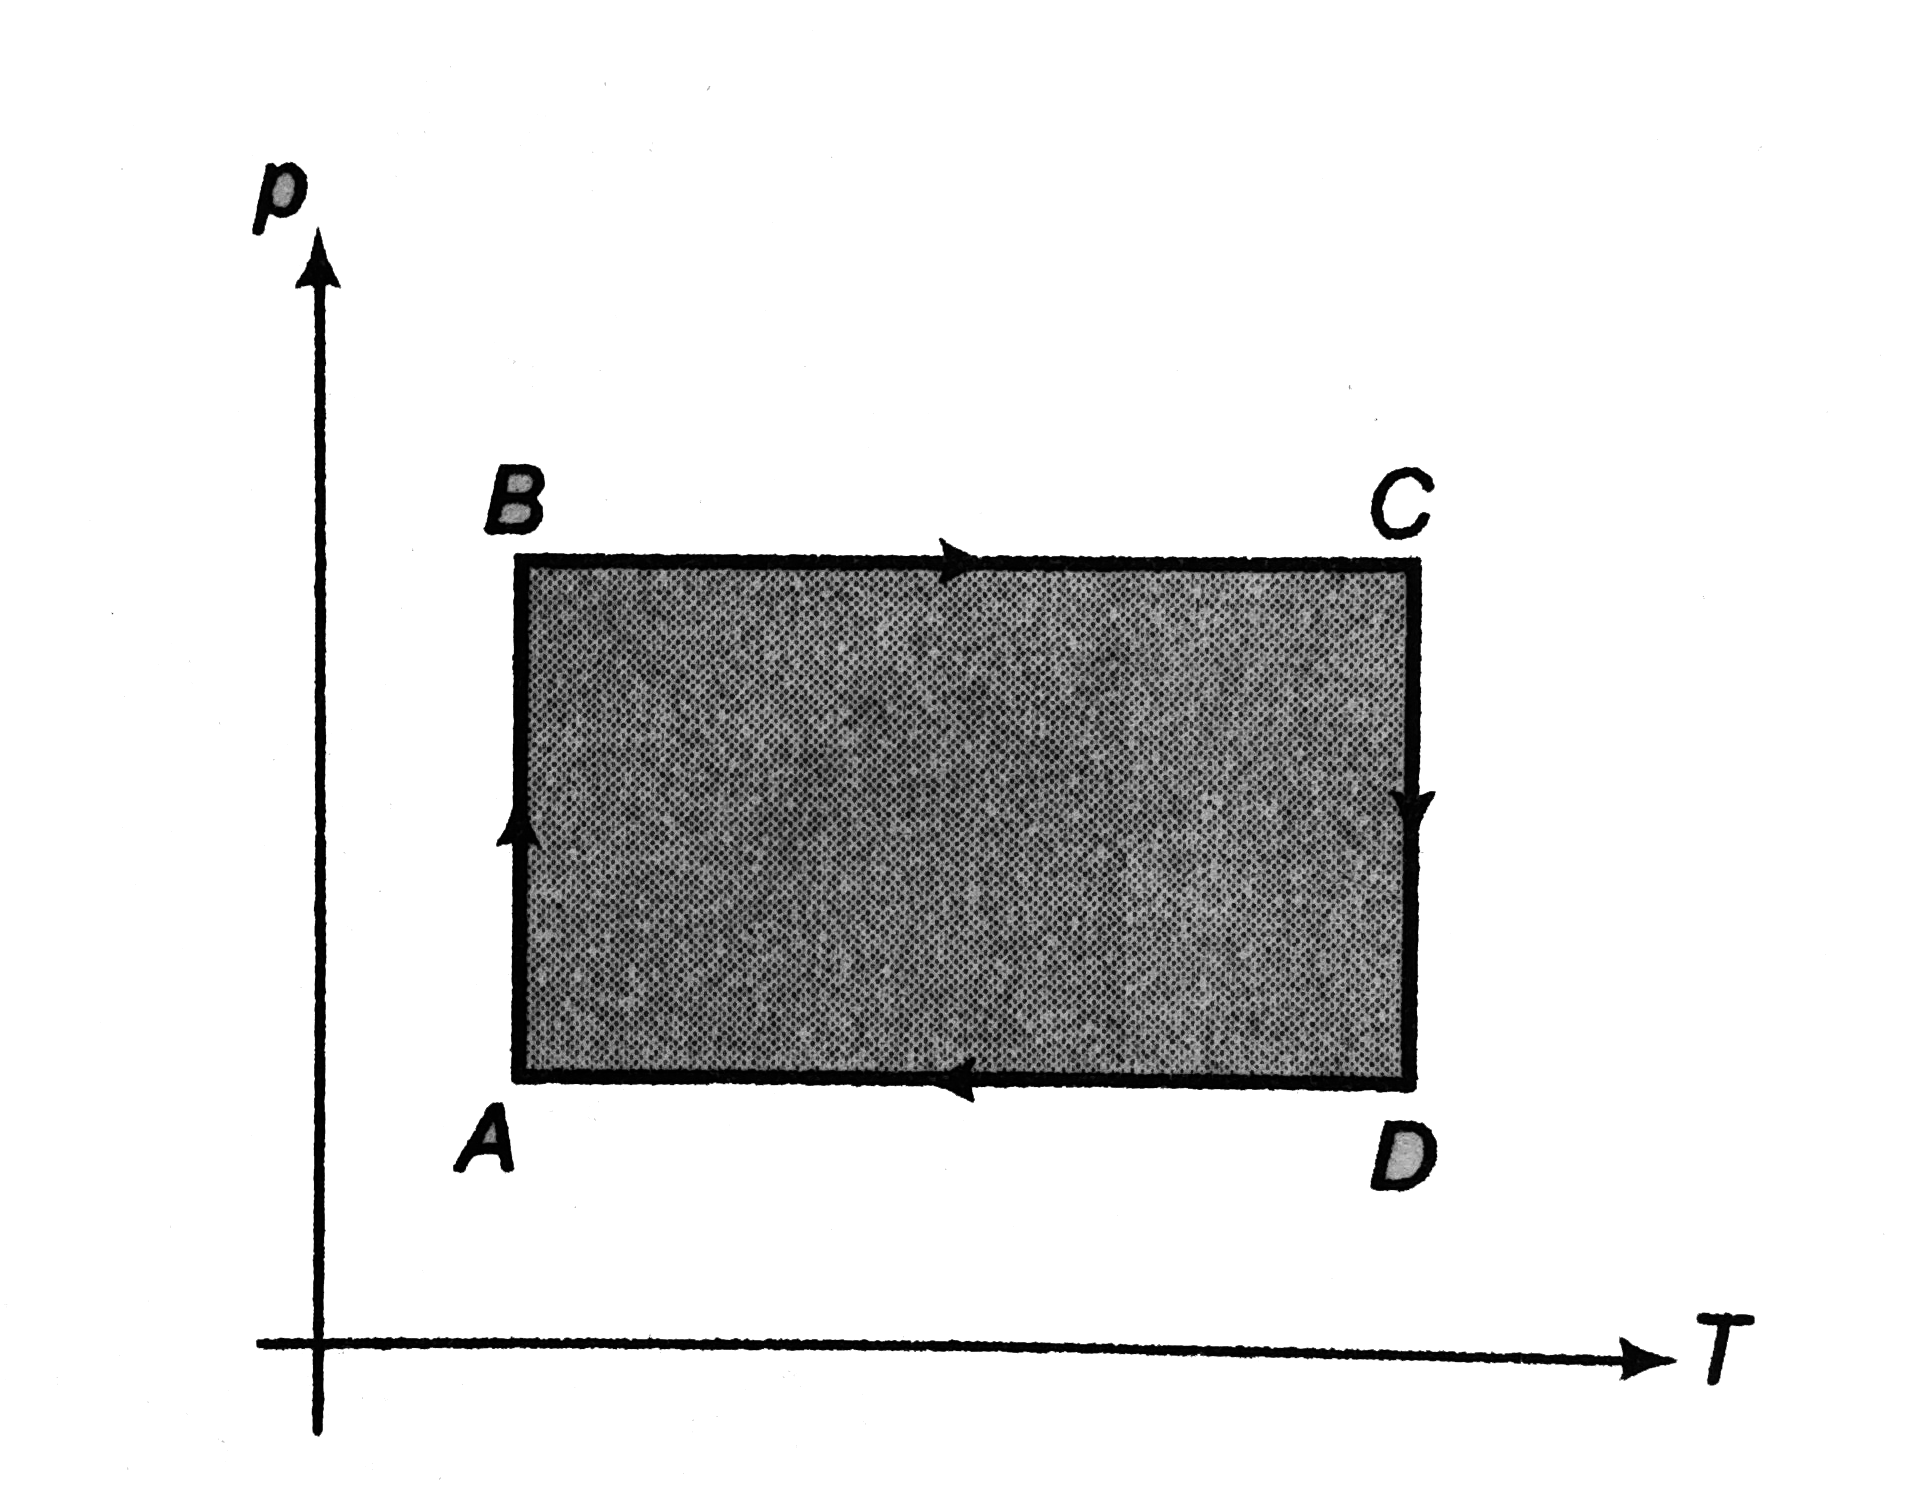
View SolutionPlot (p - V),(V - T) and (ρ - T) graph corresponding to the (p - T) graph for an ideal gas shown in figure.
 .
.
View SolutionThe p−T graph for the given mass of an ideal gas is shown in figure. What inference can be drawn regarding the change in Volume (whtherit is constant, increasing or decreasing) ?
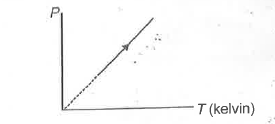
View SolutionThe graph of pressure and temperature for an ideal gas is as shown in figure. The given process is
View Solution

