The p−T graph for the given mass of an ideal gas is shown in figure. What inference can be drawn regarding the change in Volume (whtherit is constant, increasing or decreasing) ? 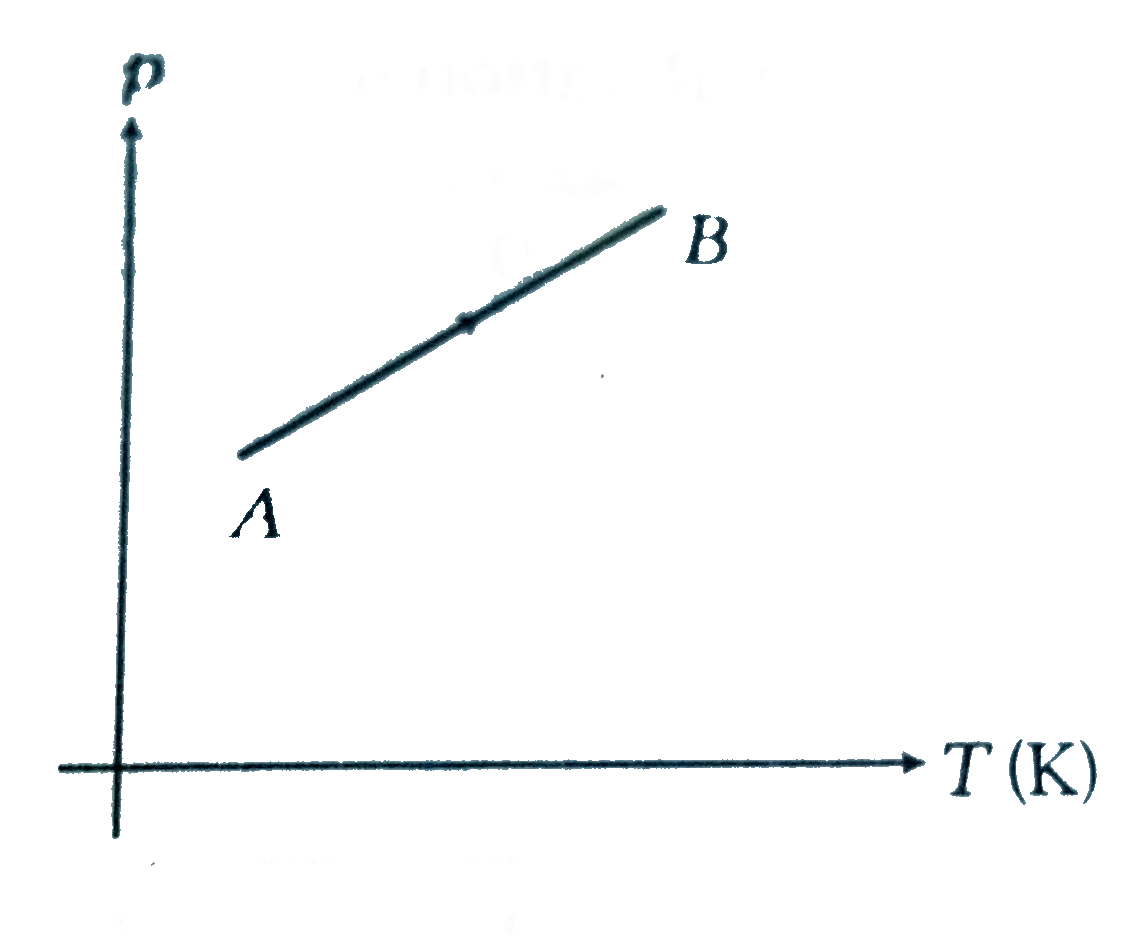
Form th given graph we can write the p−T equation as,
pT=a+bT
now, TB>TA
∴ bTB<bTA
or (pT)B<(pT)A
or (Tp)B>(pT)A
or VB>VA
Thus, us we move from A to B, volume of the is increasing.
Topper's Solved these Questions
- THERMOMETRY THERMAL EXPANSION AND KINETIC THEORY OF GASESBook:DC PANDEYChapter:THERMOMETRY THERMAL EXPANSION AND KINETIC THEORY OF GASESExercise:Check point 14.1
Explore 10 Videos
- THERMOMETRY THERMAL EXPANSION AND KINETIC THEORY OF GASESBook:DC PANDEYChapter:THERMOMETRY THERMAL EXPANSION AND KINETIC THEORY OF GASESExercise:Check point 14.2
Explore 20 Videos
- SUPERPOSITION OF WAVESBook:DC PANDEYChapter:SUPERPOSITION OF WAVESExercise:Level 2 Subjective
Explore 8 Videos
- THERMOMETRY,THERMAL EXPANSION & KINETIC THEORY OF GASESBook:DC PANDEYChapter:THERMOMETRY,THERMAL EXPANSION & KINETIC THEORY OF GASESExercise:Level 2 Subjective
Explore 9 Videos
Similar Questions
Knowledge Check
The P−T graph for the given mass of an ideal gas is shown in figure. Then the volume
_E01_022_Q01.png) AincreasesBdecreasesCremains constantDdata insuficient
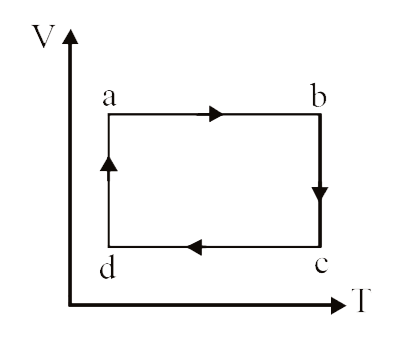
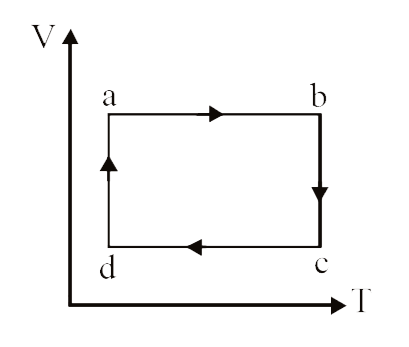
AincreasesBdecreasesCremains constantDdata insuficientV−T diagram for a process of given mass of ideal gas is as shown in fig. During the process pressure of the gas
_E01_072_Q01.png) AFirst increases then decreasesBFirst decreases then increasesCcontinously decreasesDcontinously increases
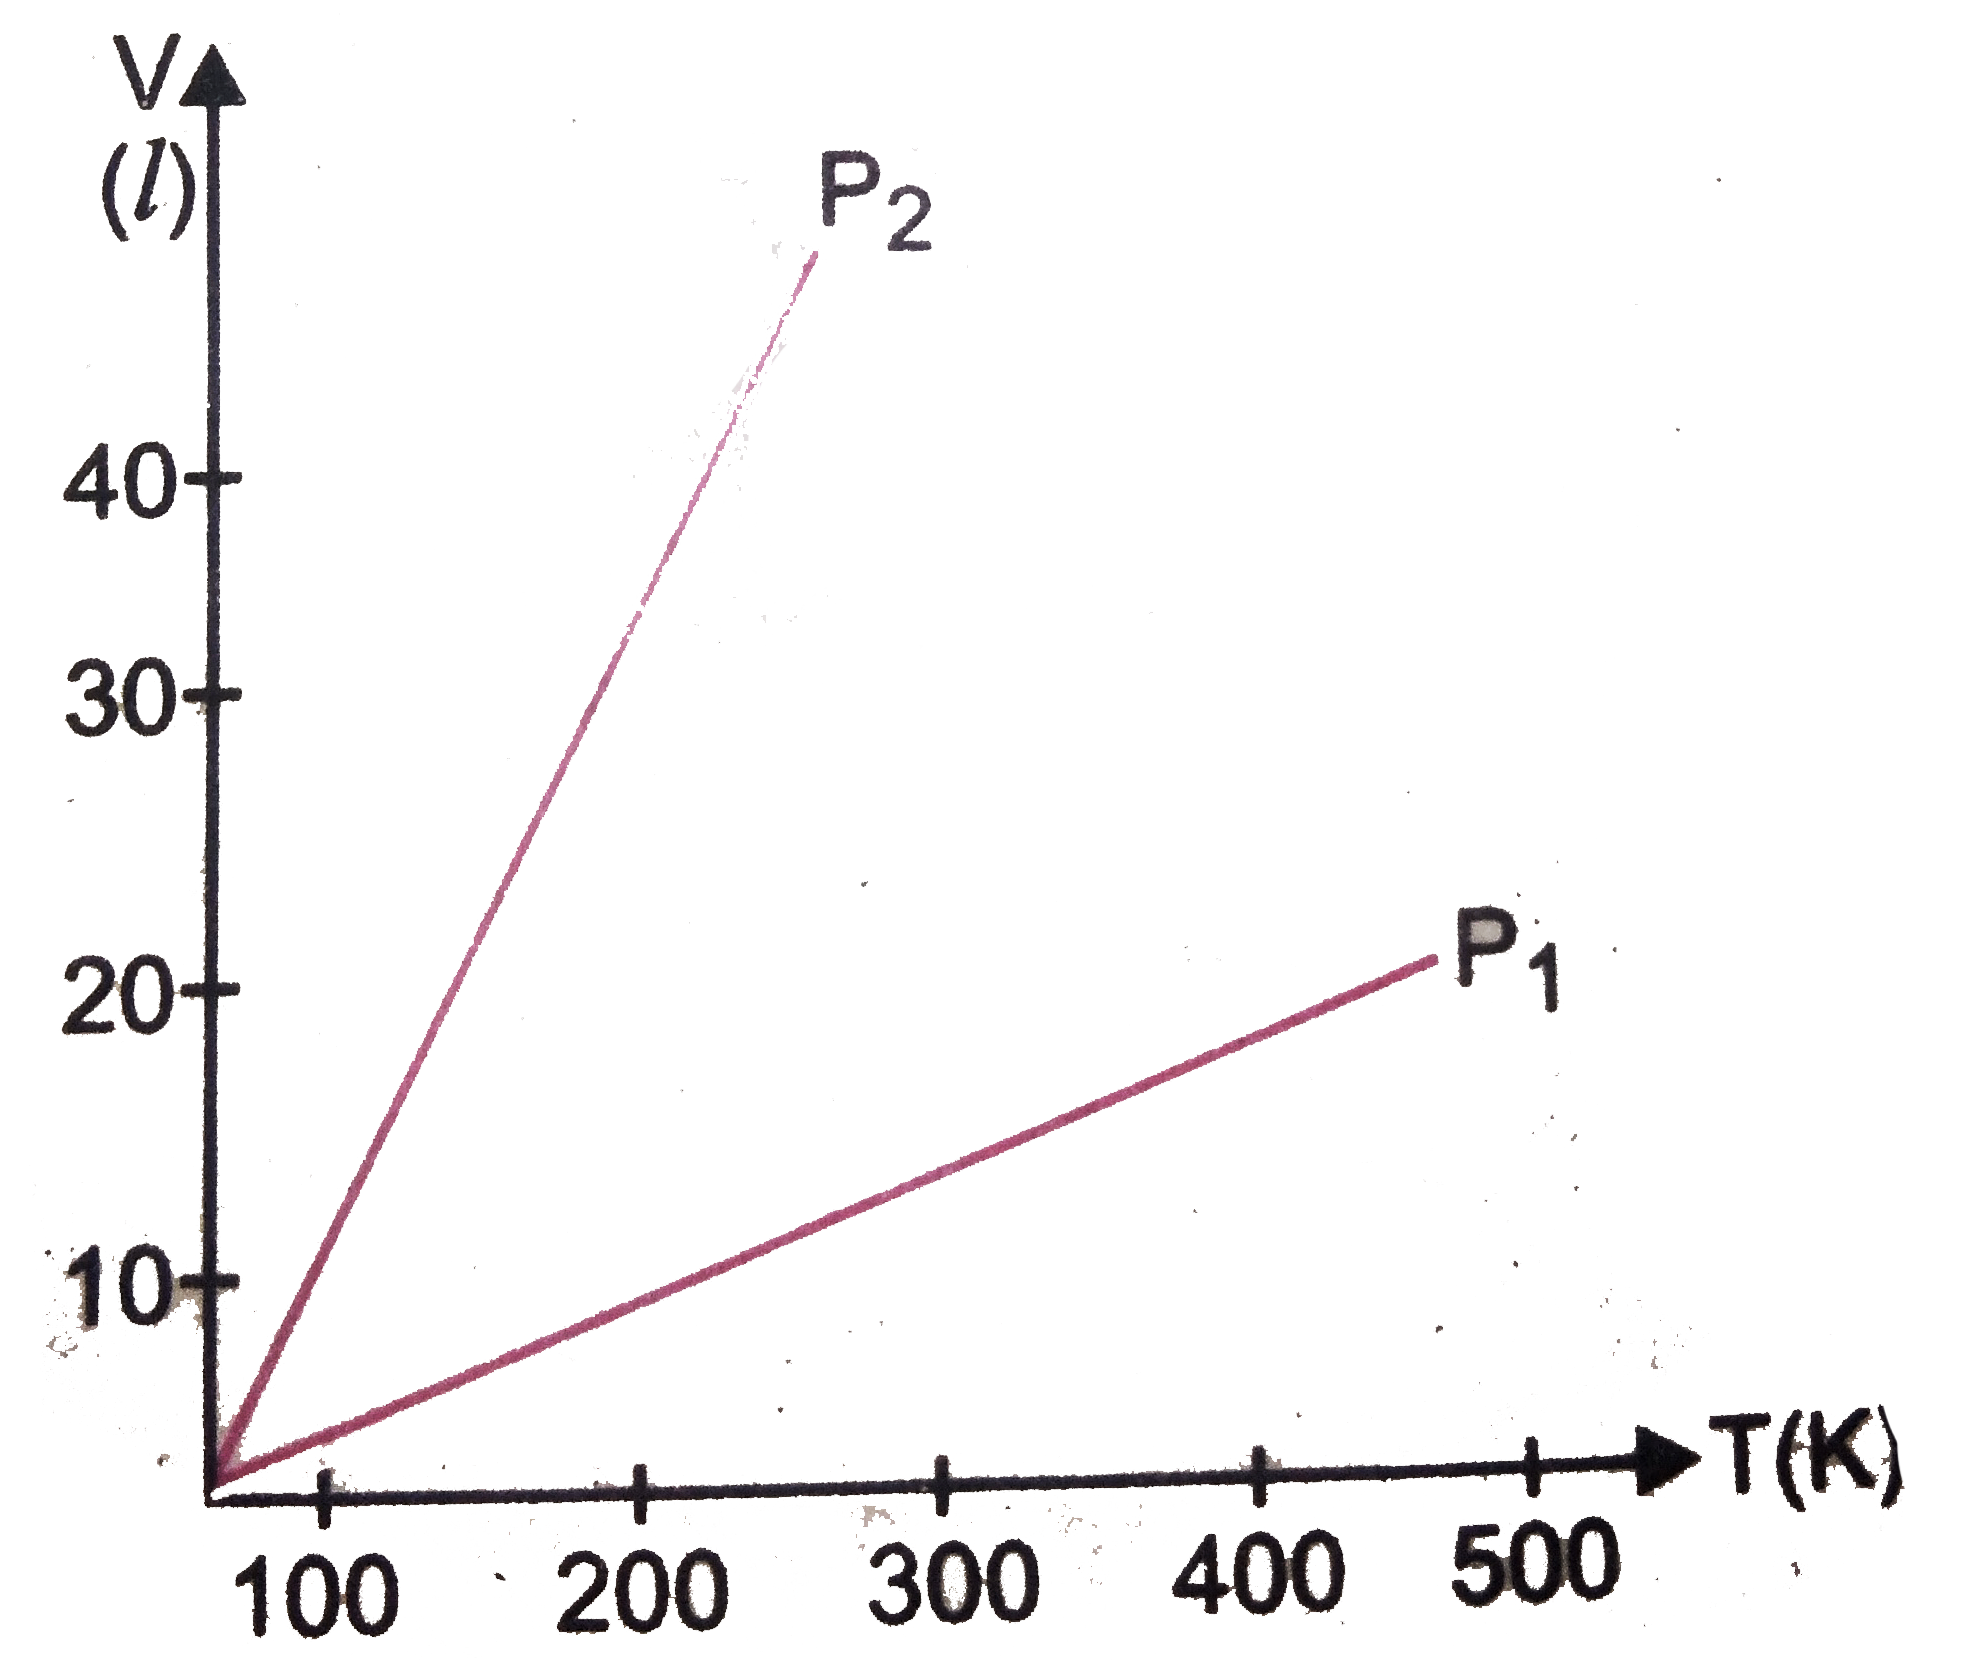
AFirst increases then decreasesBFirst decreases then increasesCcontinously decreasesDcontinously increasesVolume versus temperature graphs for a given mass of an ideal gas are shown in figure. At two different values of constant pressure. What can be inferred about relation between P1 and P2 ?
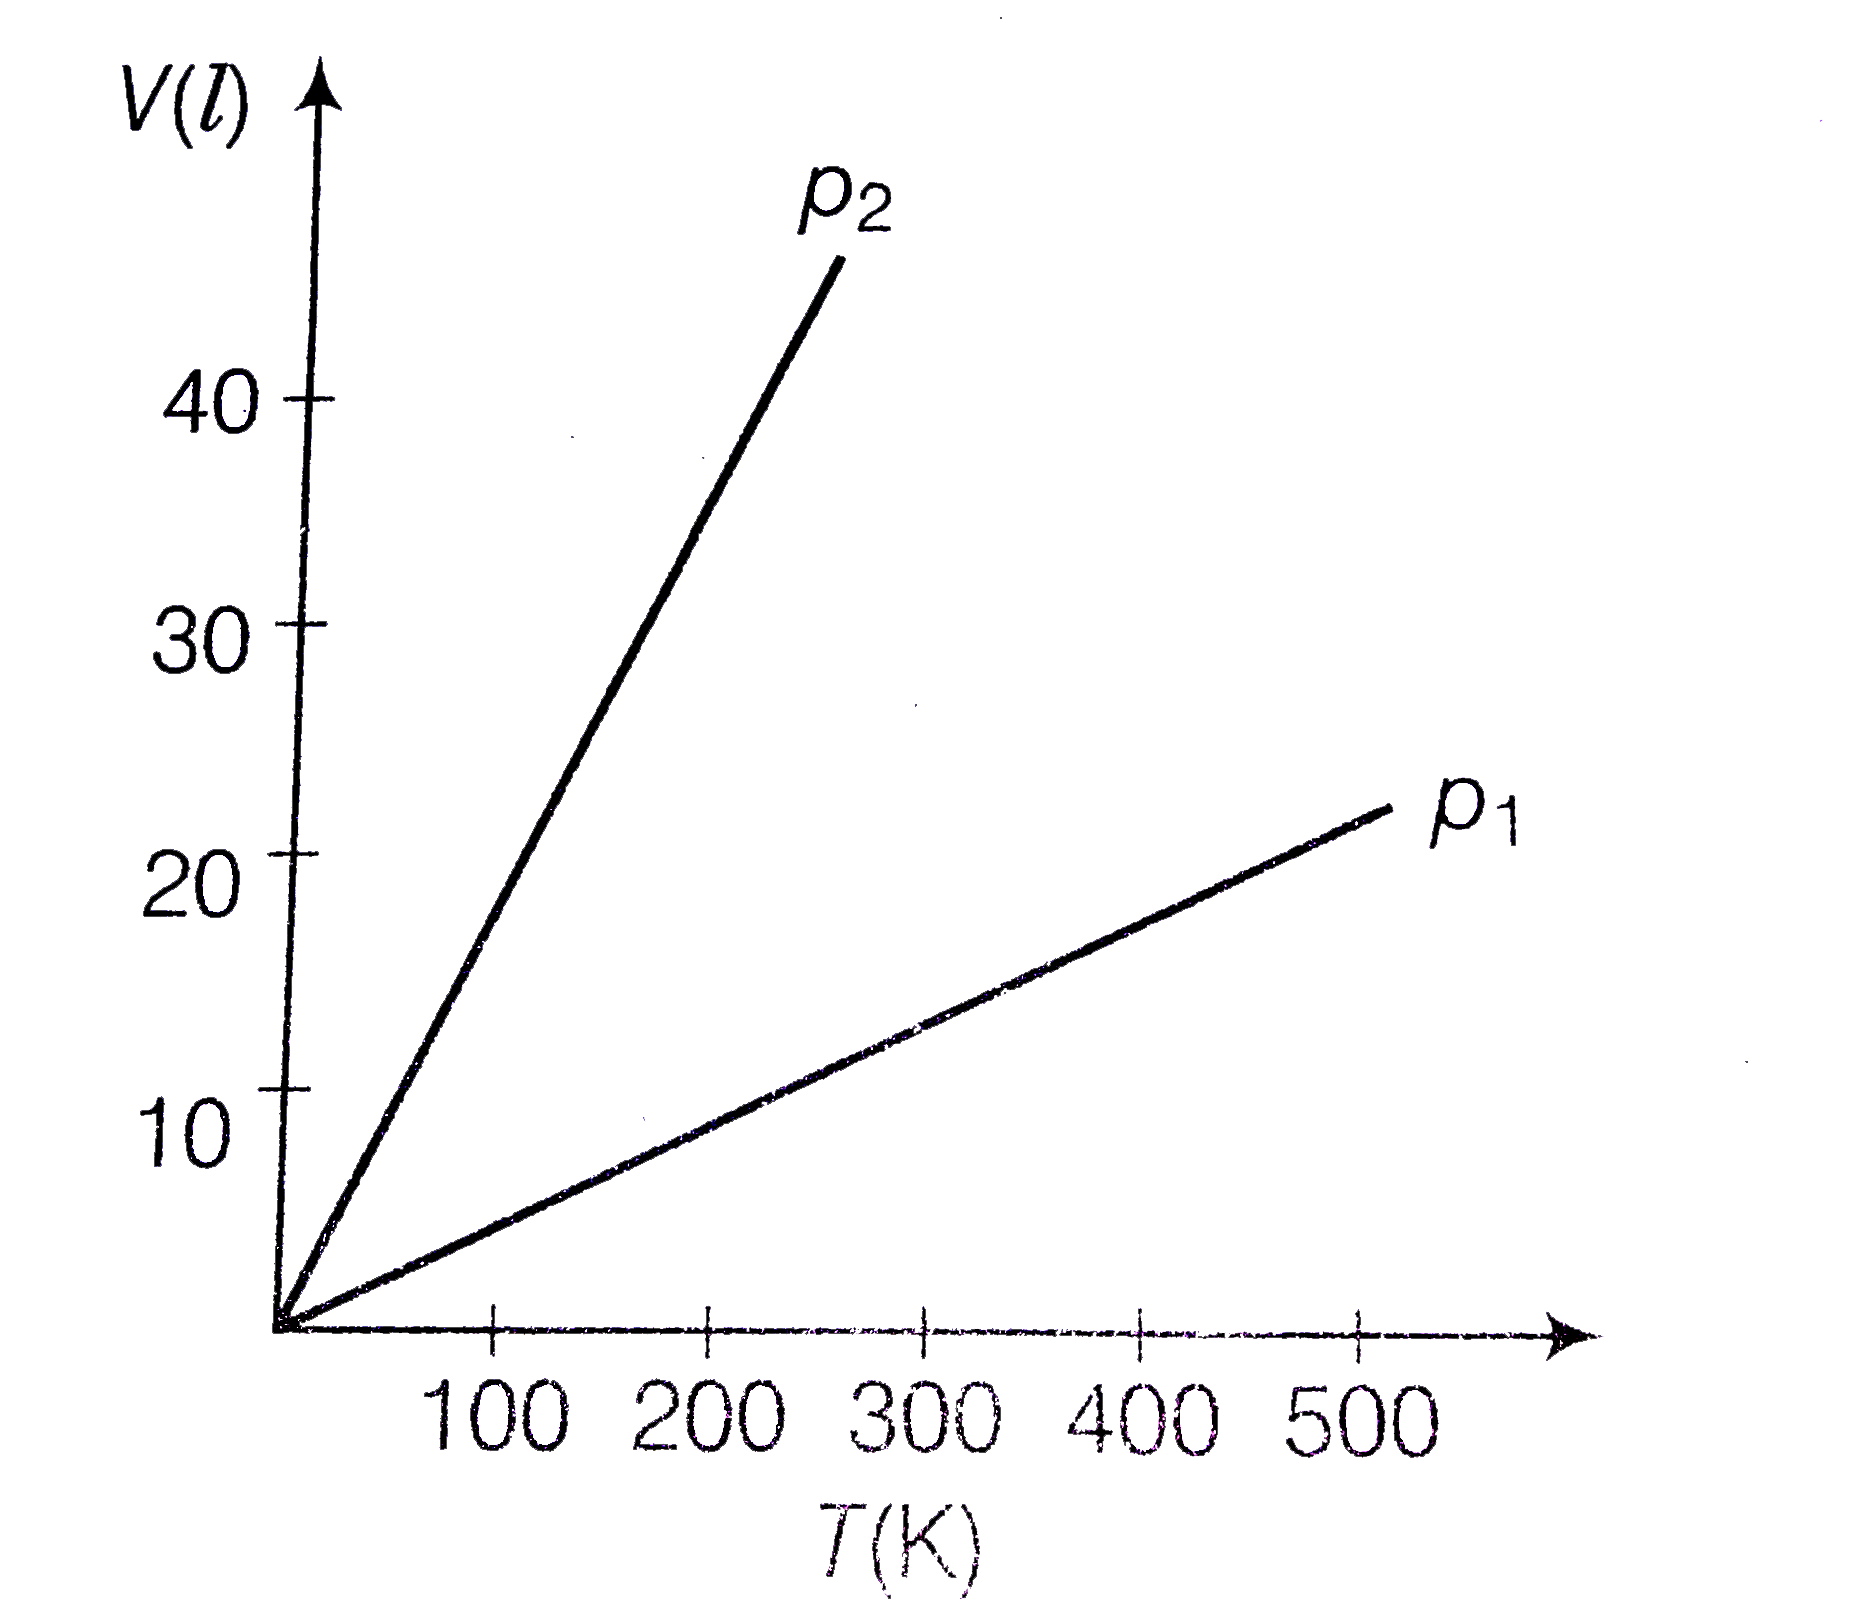 AP1>P2BP1=P2CP1<P2DData is insufficient
V-T graph of a process of monoatomic ideal gas is shown in figure.
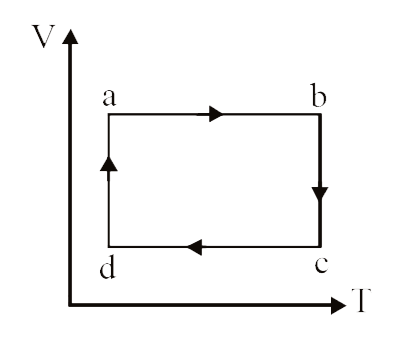
Heat is supplied to the gas in process(s)-
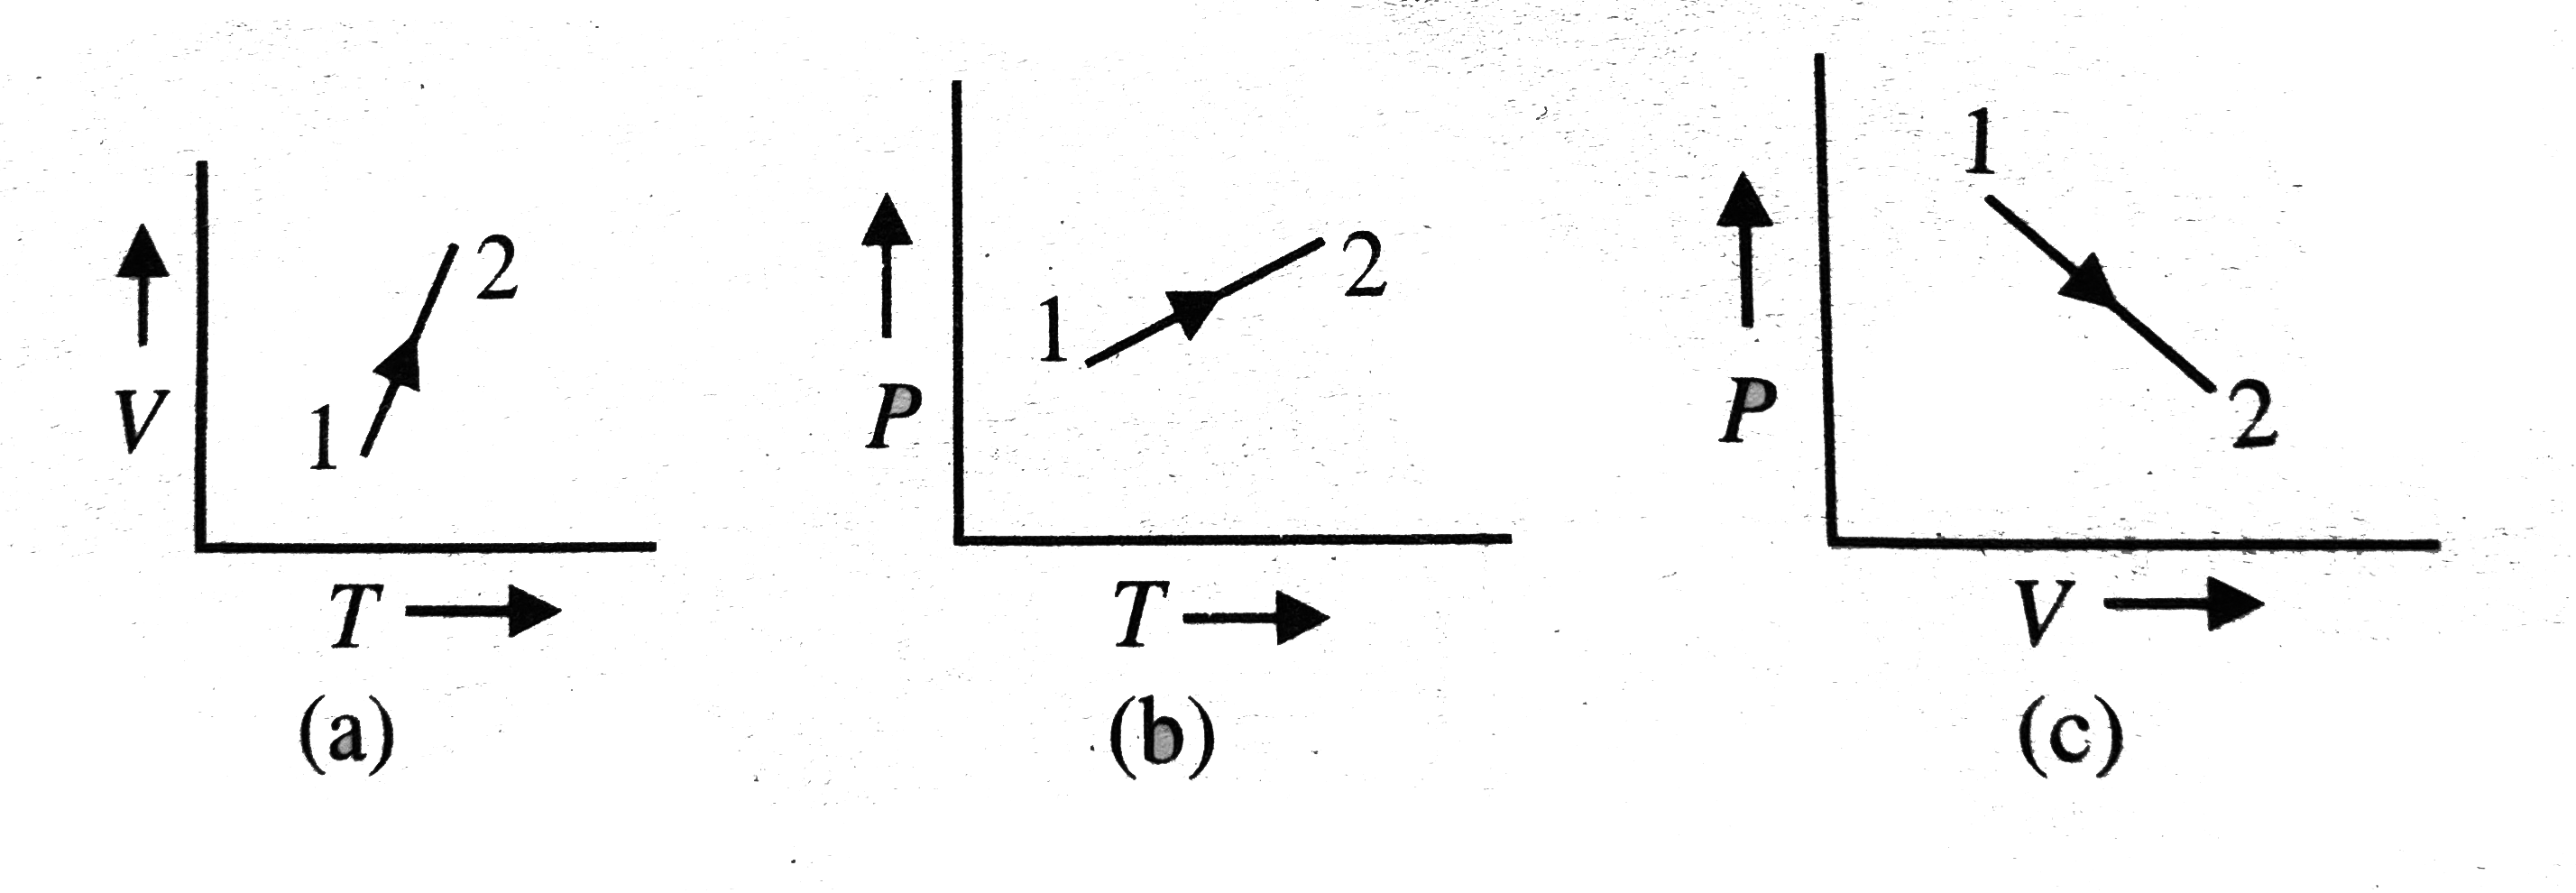
View SolutionThe three diagrams below depict three different processes for a given mass of an ideal gas. What information can be drawn regarding the change of (a) pressure, (b) volume and (c ) temperature of the gas from the plots as shown in Fig., respectively.
View SolutionThe slope of T−P graph for a given mass of a gas increases, the volumn of the gas
View SolutionThe P-V diagram for an ideal gas is shown in figure.
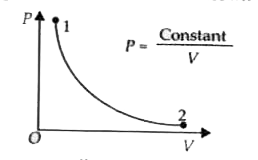
Out of the following diagrams which one represents the T-P diagram ?
View SolutionVolume versus temperature graphs for a given mass of an ideal gas are shown in Fig. at two different values of constant pressure. What can be inferred about relation between P1andP2?
View Solution


