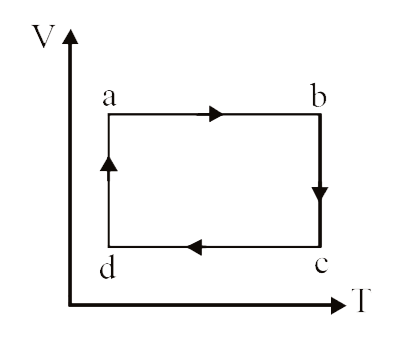
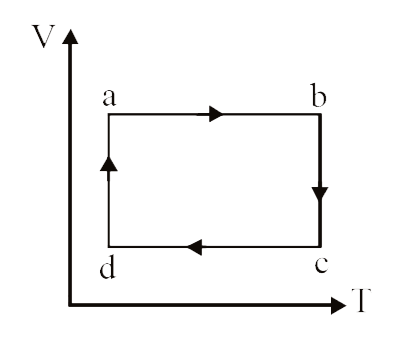
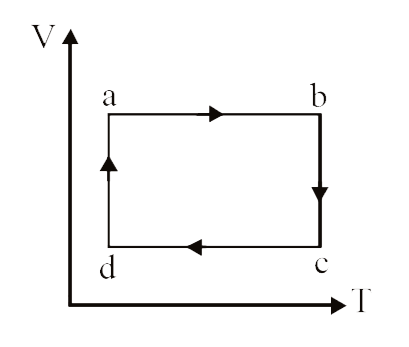
V-T graph of a process of monoatomic ideal gas is shown in figure.

Change in internal energy of the gas is zero in process(s)-
da,ab and bc
da and bc only
da only
da and ab only
Step by step video & image solution for V-T graph of a process of monoatomic ideal gas is shown in figure. Change in internal energy of the gas is zero in process(s)- by Physics experts to help you in doubts & scoring excellent marks in Class 12 exams.
Updated on:21/07/2023Topper's Solved these Questions
Similar Questions
Knowledge Check
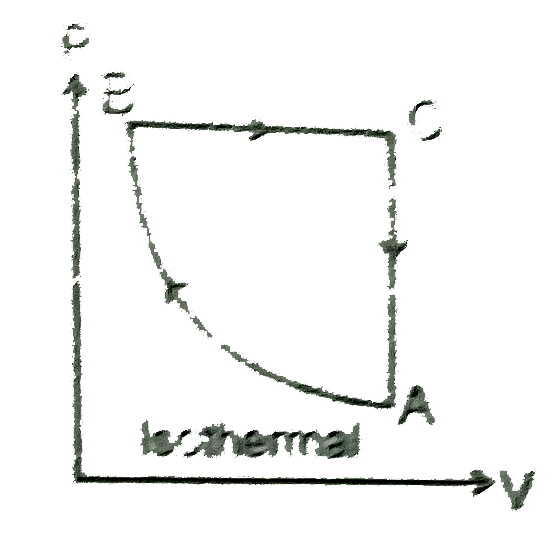
The process on an ideal gas, shown in figure,is <br><imga≤ocr_imageload∈g=lazysrc=https://d10lpgp6xz60nq.cloudfront.net/physics_imagesHCV_VOL2_C24_E01_027_Q01.pngwh=80%mx-autosty≤=background:white;>
A(a)isothermalB(b)isobaricC(c)isochoricD(d)none of these.In a cyclic process, the internal energy of the gas
AincreasesBdecreasesCremains constant,Dbecome zero.In a cyclic process, the internal energy of the gas
AIncreasesBDecreasesCRemains constantDBecomes zero
Method 1 of ΔU
Temperature of two moles of a monoatomic gas is increased by 600 K in a given process. Find change in internal energy of the gas.
View SolutionV−T diagram for a process of given mass of ideal gas is as shown in fig. During the process pressure of the gas
_E01_072_Q01.png)
View SolutionChange in internal energy in an isothermal process for ideal gas is
View Solutiongraph of an ideal gas is as shown in figure.

Heat is supplied to the gas in process (s).
View SolutionA cyclic process of an ideal monoatomic gas is shown in figure. The correct statement is (are):

View Solution


