The net force acting on a particle moving along a straight line varies with time as shown in the diagram. Force is parallel to velocity. Which of the following graph is best representative of its speed with time? (Initial velocity of the particle is zero)
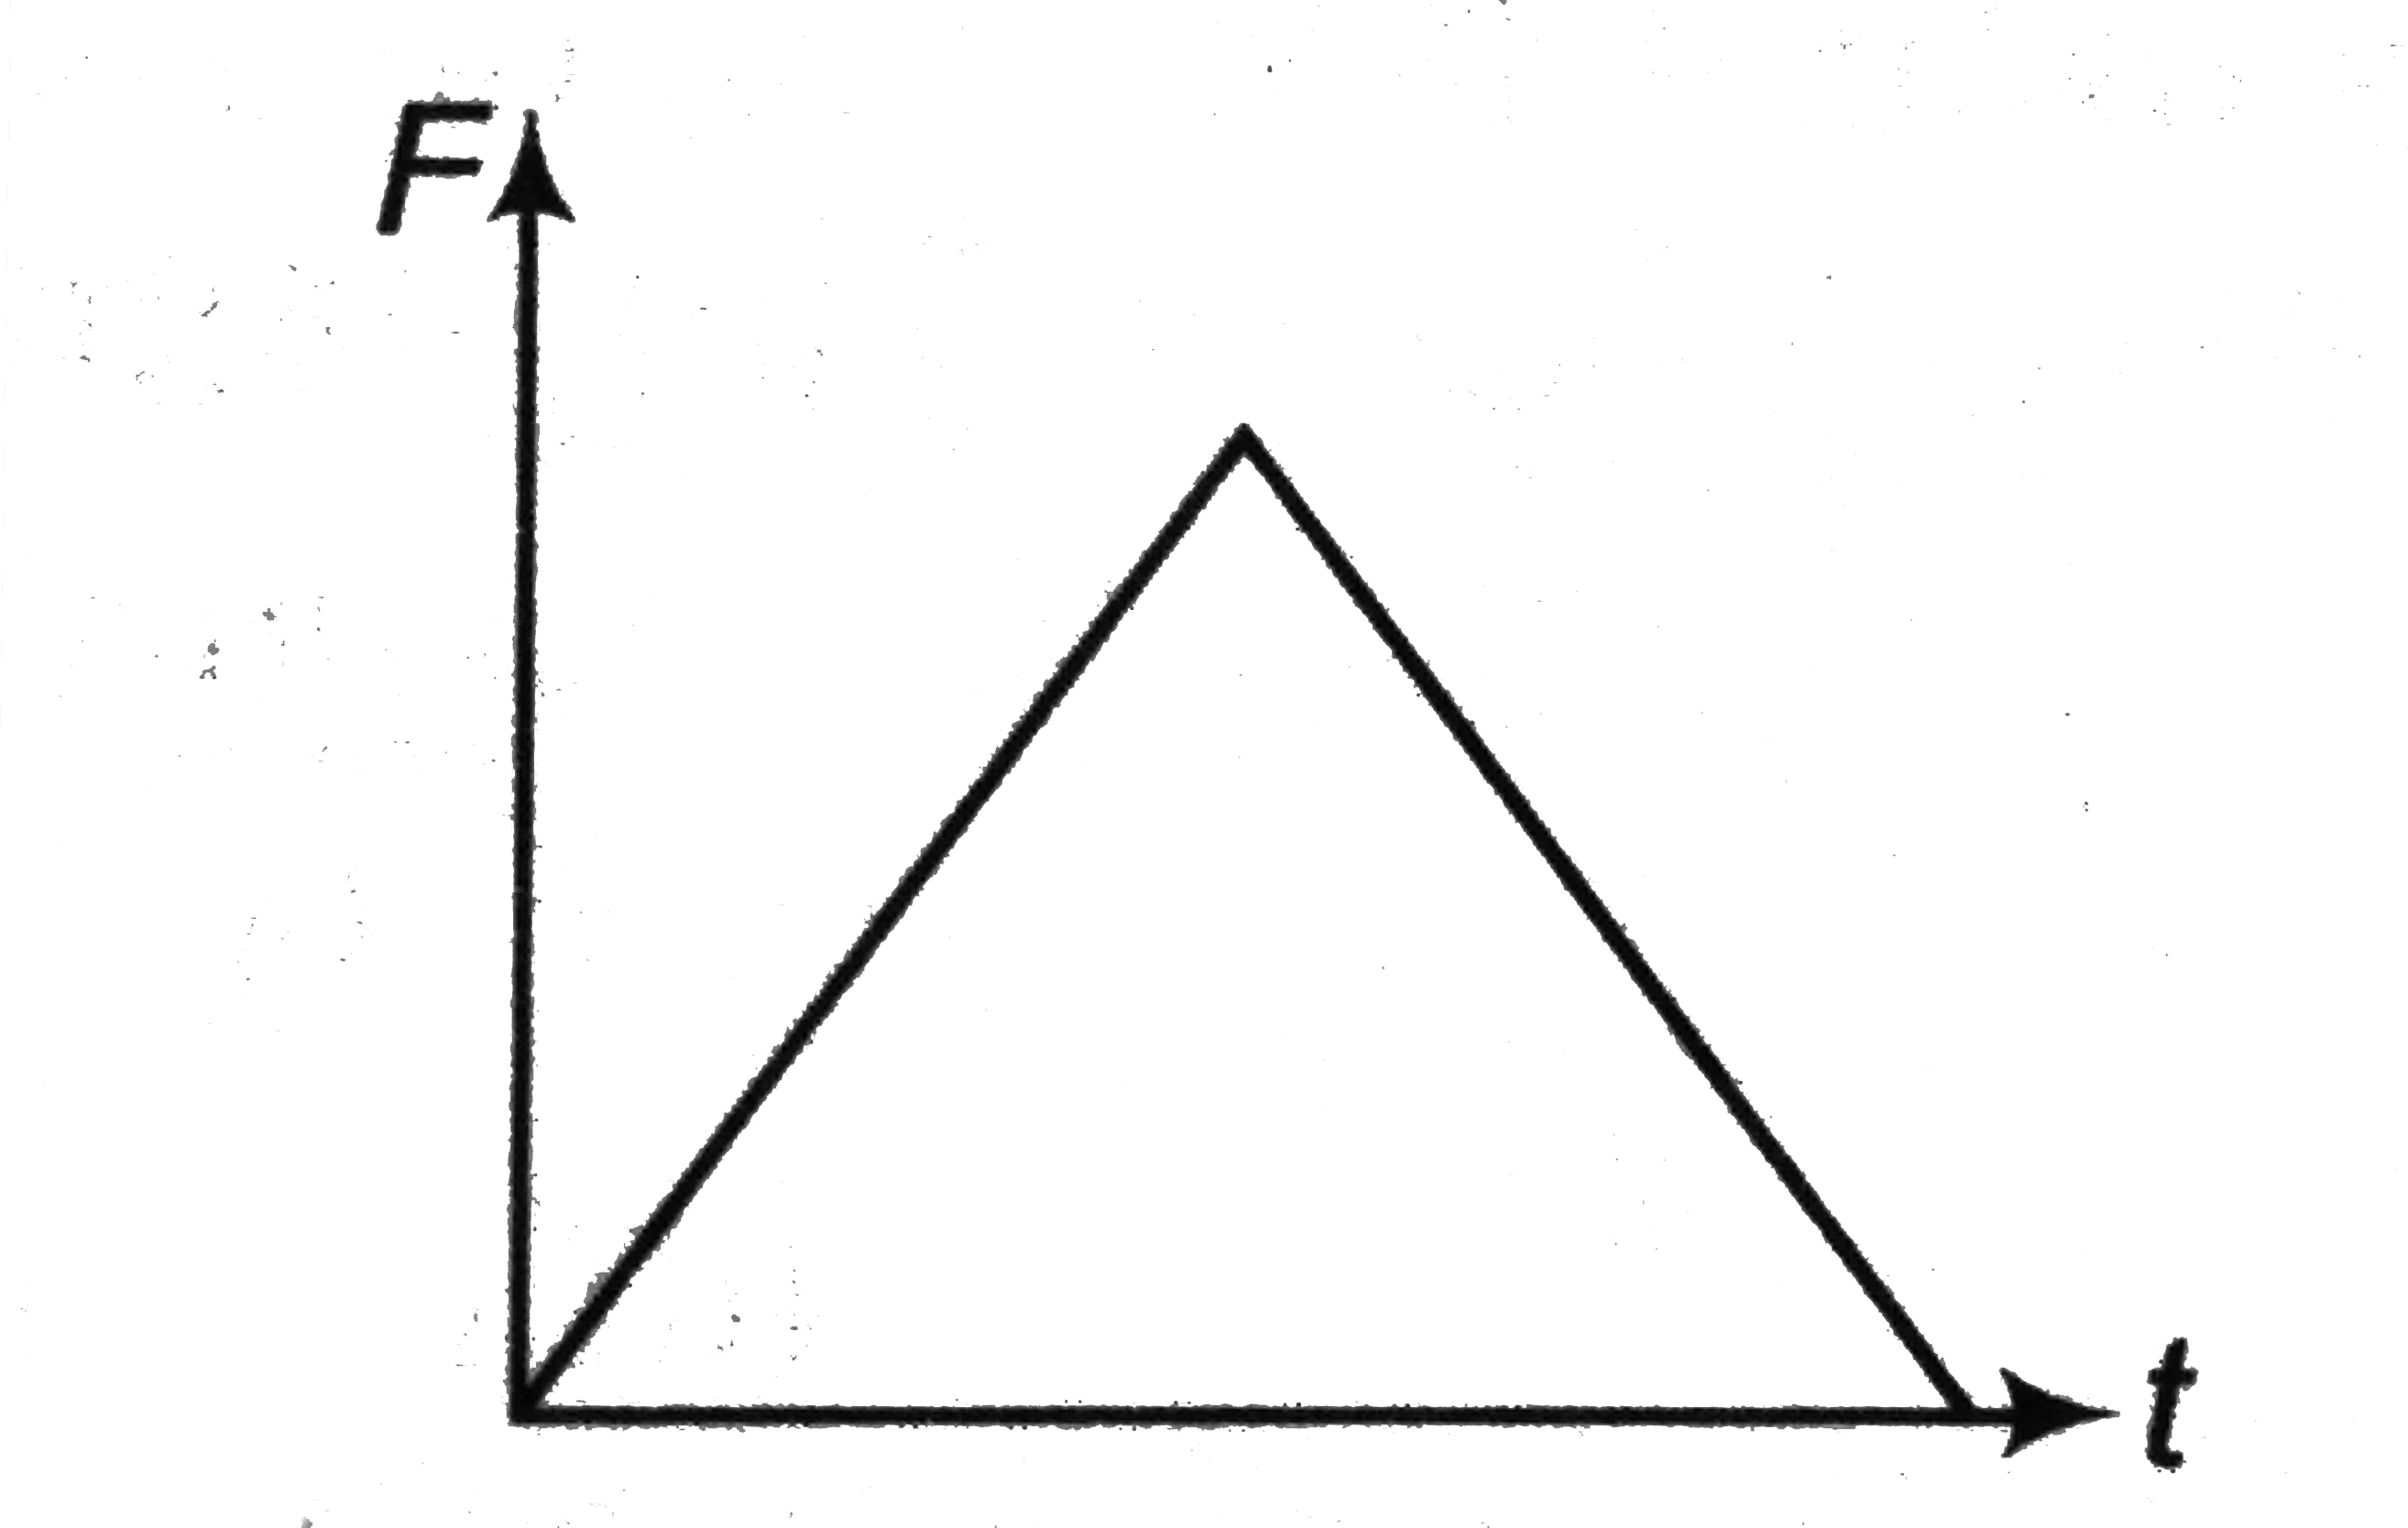
(a) 
(b) 
(c) 
(d) 
The correct Answer is:A
or

Hence, graph is similar to graph.
From O to
or ( positive constant)
Integrating we get,
or
i.e. graph is a parabola passing through origin.
From to again acceleration is positive (in the direction of velocity). So, velocity will further increase.
Topper's Solved these Questions
- CENTRE OF MASS, LINEAR MOMENTUM AND COLLISIONBook:DC PANDEYChapter:CENTRE OF MASS, LINEAR MOMENTUM AND COLLISIONExercise:Level 1 Subjective
Explore 32 Videos
- CENTRE OF MASS, LINEAR MOMENTUM AND COLLISIONBook:DC PANDEYChapter:CENTRE OF MASS, LINEAR MOMENTUM AND COLLISIONExercise:Level 1 Subjective Questions
Explore 1 Video
- CENTRE OF MASS, LINEAR MOMENTUM AND COLLISIONBook:DC PANDEYChapter:CENTRE OF MASS, LINEAR MOMENTUM AND COLLISIONExercise:Level 1 Assertion and Reason
Explore 15 Videos
- CENTRE OF MASS, IMPULSE AND MOMENTUMBook:DC PANDEYChapter:CENTRE OF MASS, IMPULSE AND MOMENTUMExercise:Comprehension type questions
Explore 15 Videos
- CIRCULAR MOTIONBook:DC PANDEYChapter:CIRCULAR MOTIONExercise:Medical entrances s gallery
Explore 19 Videos
Similar Questions
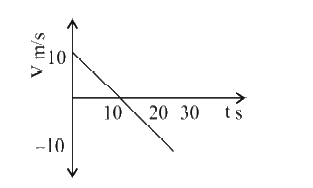
The velocity-time plot for a particle moving on a straight line is shown in the figure, then
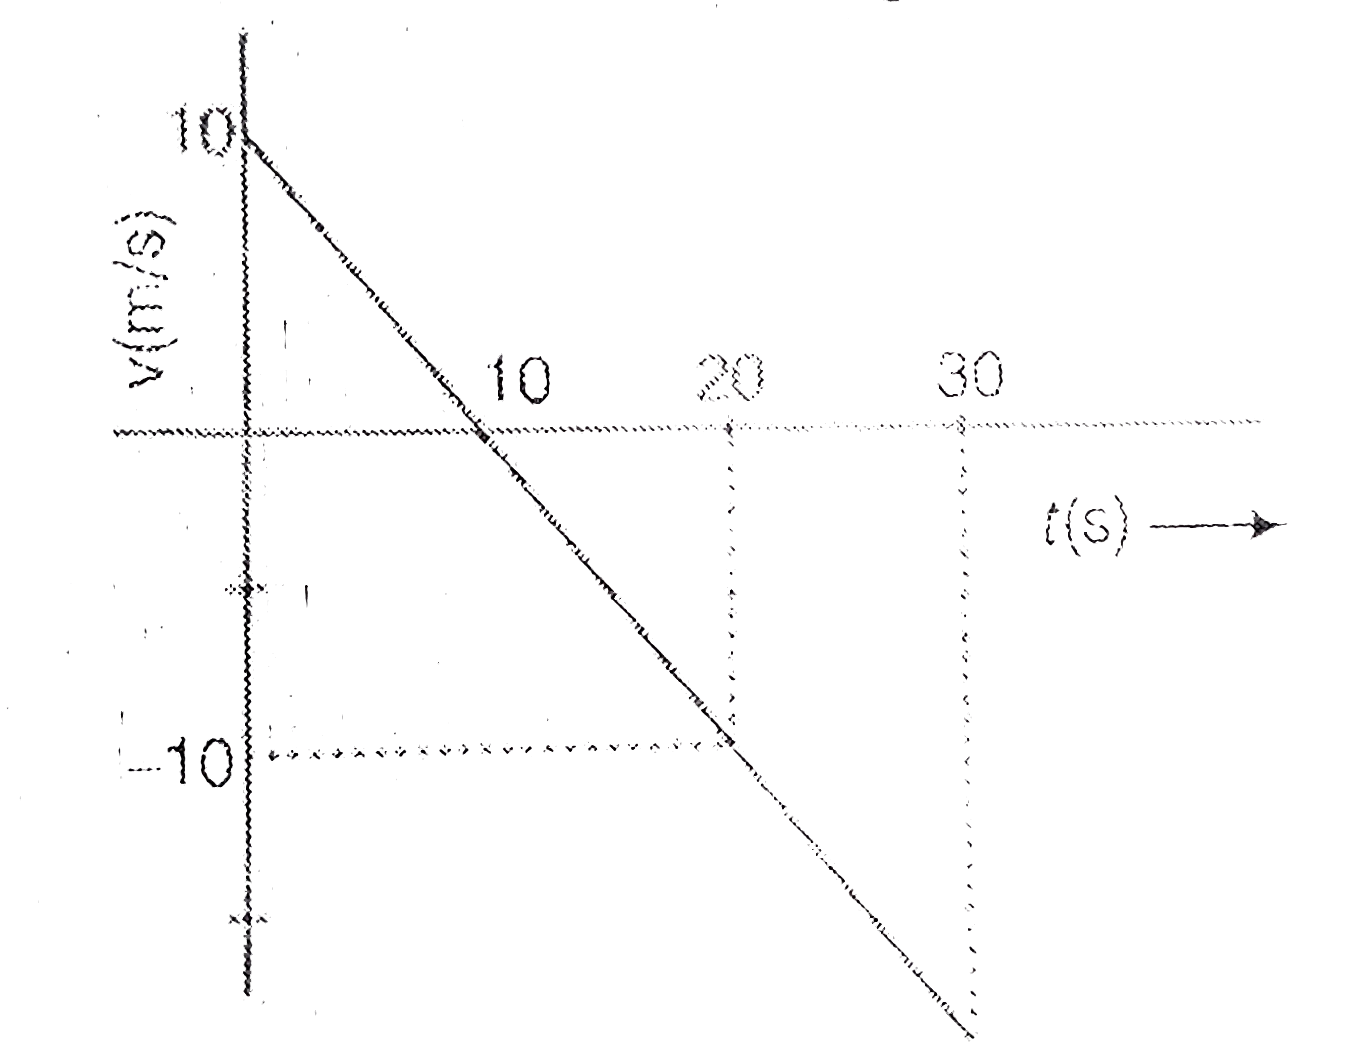
View SolutionThe velocity of a particle moving along a straight line varies with time as shown in the Figure. Find the total distance covered and the total displacement between 0 and 20 seconds.
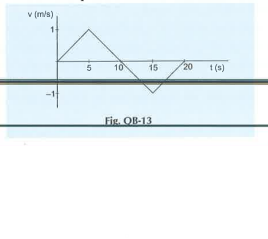
View Solution
Knowledge Check
The force acting on a particle moving along a straight line varies with time as shown in diagram.
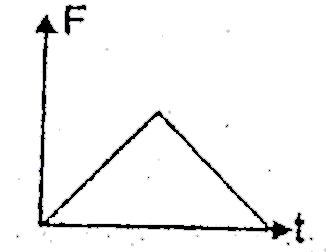
Which of the following graphs is best representative of its speed and time graphs. Initial velocity the particle is zero.A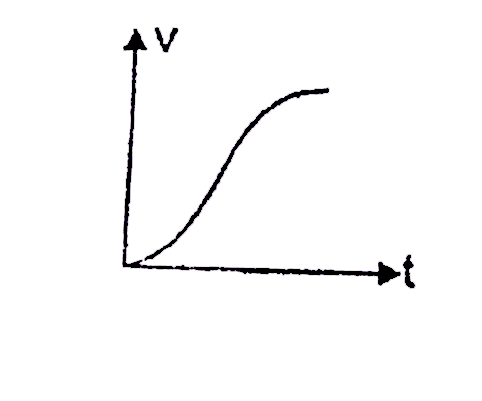 B
B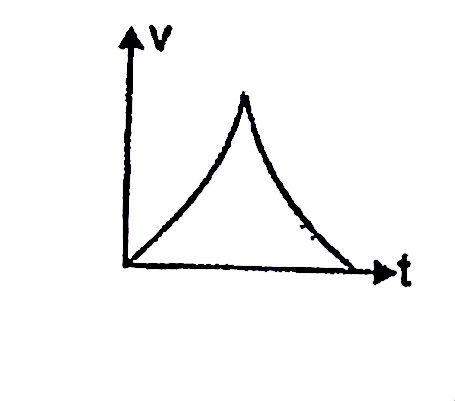 C
C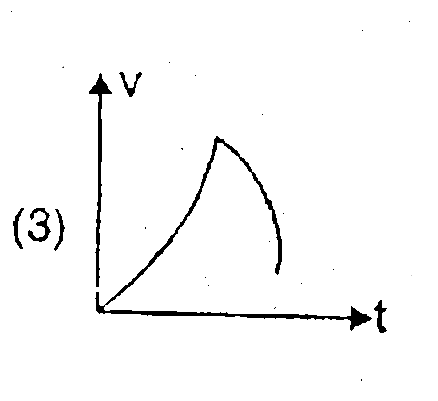 D
D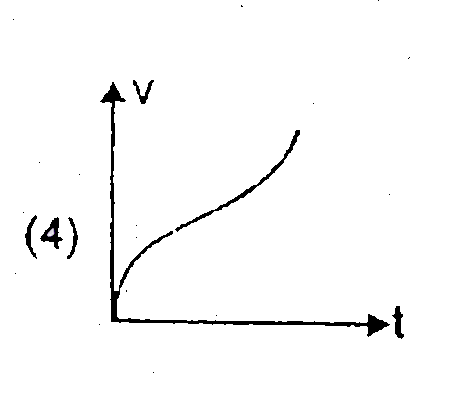
The kinetic energy of a body moving along a straight line varies with time as shown in figure. The force acting on the body:
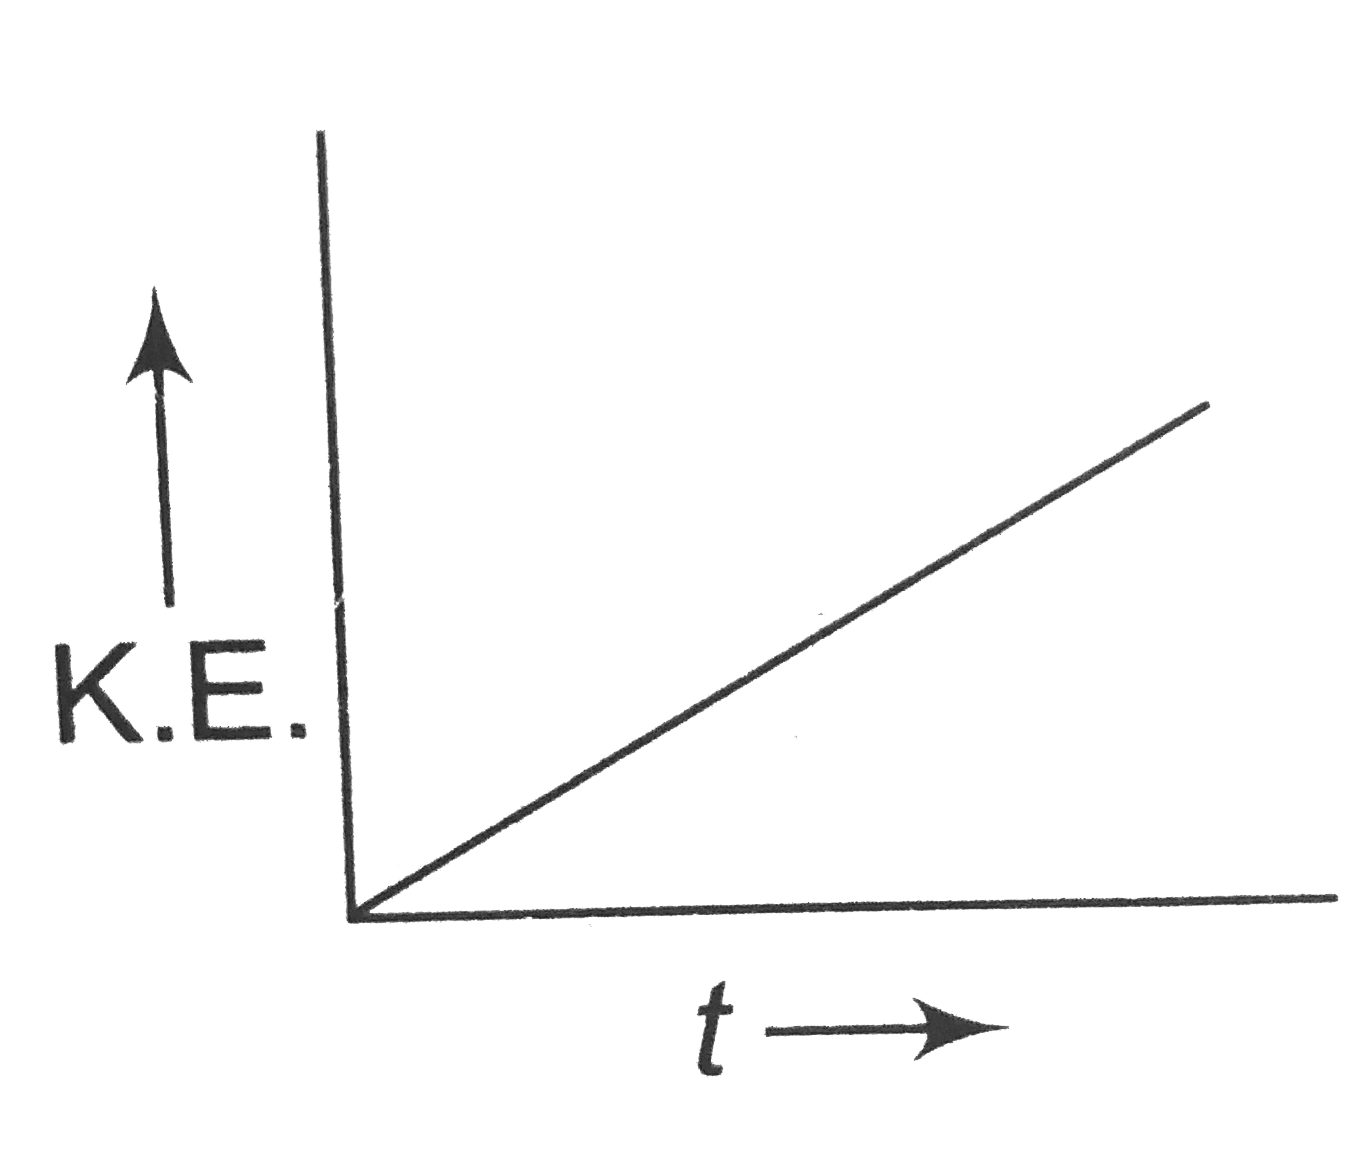 AzeroBconstantCdirectly proportional to velocityDinversely proportional to velocity
The velocity-time plot for a particle moving on a straight line is shown in figure.
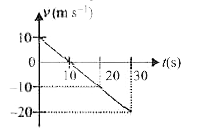 AThe particle has a constant acceleration.BThe particle has never tumed around.CThe particle has zero displacement.DThe average speed in the interval 0 to 10 s is the same as the average speed in the interval 10s to 20 s.
The velocity- time plot for a particle moving on a straight line is shown in the figure
View SolutionKinetic energy of a particle moving in a straight line varies with time t as K=4t2. The force acting on the particle
View SolutionThe velocity time plot for a particle moving on straight line is shown in the figure.

View SolutionIf average velocity of particle moving on a straight line is zero in a time interval, then
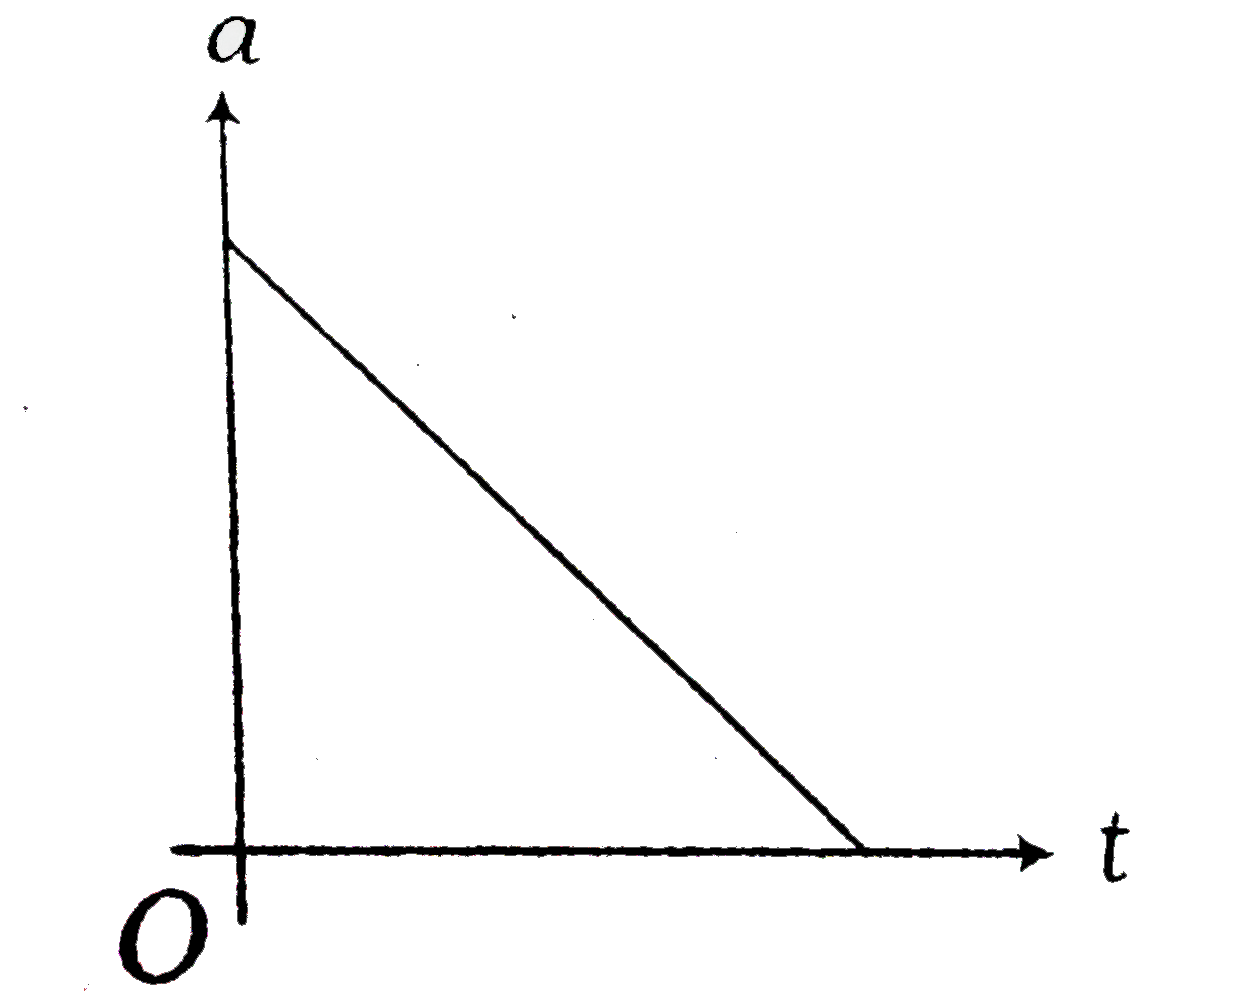
View SolutionThe acceleration (a)-time(t) graph for a particle moving along a straight from rest is shown in figur. Which of the following graph is the best representation of its velocity (v) with time (t) ?
View Solution

