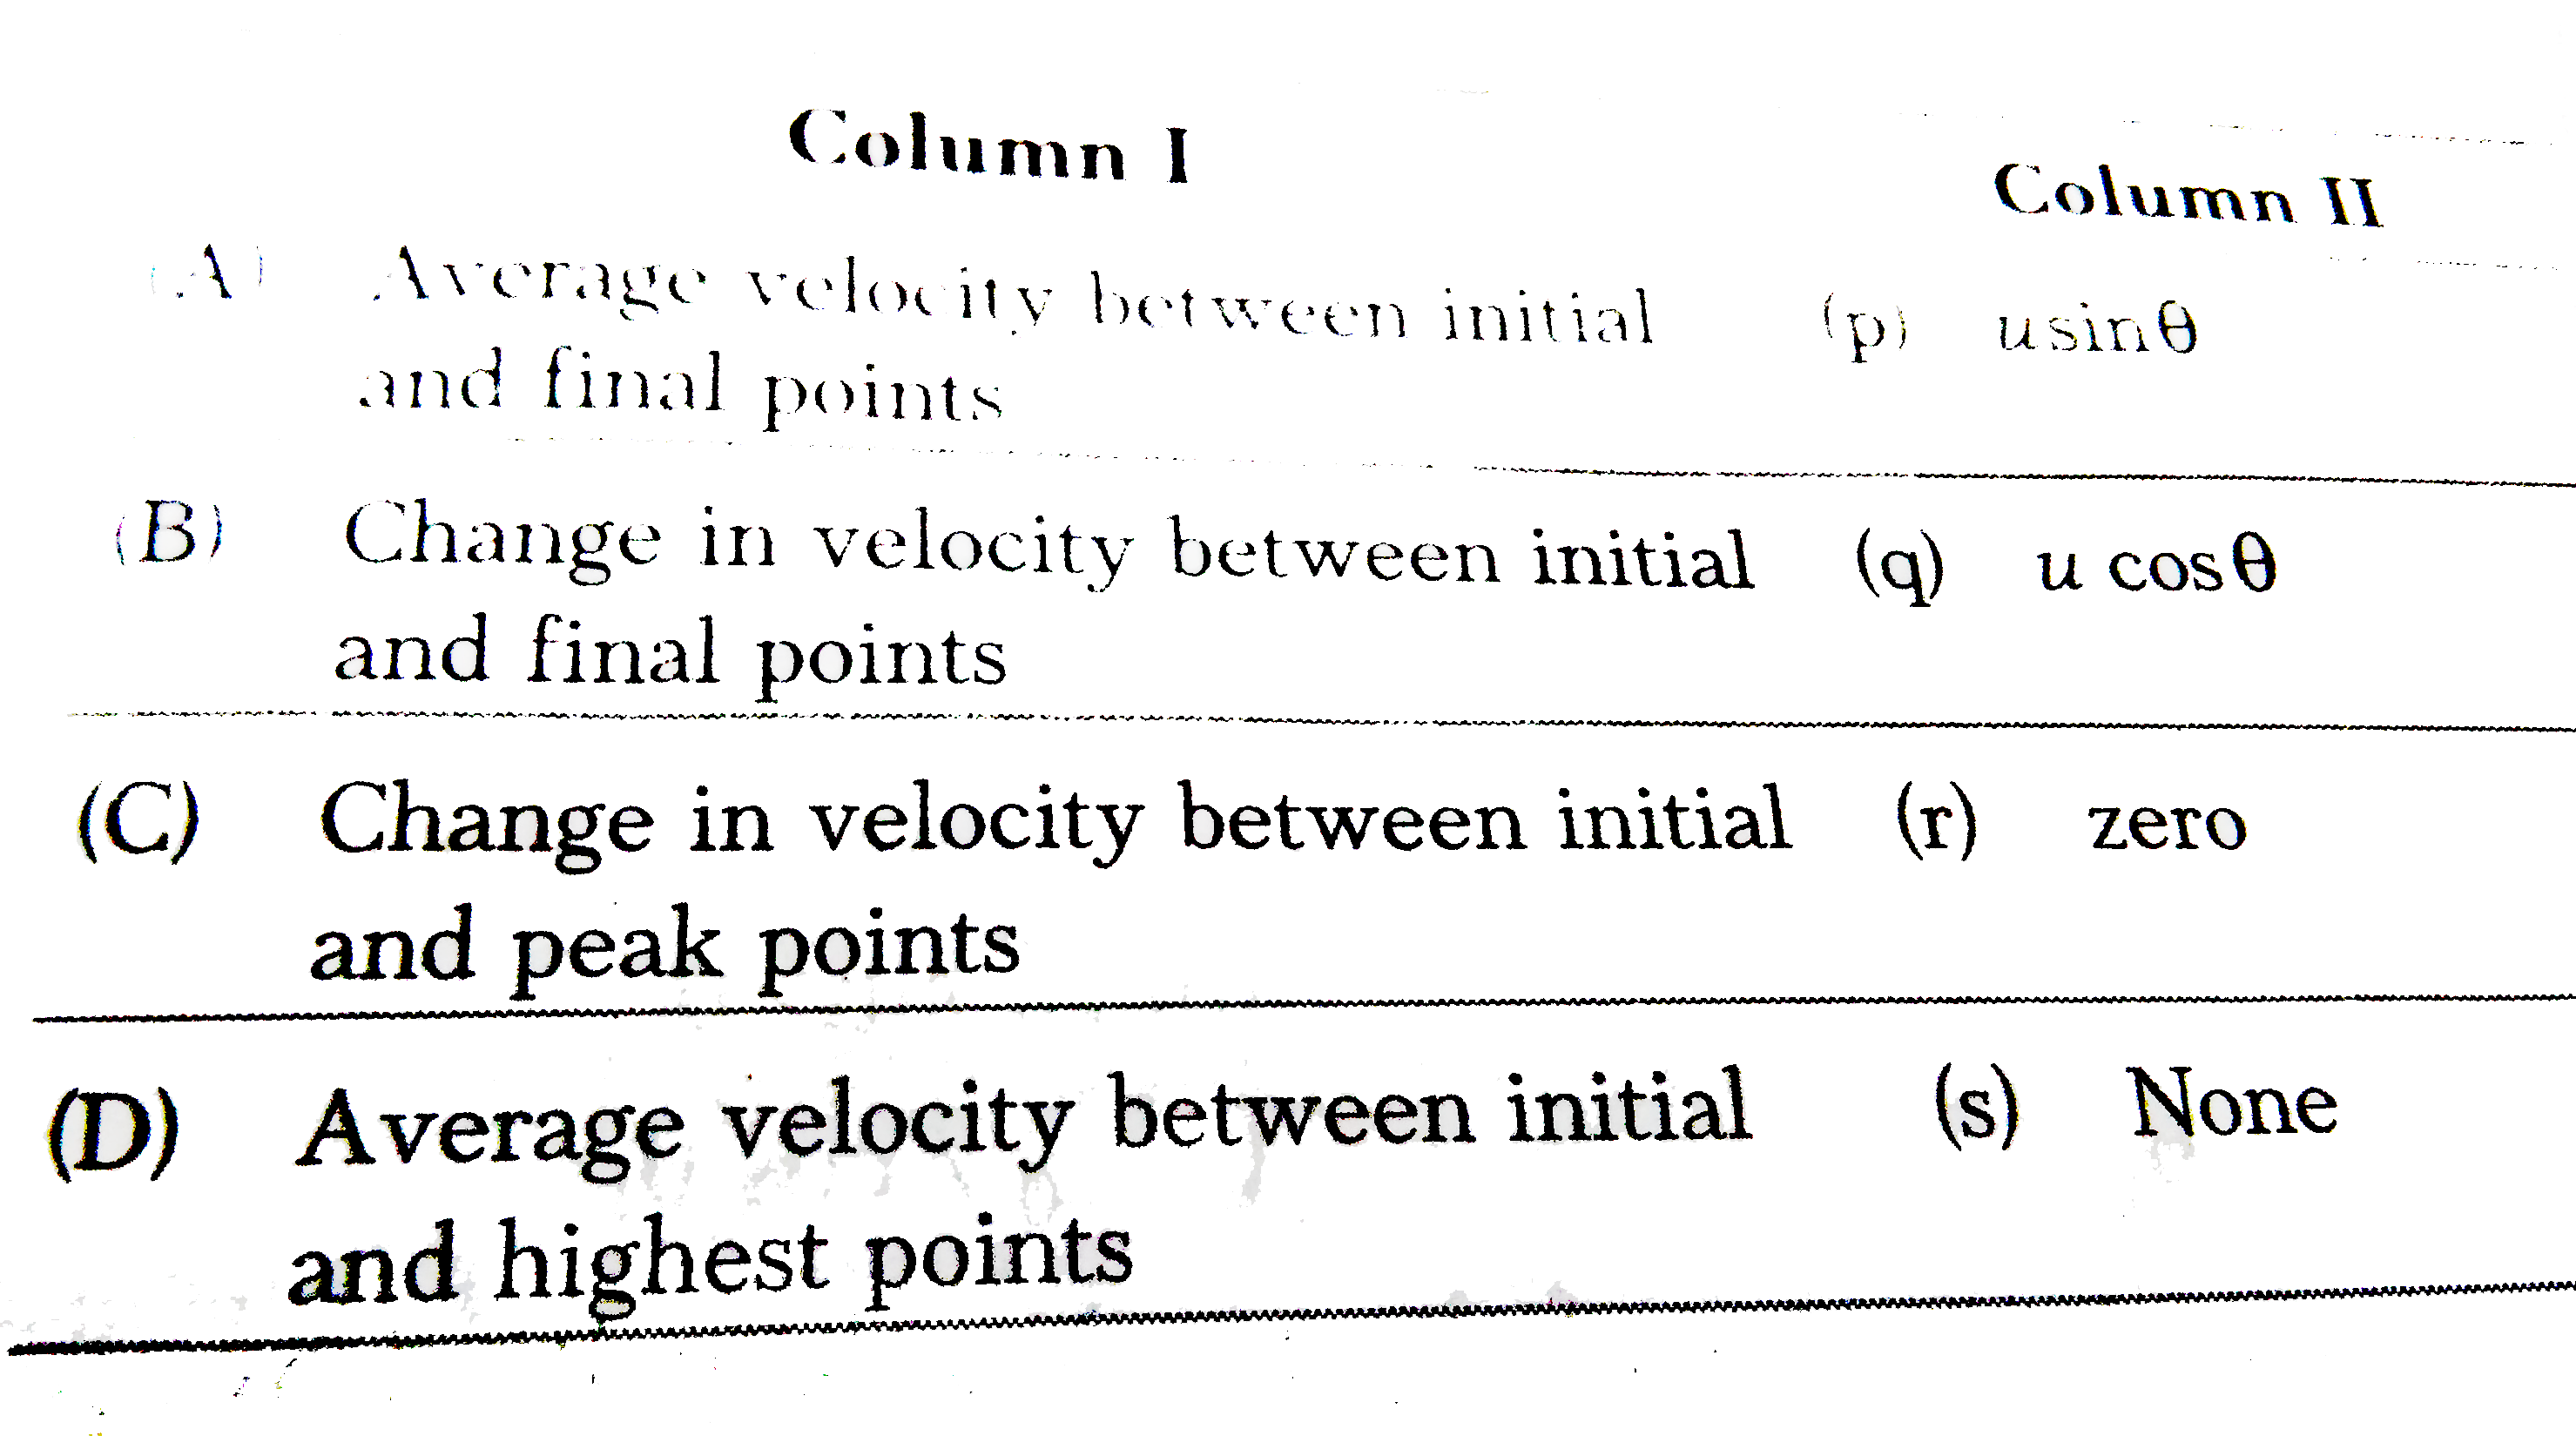
A particle is projected at t=0 from a point on the ground with certain velocity at an angle with the horizontal. The power of gravitation force is plotted against time. Which of the following is the best representation?
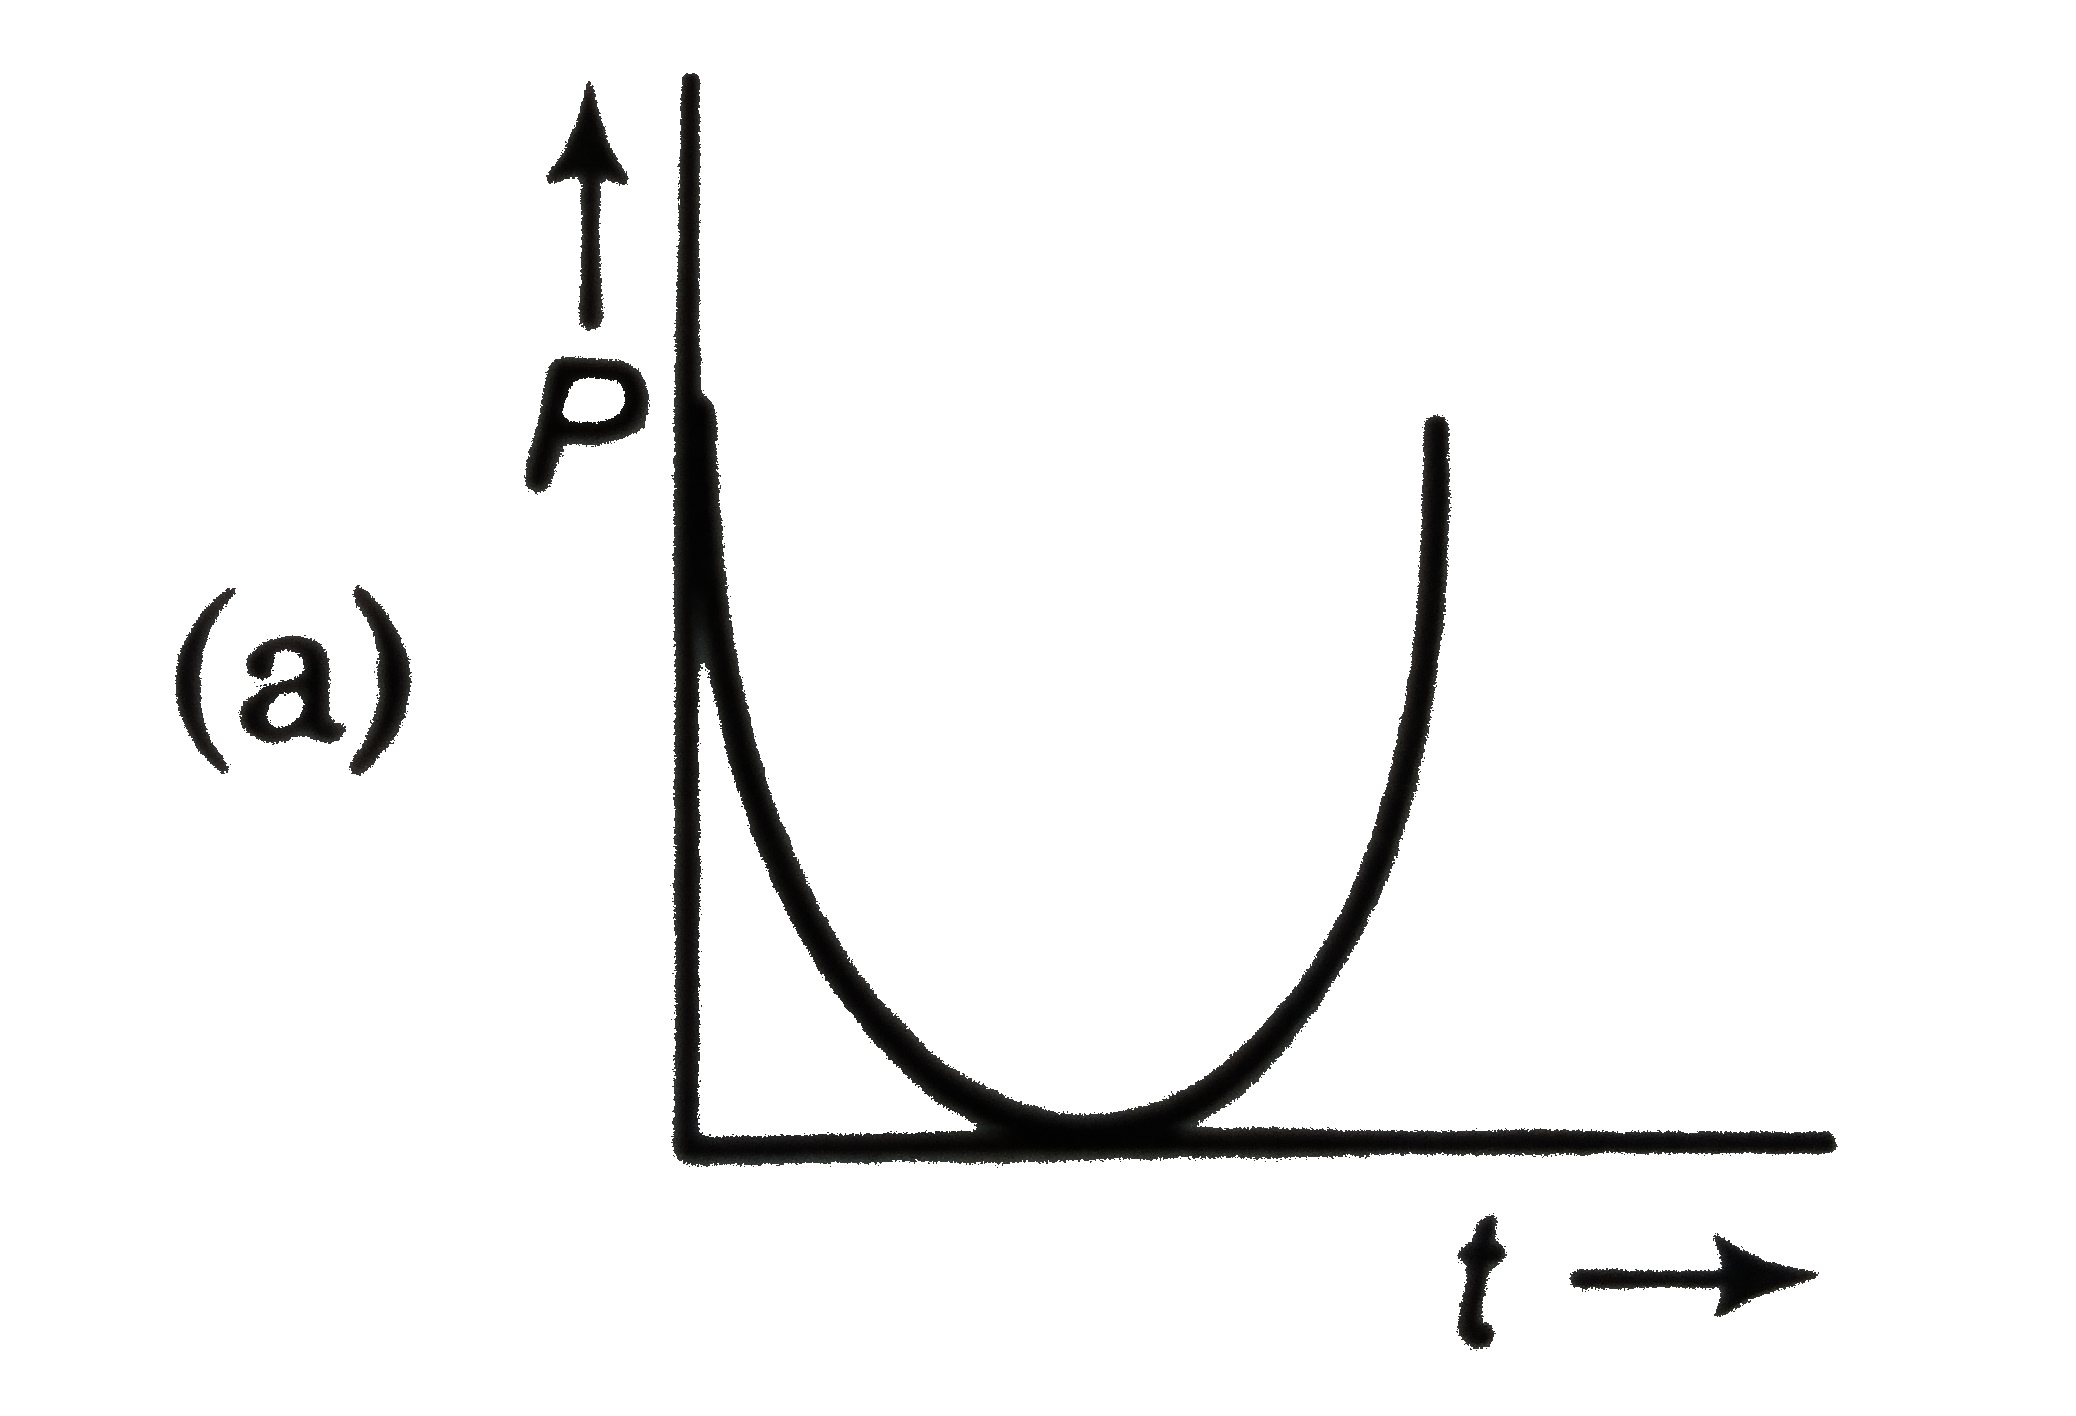
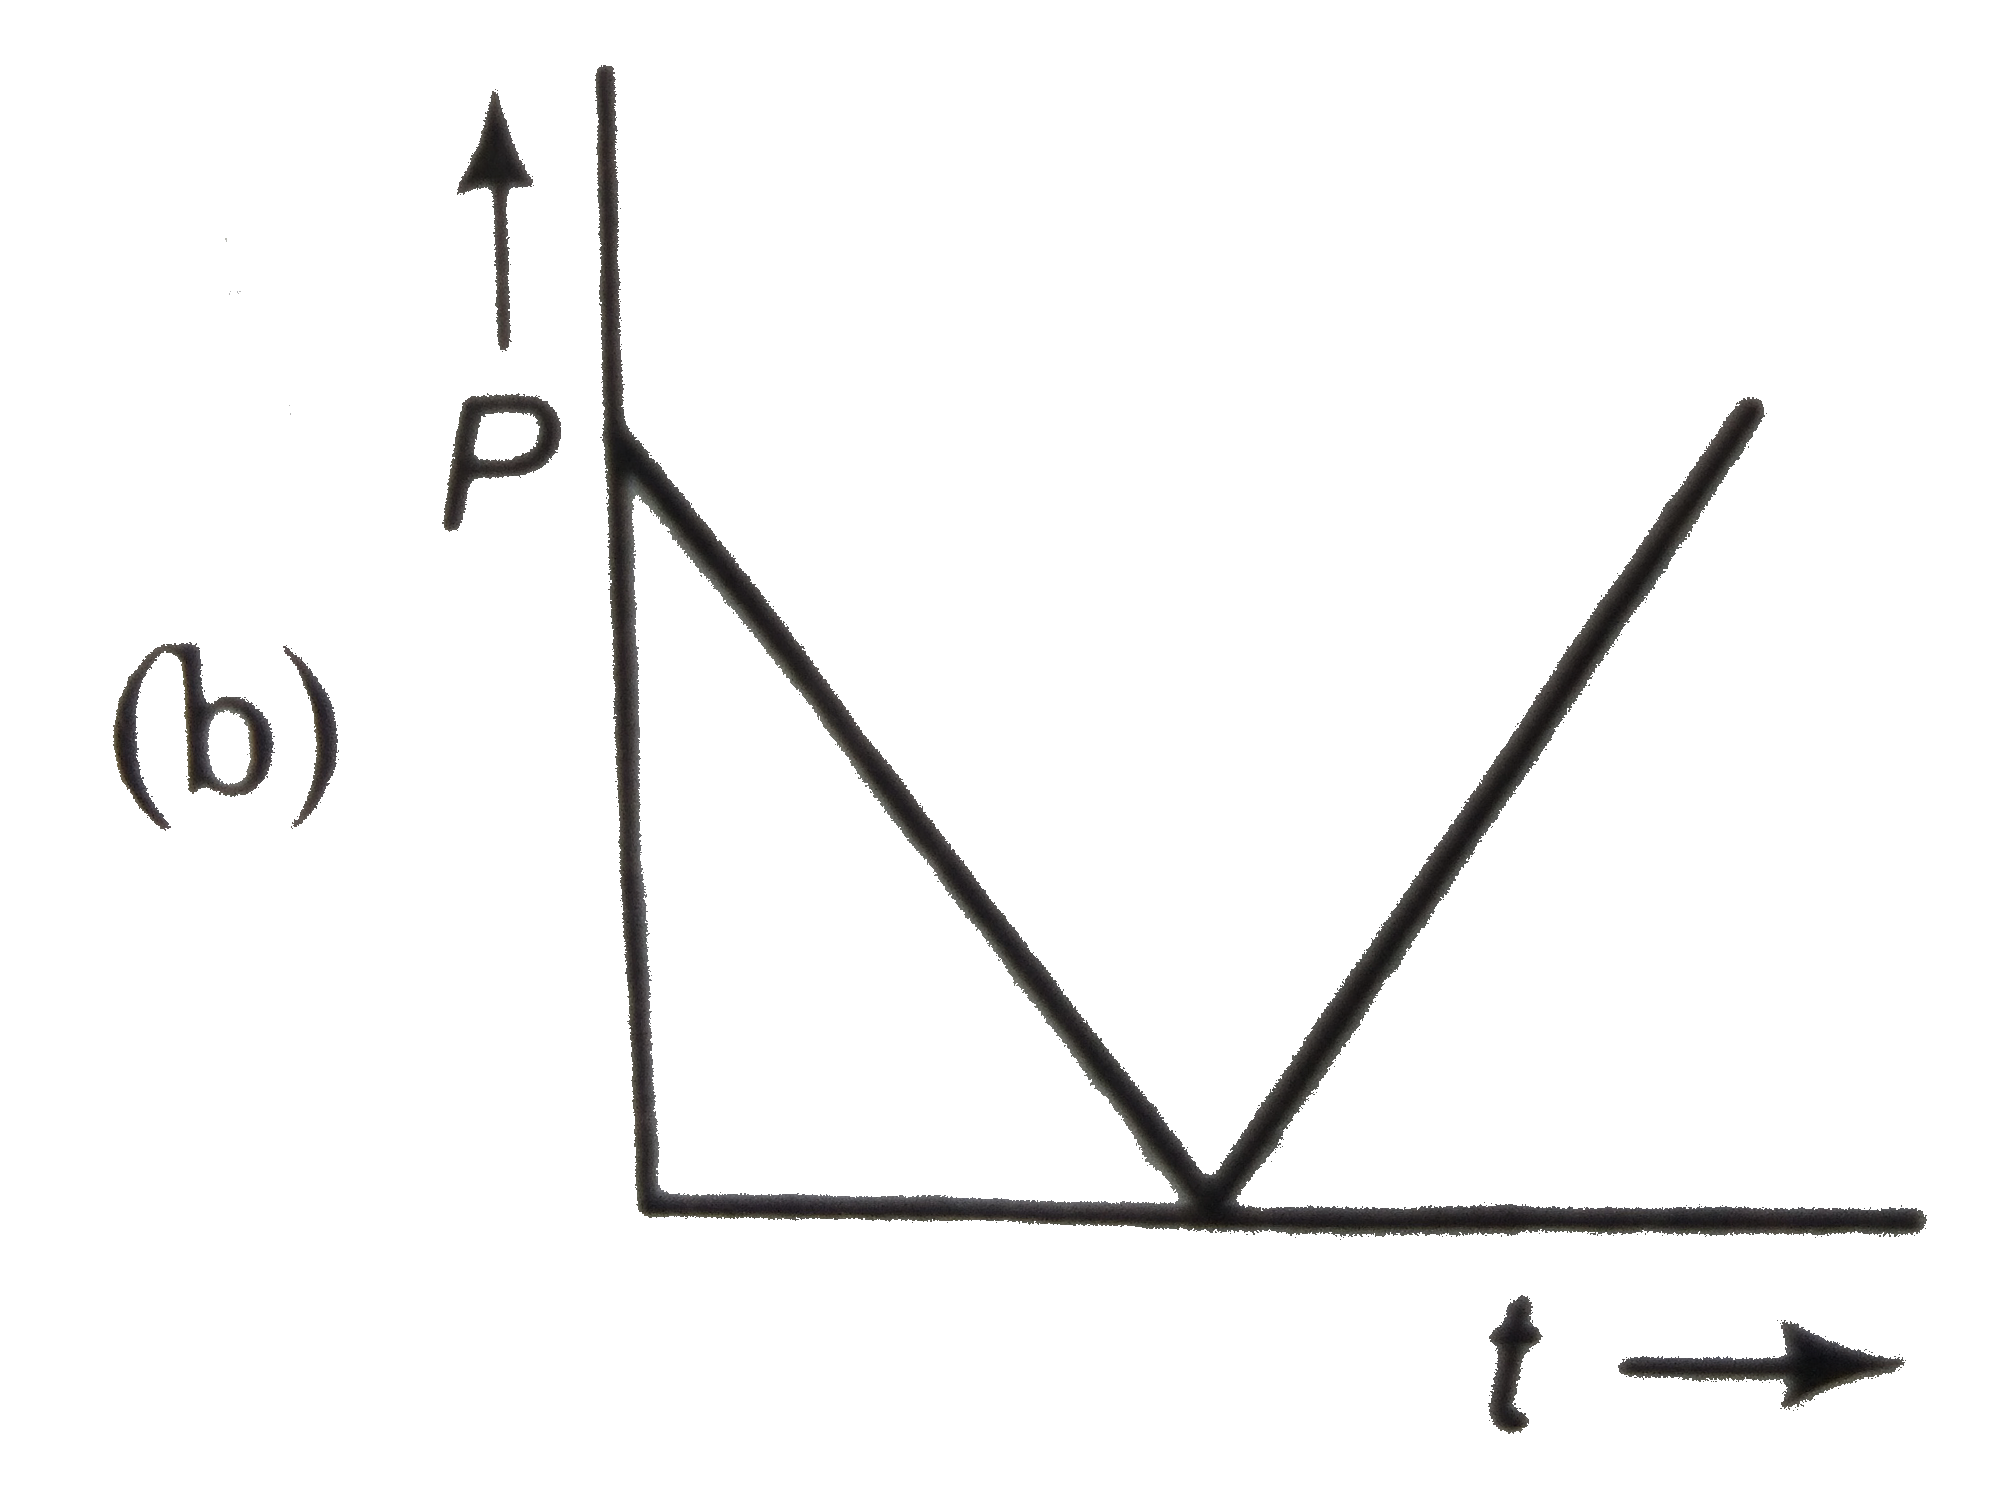
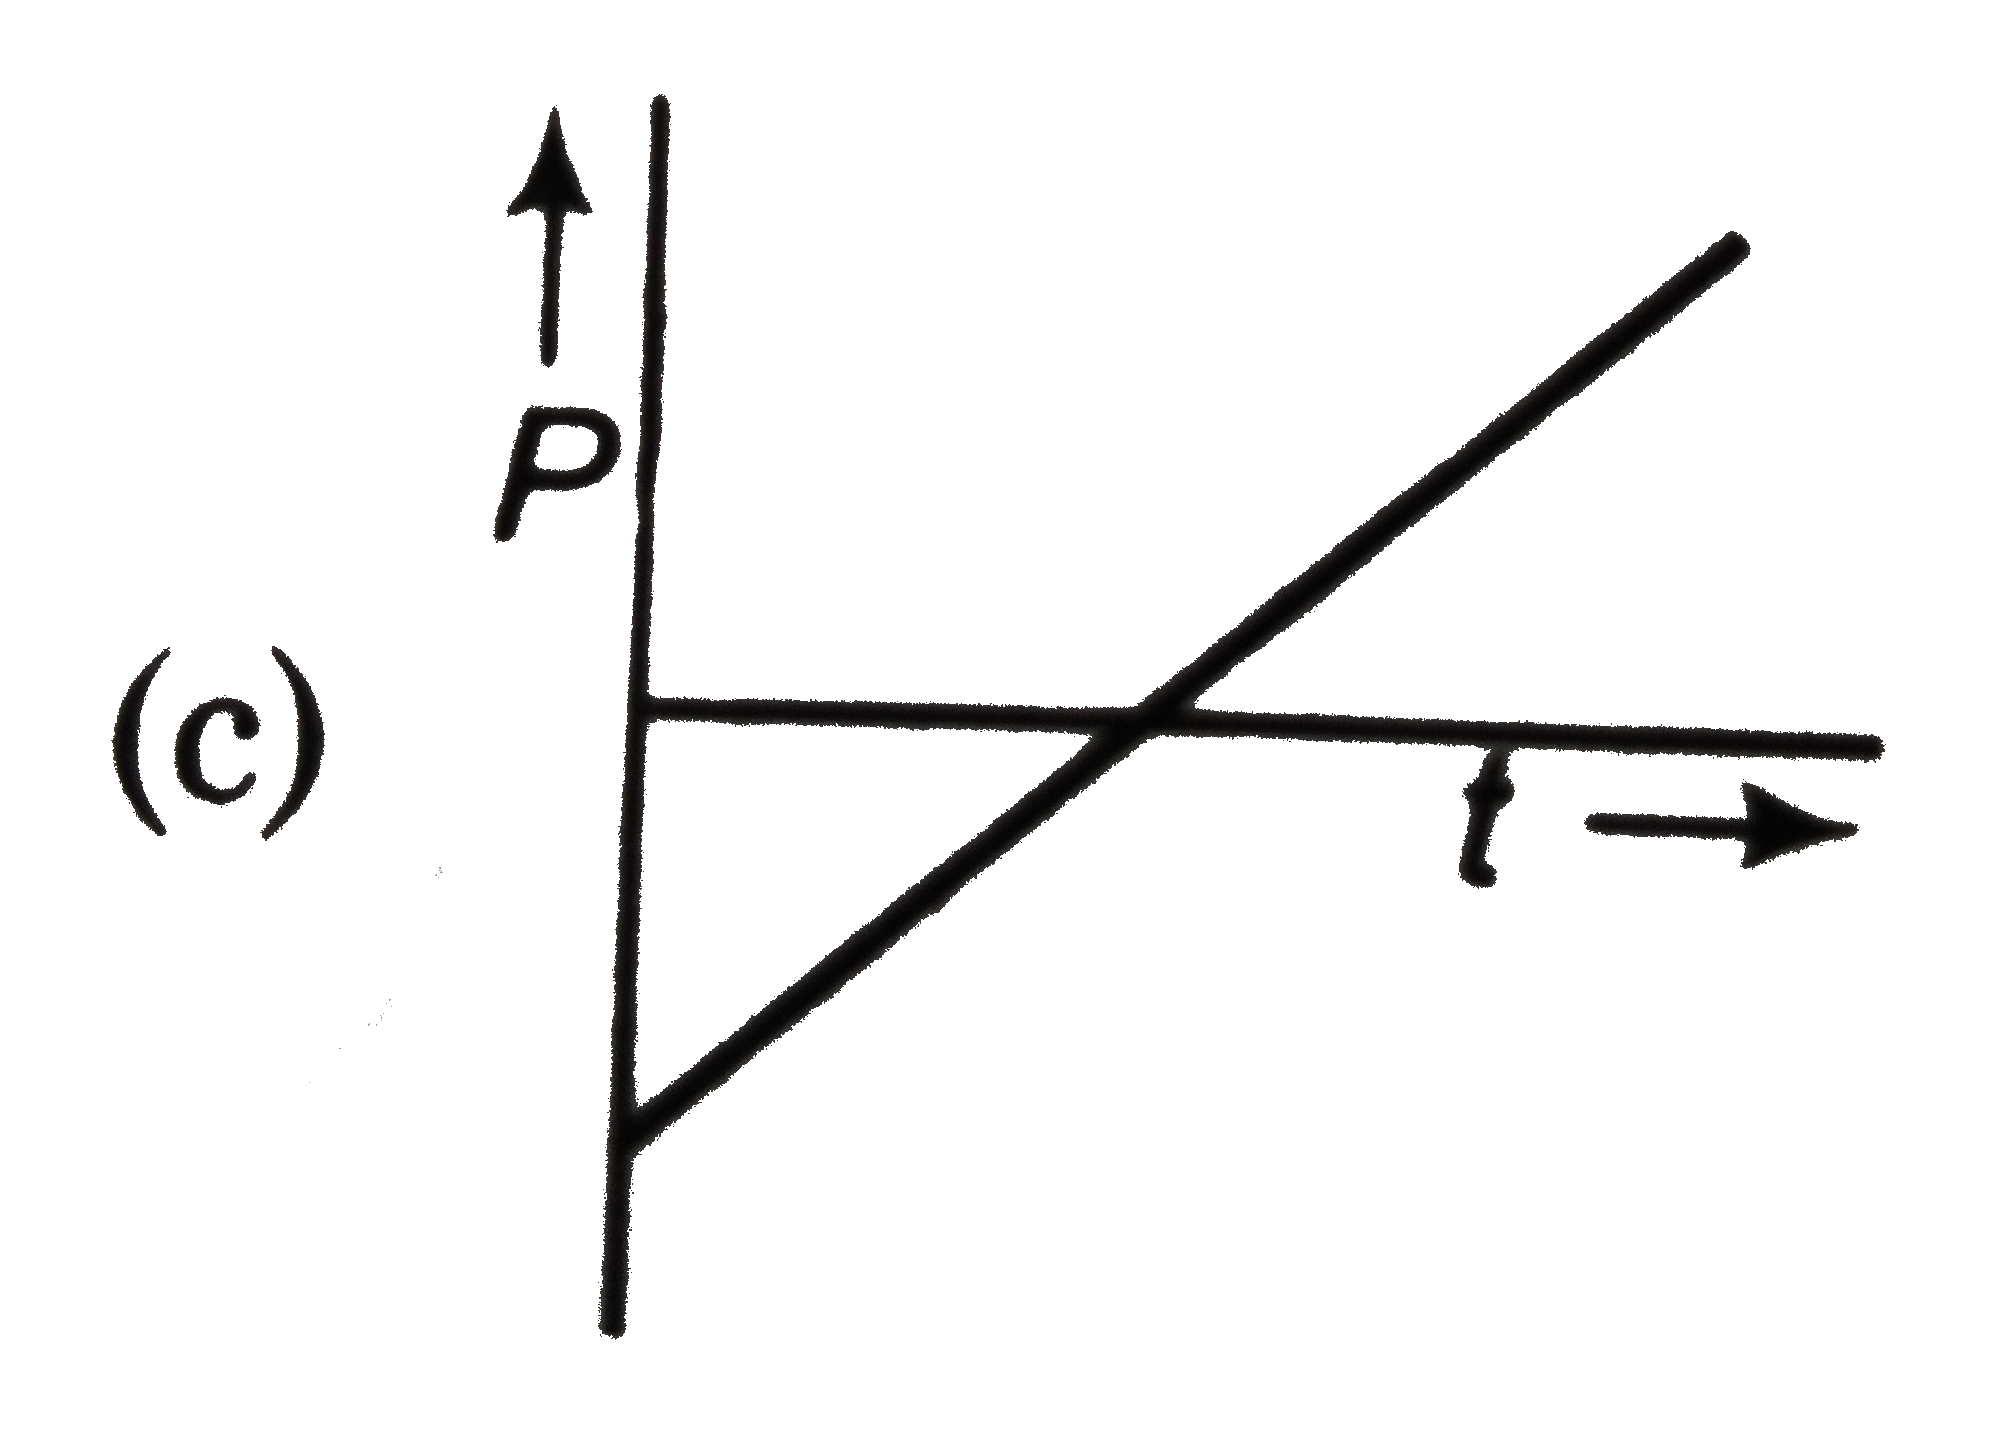
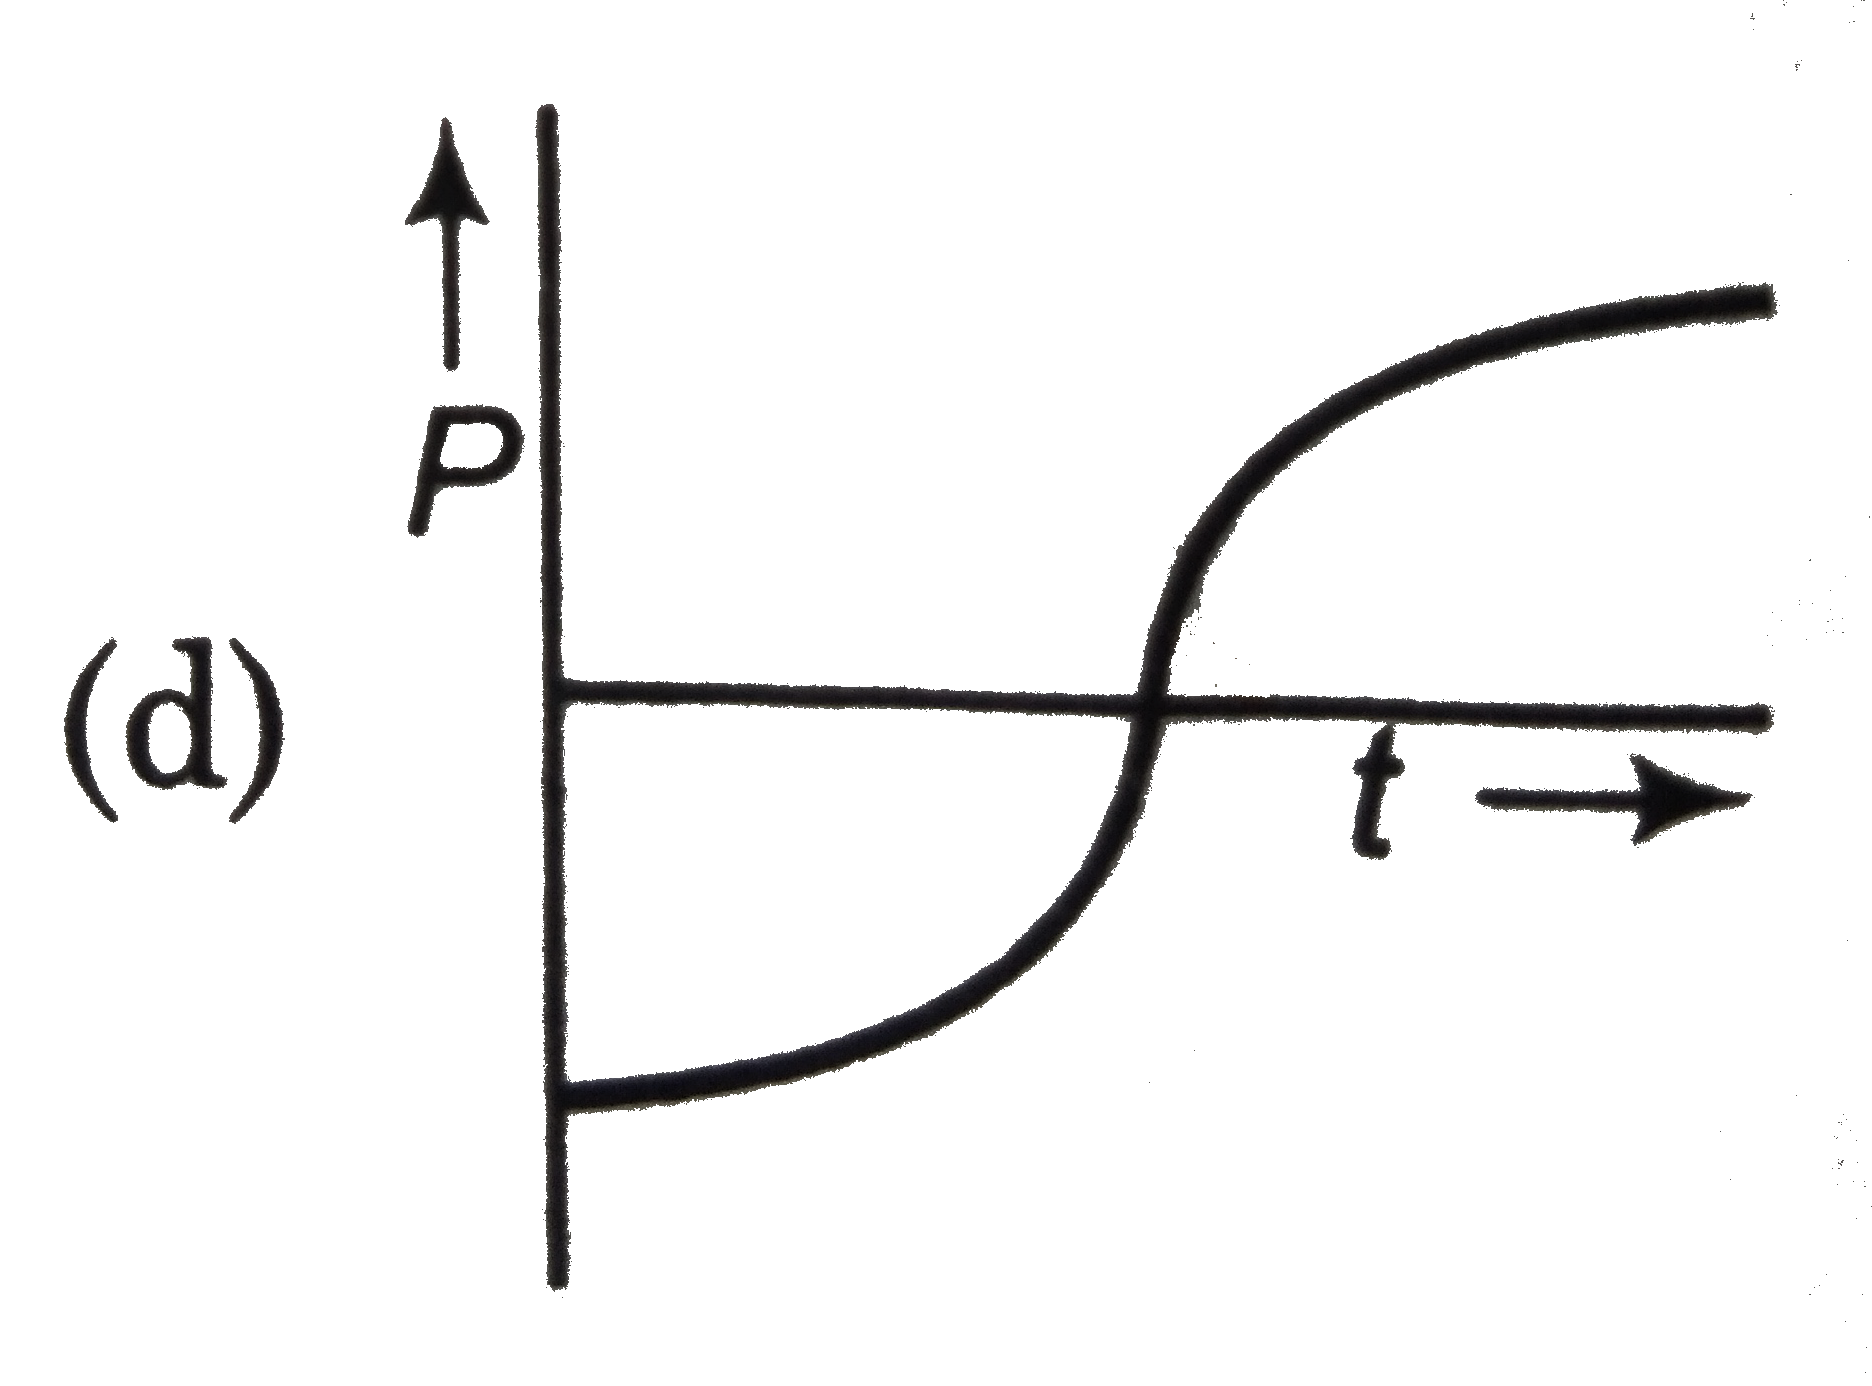
The correct Answer is:C
P=F.v
=(−mgˆj).[uxˆi+(uy−gt)ˆj]
=(−mguy)+mg2t
i.e P versus t graph is a straight line with negative intercept and positive slope.
Similar Questions
A particle is projected at time t=0 from a point O with a speed u at an angle θ to horizontal. Find the torque of a gravitational force on projectile about the origin at time t.(x,y plane is vertical plane)
View SolutionA particle is projected form ground with velocity u ar angle θ from horizontal. Match the following two columns.
View Solution
Knowledge Check
A particle is projected at t=0 from a point on the ground with certain velocity at an angle with the horizontal. The power gravitational force is plotted against time. Which of the following is the best representation ?
A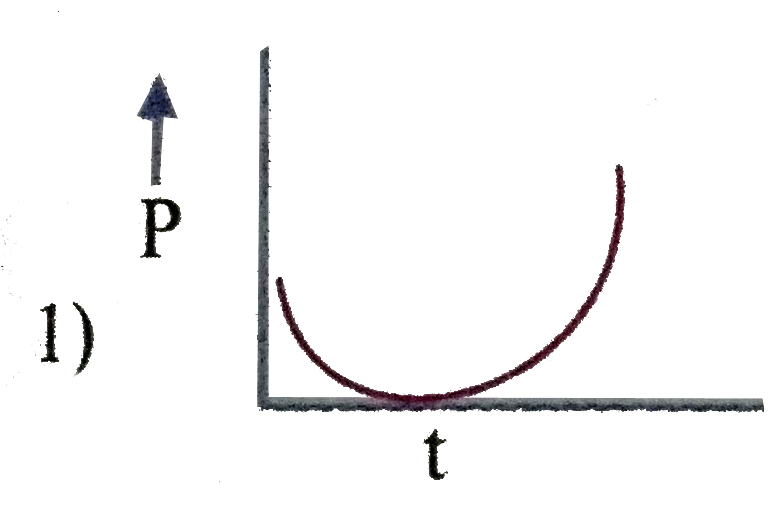 B
B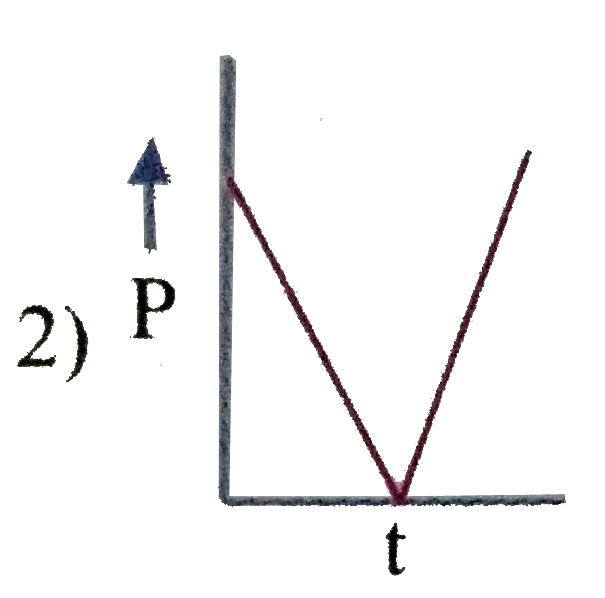 C
C D
D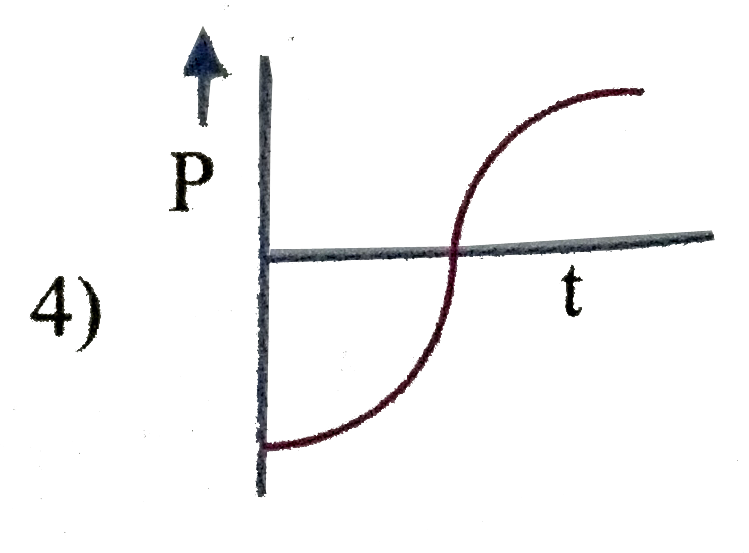
A particle is projected with a velocity u making an angle θ with the horizontal. The instantaneous power of the gravitational force
A(a) Varies linearly with timeB(b) Is constant throughoutC(c) Is negative for complete pathD(d) None of the aboveA particle is projeced with a velocity u making an angle θ with the horizontal. The instantaneous power of the gravitational force
Avaries linearly with timeBis constant throughout the pathCis negative for complete pathDvaries inversly with time
A particle is projected at time t=0 from a point P on the ground with a speed v0, at an angle of 45∘ to the horizontal. Find the magnitude and direction of the angular momentum of the particle about P at tiem t=v0/g
View SolutionA particle is projected from a point P with a velocity v at an angle θ with horizontal. At a certain point Q it moves at right angles to its initial direction. Then
View SolutionA particle is projected from a point O with a velocity u at an angle α (upwards) to the horizontal. At a certain point P it moves at right angles to its initial direction. It follows that:
View SolutionThe rate of decay (R) of nuclei in a radioactive sample is plotted against time (t). Which of the following best represents the resulting curve ?
View SolutionThe rate of decay (R) of nuclei in a radioactive sample is plotted against time (t). Which of the following best represents the resulting curve ?
View Solution
