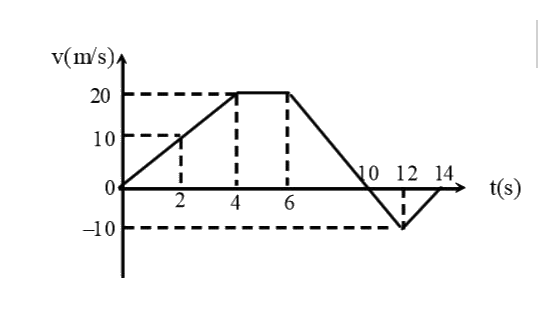
Velocity-time graph of a particle moving in a straight line is shown in figure. At time t=0, displacement of the particle from mean position is 10 m. Find
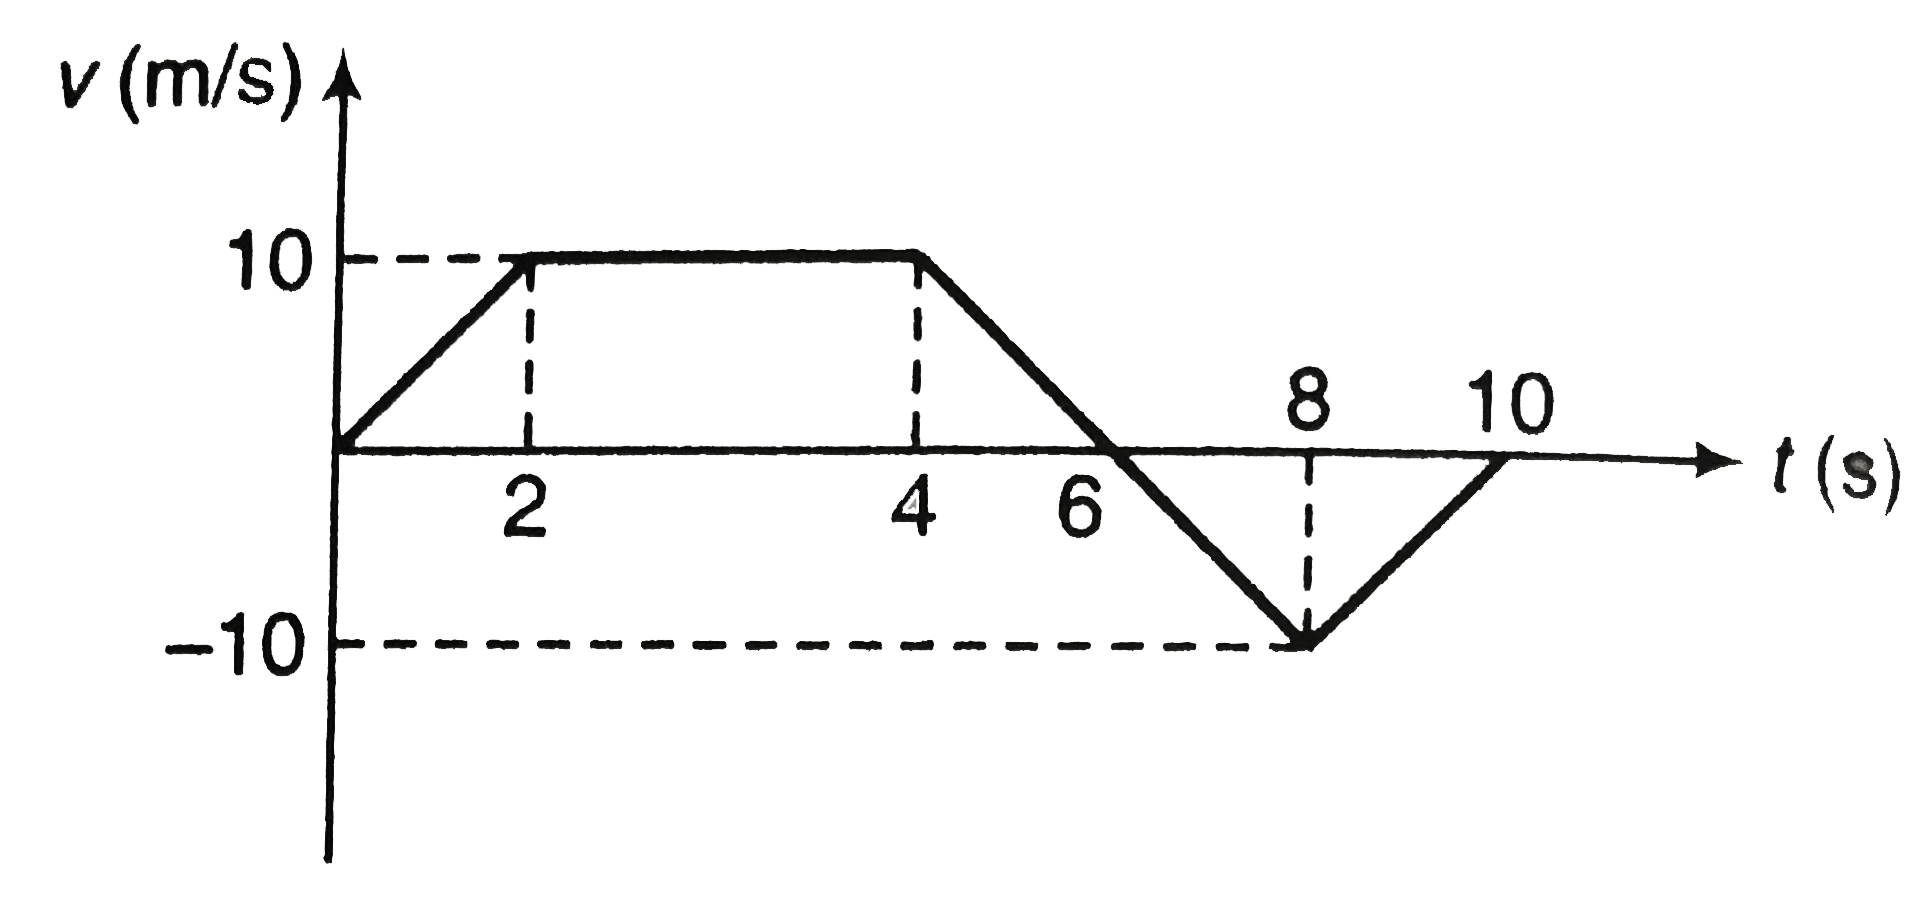
(a) acceleration of particle at t=1s,3sand9s.
(b) position of particle from mean position at t=10s.
(c) write down s-t equation for time interval (i)0≤t≤2s, (ii) 4s≤t≤8s
The correct Answer is:A, B, C, D
(a) a=slope of v-t graph
(b) s=rf−ri=net area of v-t graph
∴rf=ri+net area
=10+10+20+10−10−10
=30m
(c) (i) For 0≤t≤2s
u=initial velocity=0
s0=initial displacement =10m
a=slope of v-t graph =+5m/s2
∴s0+ut+12at2=10+2.5t2
(ii) For 4s≤t≤8s
u=initial velocity =10m/s
=velocity at 4s
s0=(10m)+area of v-t graph upto 4s
=10+10+20=40m
a=slope of v-t graph =−5m/s2
s=s0+u(t−4)+12a(t−4)2
=40+10(t−4)−2.5(t−4)2
Topper's Solved these Questions
- KINEMATICSBOOK - DC PANDEYCHAPTER - KINEMATICSEXERCISE - More Than One Correct
6 Videos
- KINEMATICSBOOK - DC PANDEYCHAPTER - KINEMATICSEXERCISE - Comprehension
7 Videos
- KINEMATICSBOOK - DC PANDEYCHAPTER - KINEMATICSEXERCISE - Objective
45 Videos
- GRAVITATIONBOOK - DC PANDEYCHAPTER - GRAVITATIONEXERCISE - (C) Chapter Exercises
45 Videos
- KINEMATICS 1BOOK - DC PANDEYCHAPTER - KINEMATICS 1EXERCISE - INTEGER_TYPE
15 Videos
Similar Questions
Velocity-time graph of a particle moving in a straight line is shown in figure. At time t=0.s=20m. Plot a-t and s-t graphs of the particle.
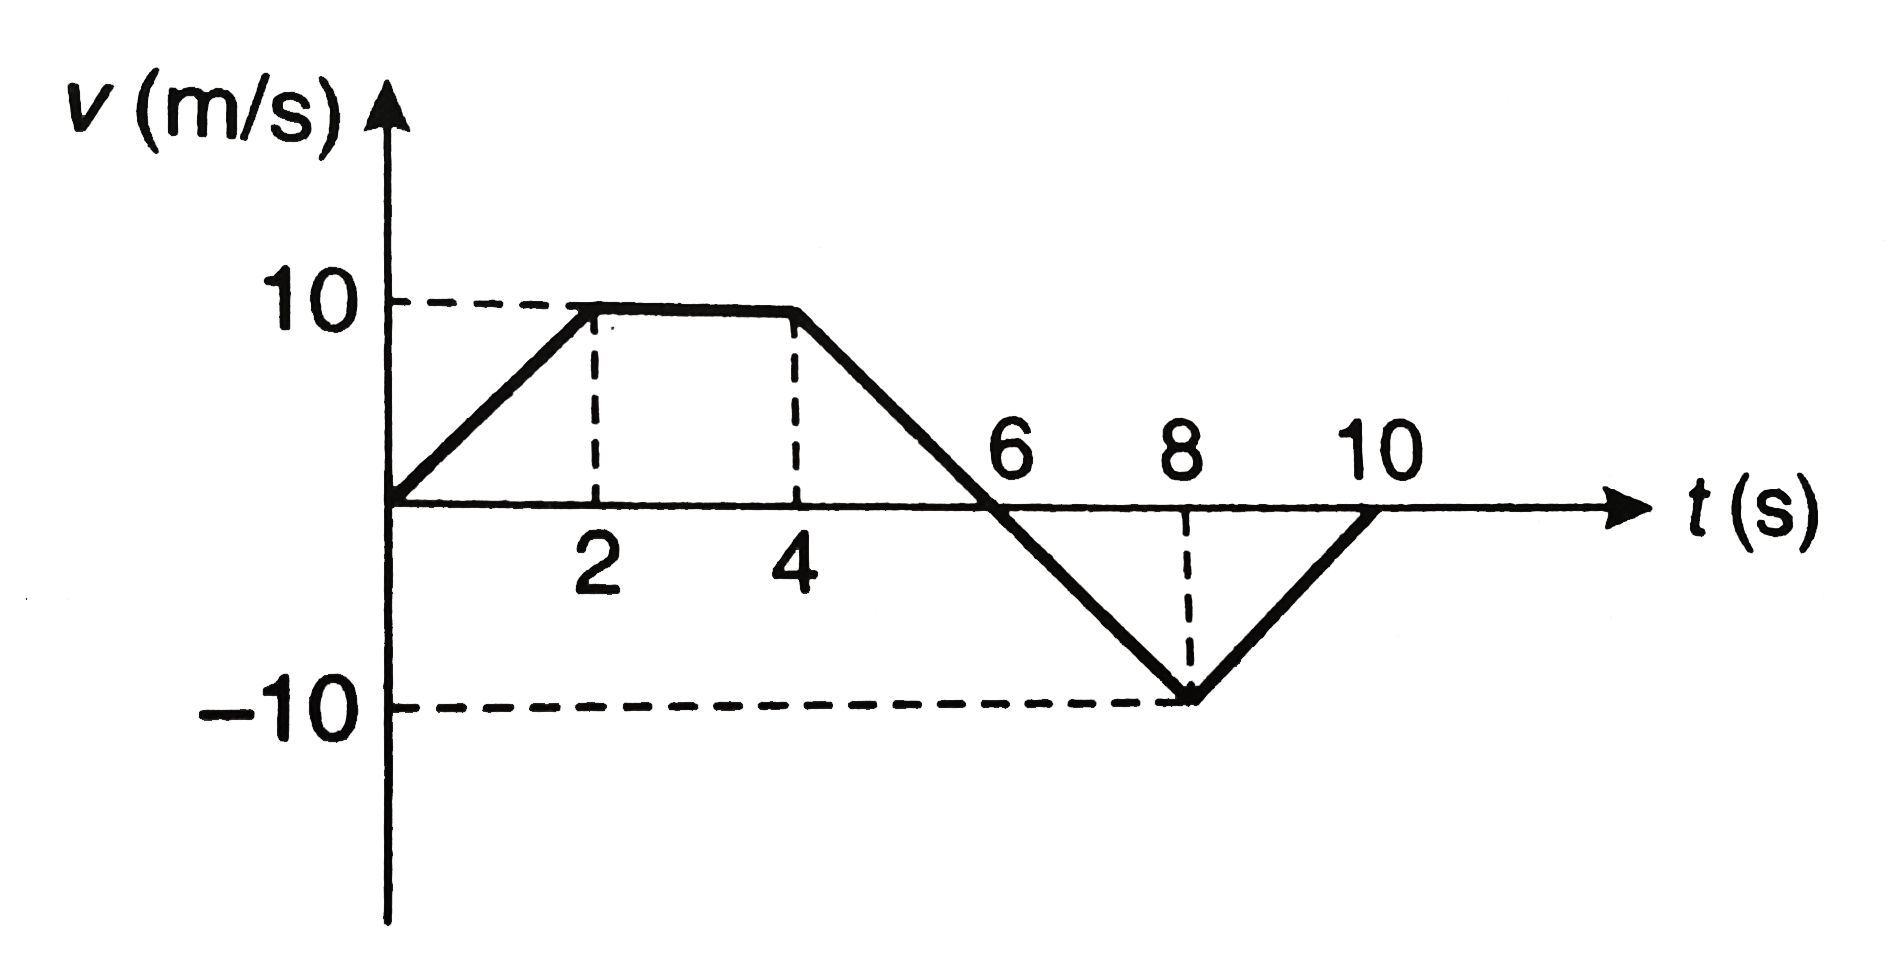
View SolutionVelocity-time graph of a particle moving in a straight line is shown in figure. At time t=0,s=−10m. Plot corresponding a-t and s-t graphs.
View Solution
Knowledge Check
The velocity -time (v−t) graph of a particle moving in a straight line is shown in figure. The acceleration of the particle at t=9 is:
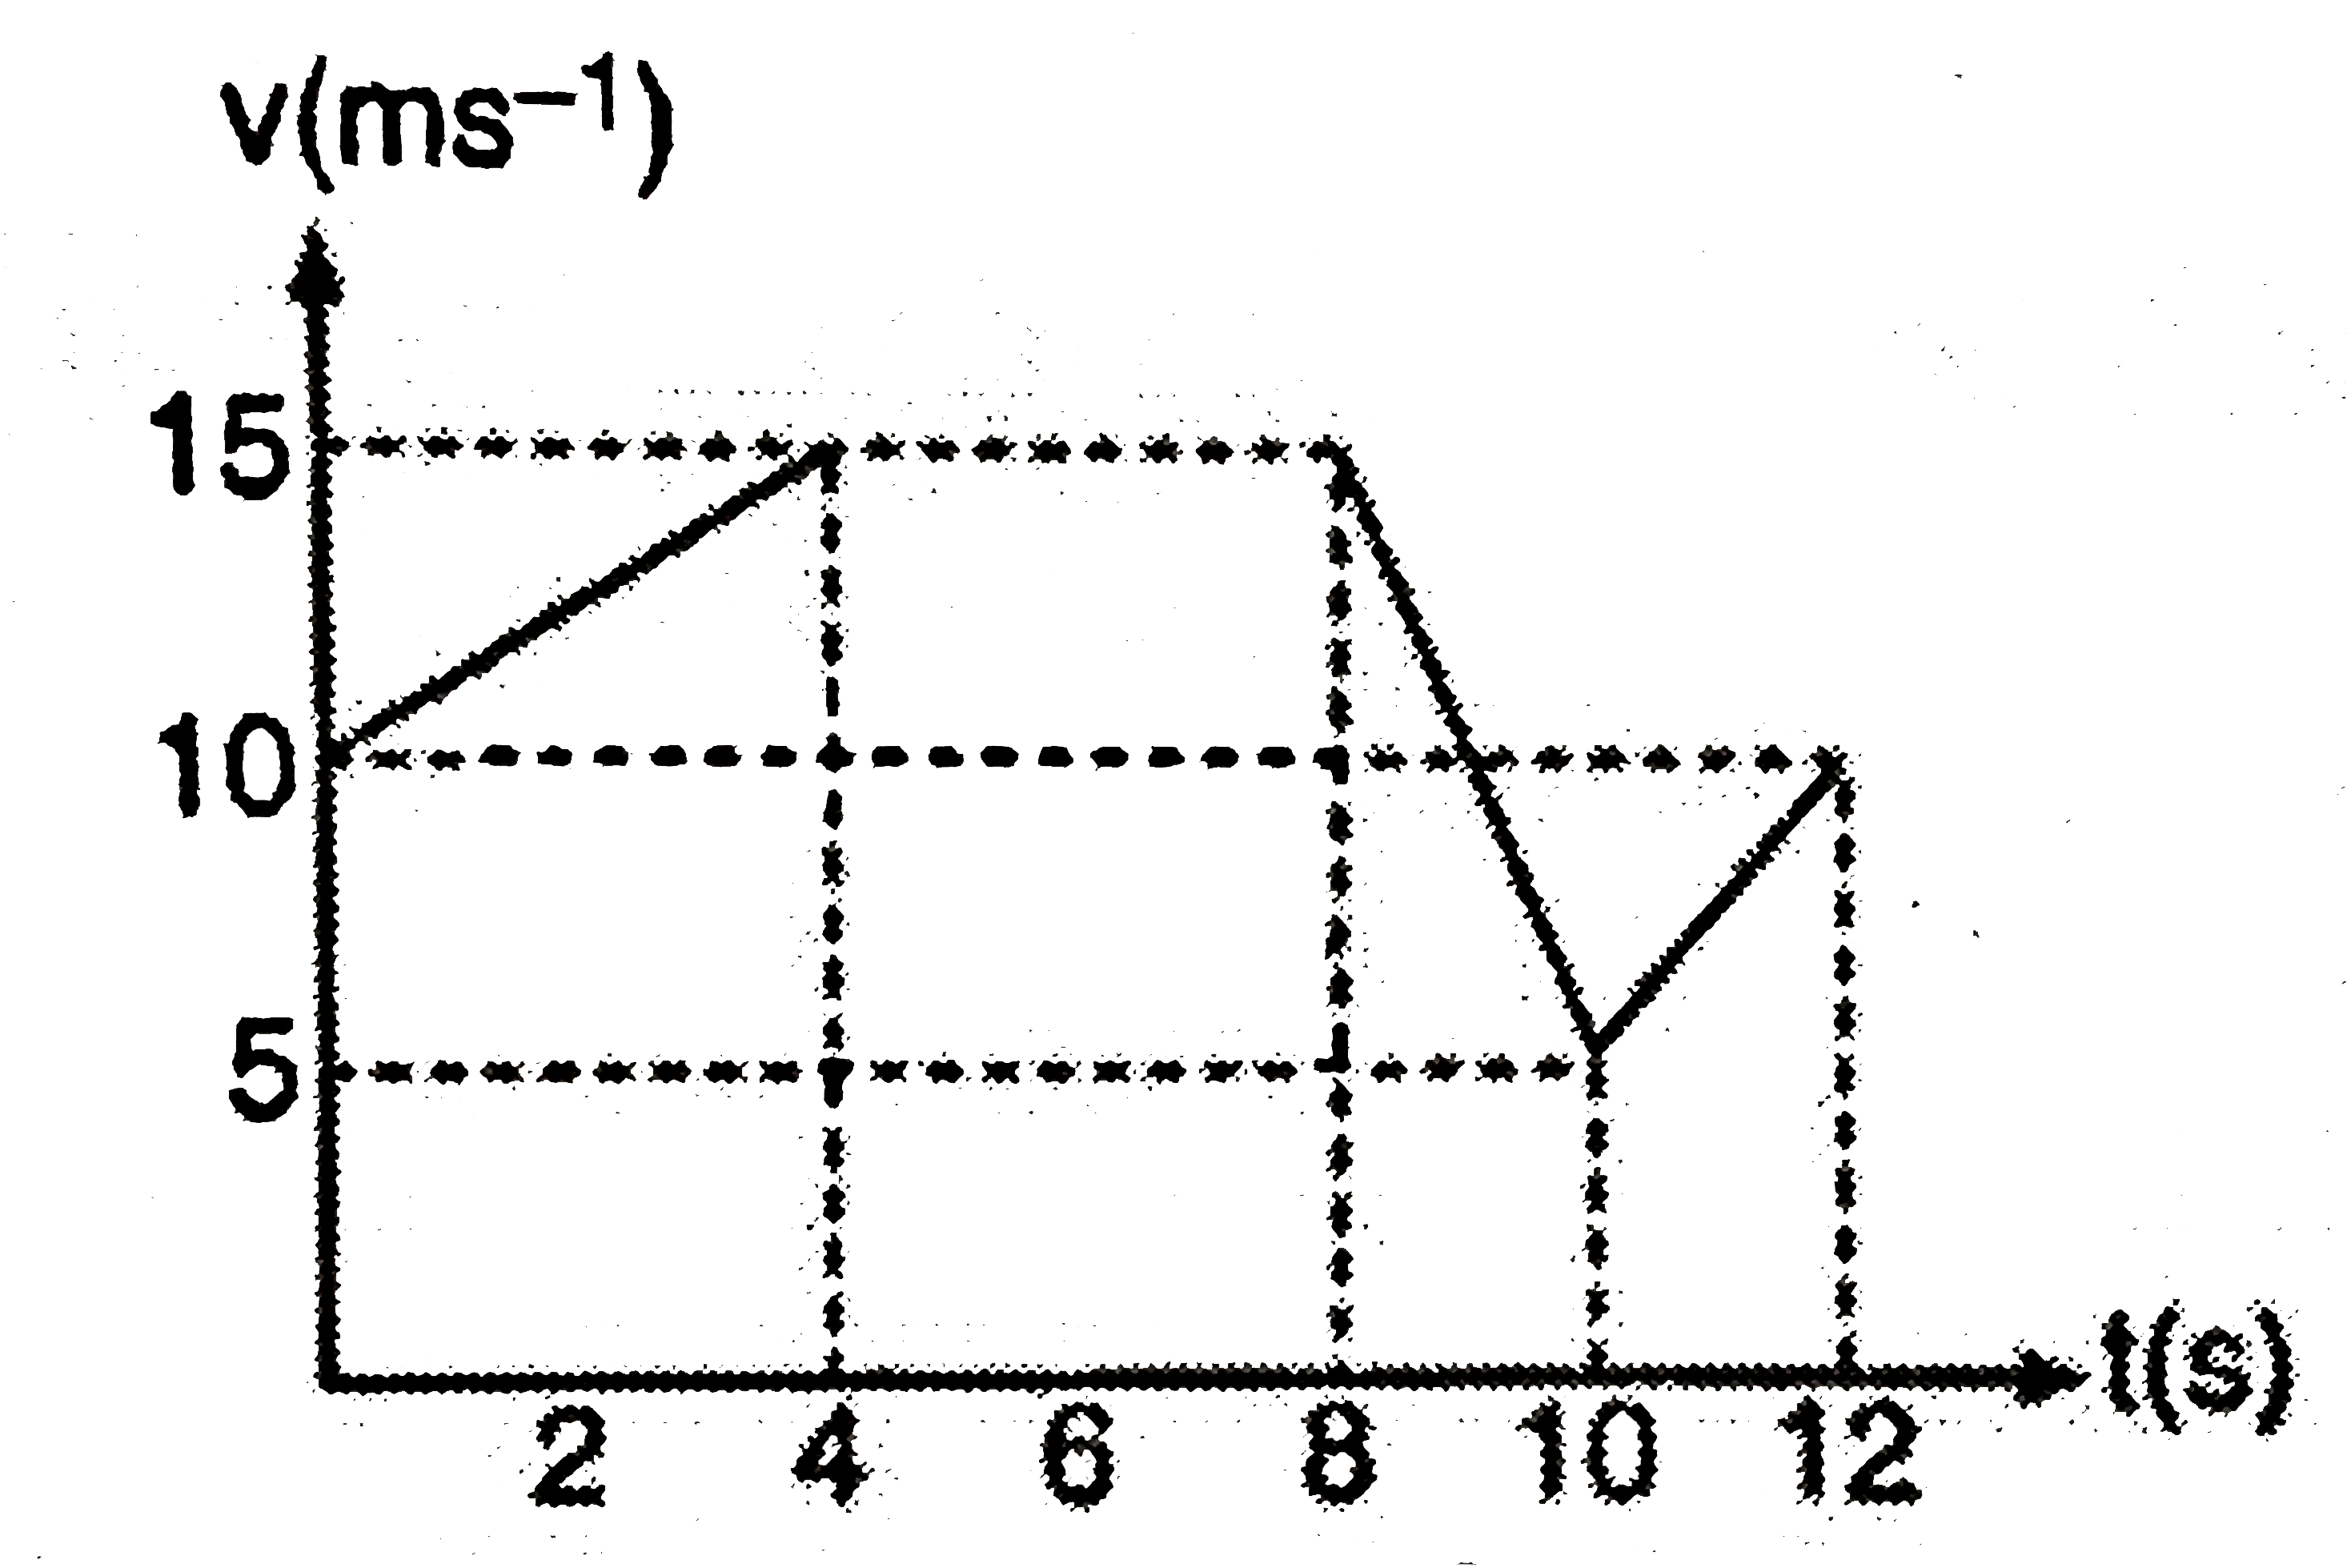 AzeroB5ms−2C−5ms2D−2ms−2
The velovity-time graph of a particle moving in a straitht line is shown in . The acceleration of the particle at t=9s is.
 .AZeroB5ms−2C−5ms−2D−2ms2
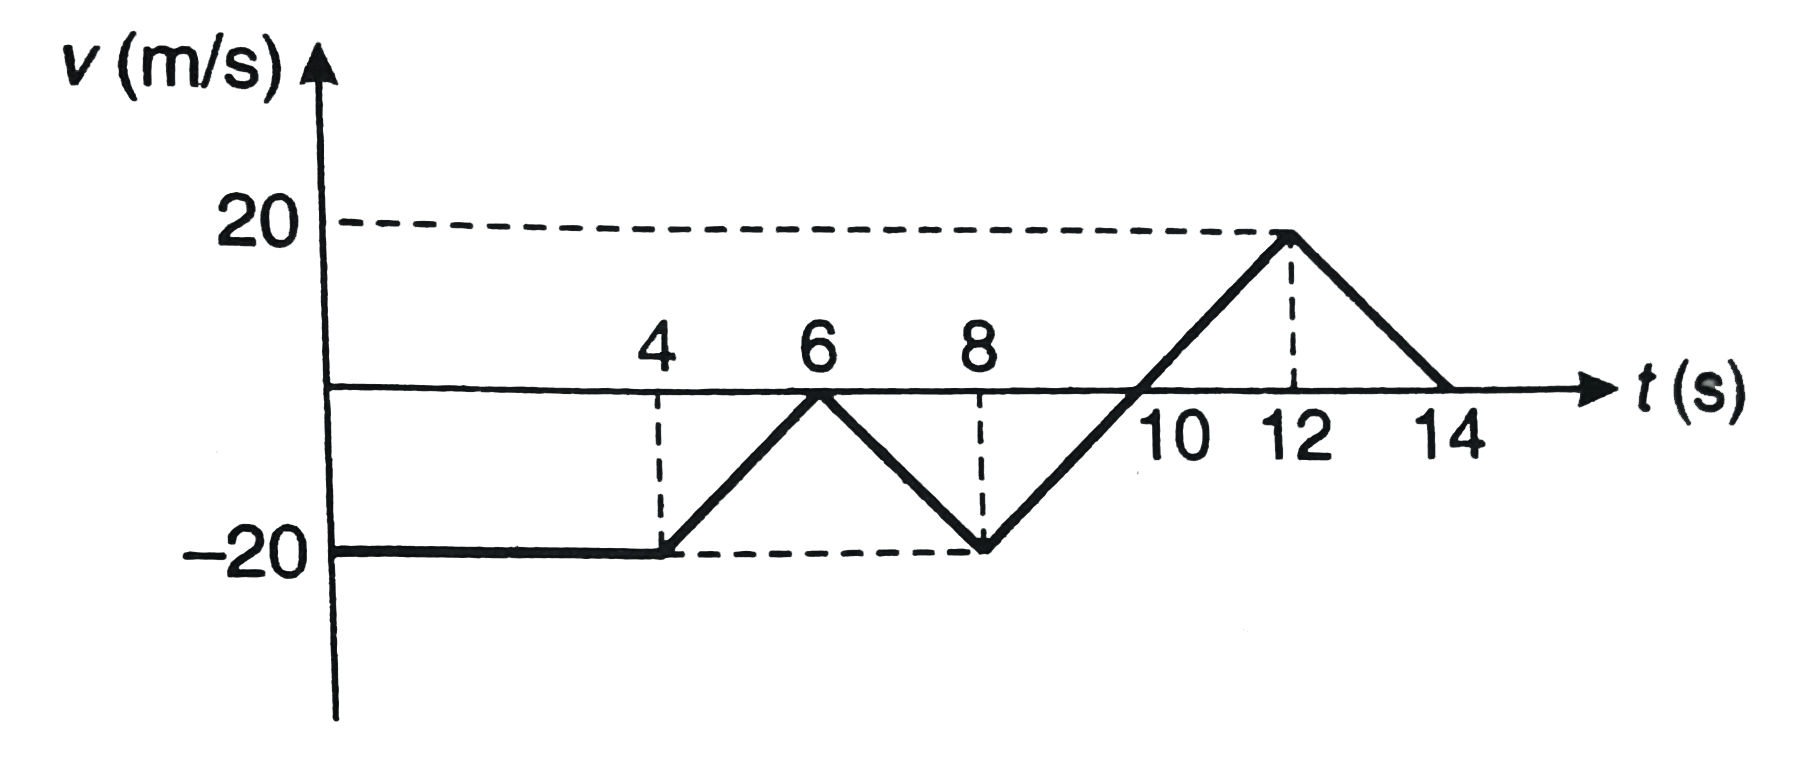
Velocity-time graph of a particle moving in a straight line is shown in figure. In the time interval from t = 0 to t = 14 s, find:
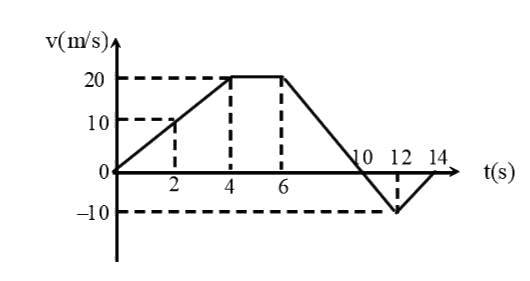
Q. average speed of the particleA20m/sB40m/sC10m/sD30m/s
Velocity-time graph of a particle moving in a straight line is shown in figure. Plot the corresponding displacement-time graph of the particle if at time t=0, displacement s=0.
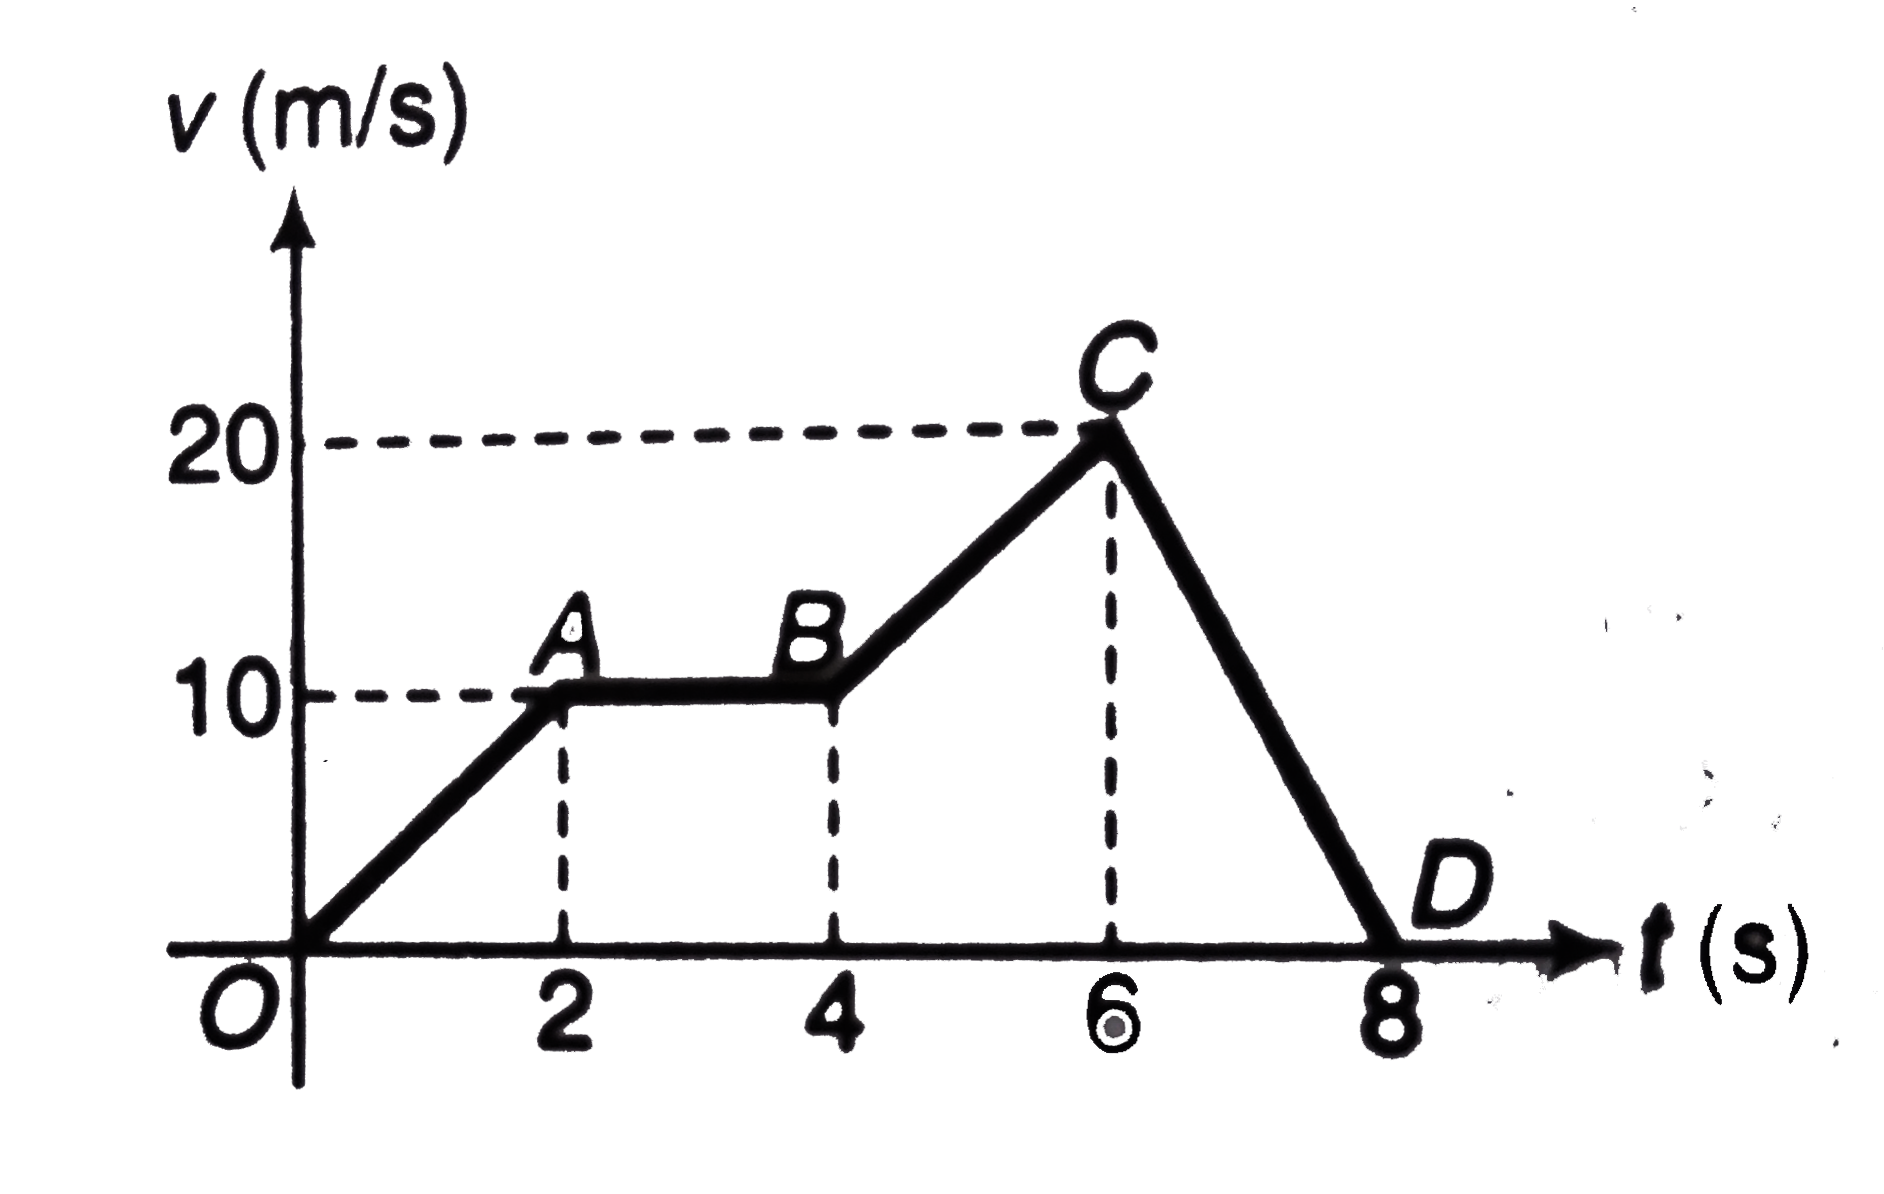
View SolutionAcceleration-time graph of a particle moving in a straight line is as shown in figure. At time t=0, velocity of the particle is zero. Find
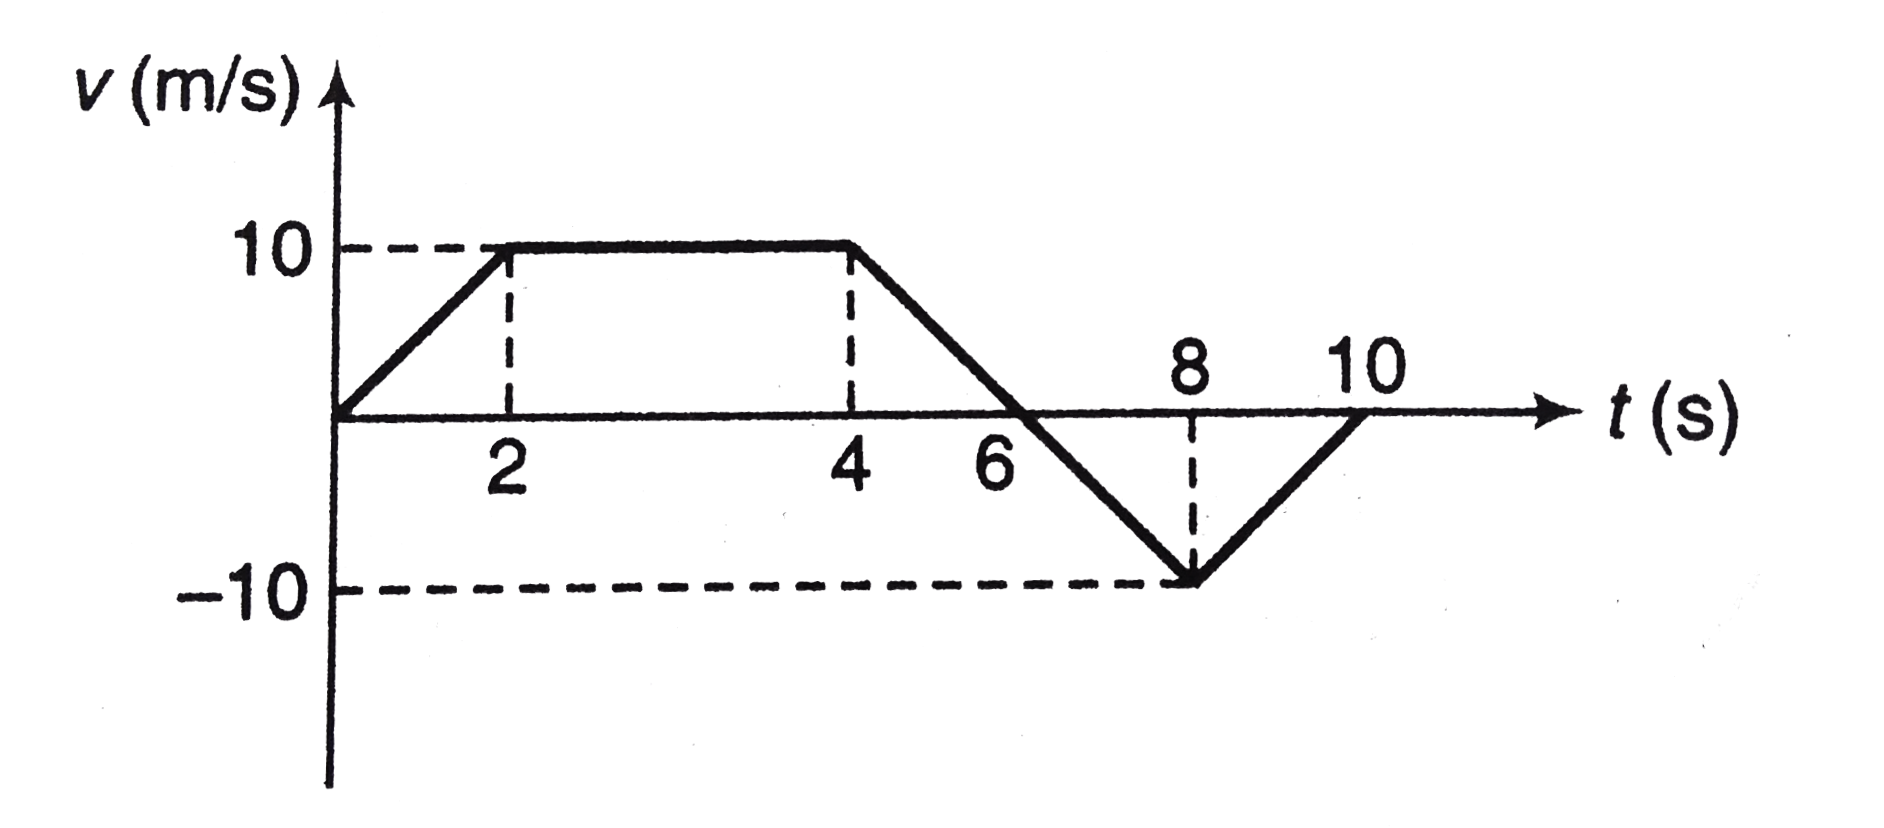
(a) average acceleration in a time interval from t=6s to t=12s,
(b) velocity of the particle at t=14s.
View SolutionVelocity-time graph of a particle moving in a straight line is shown in figure. In the time interval from t=0 to t=14s, find
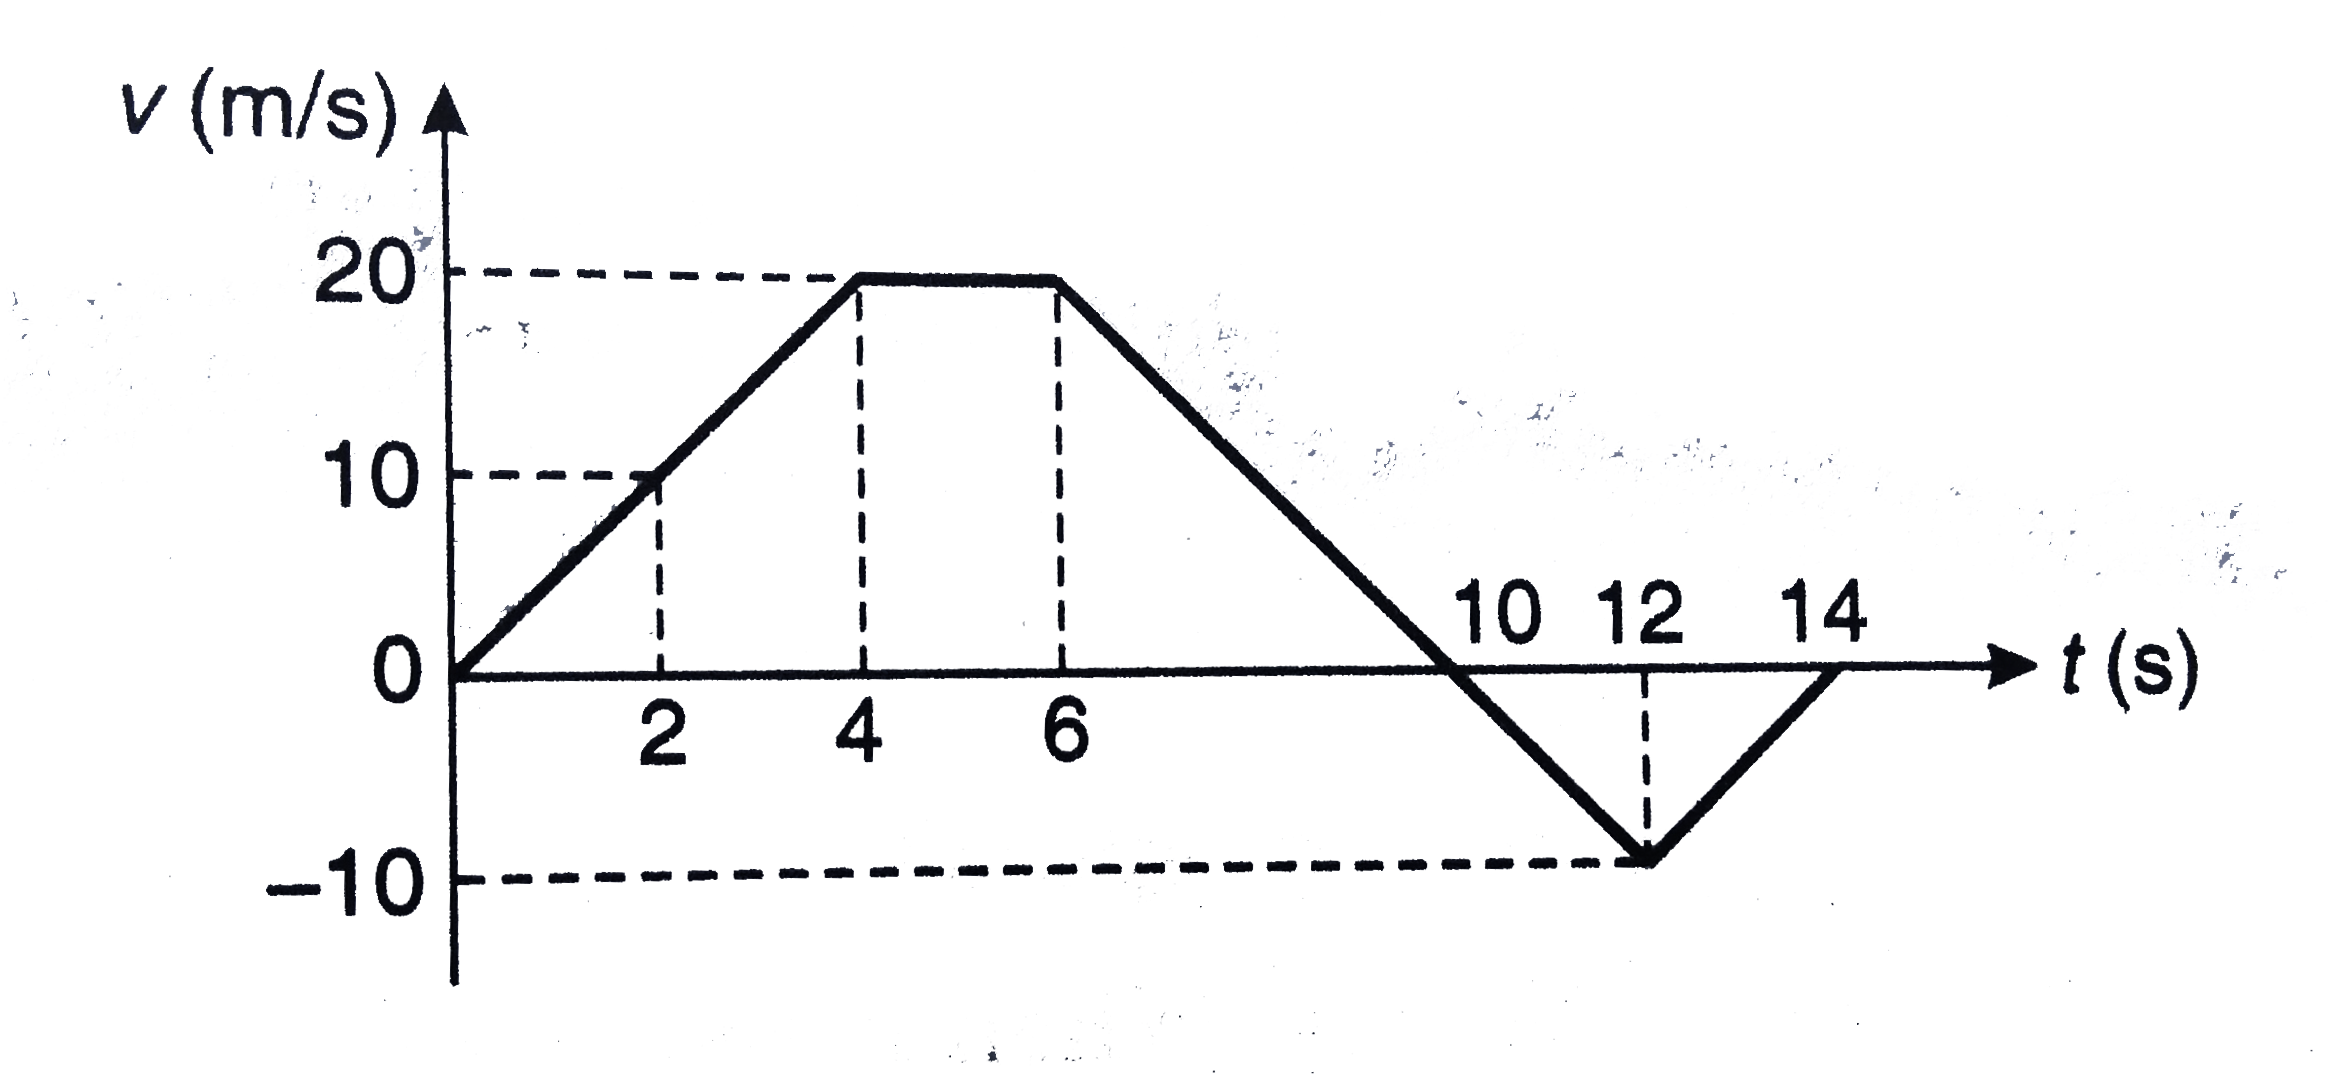
(a) average velocity and
(b) average speed of the particle.
View SolutionVelocity-time graph of a particle moving in a straight line is shown in figure. In the time interval from t = 0 to t = 14 s, find:
Q. average velocity and
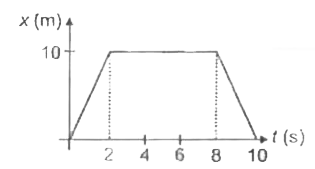
View SolutionThe position - time graph for a particle moving along a straight line is shown in figure. The total distance travelled by it in time t = 0 to t = 10 s is
View Solution
