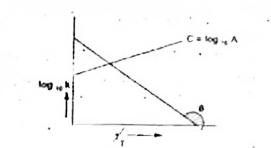
Slope of the straight line obtained by plotting log10 k against 1/T represents what term ?
A
−Ea
B
−2303Ea/R
C
−Ea/2303R
D
−Ea/R
Video Solution
Text Solution
The correct Answer is:C
According to Arrhenius equation
k=AeEa/RT
By taking log on both sides
logk=logeA−EaRT
log10k=log10A−Ea2303RT
Comparing it with y=mx+c
A plot between log10 k and (1T) is a straight line and slope is given by

Slope =−Ea2.303R
(slope has negative value)
|
Topper's Solved these Questions
Similar Questions
Knowledge Check
Slope of the straight line obtained by plotting log10 k against 1/T represents what term ?
A−EaB−2.303Ea/RC−Ea/2.303RDEa/RThe slope of the straight line obtained by plotting rate versus concentration of reactant in a first order reaction is
A−kB−k2.303Ck2.303DkWhen the temperature is increased, heat is supplied which increases the kinetic energy of the reacting molecules. This shall increase the number of collisions and ultimately the rate of reaction shall be enhanced. Arrhenius suggested a equation which describes K as a function of temperature, i.e.
k=Ae−Ea/RT
where
k= rate constant
A= a constant (frequency factor)
Ea= energy of activation
log10k=log10A−Ea2.303R[1R]
Y=C+MX
It is the equation of straight line with negative slope. On plotting log10k against [1T] we get a straight line as shown below :

The slope gives activation energy and intercept gives frequency factor.
Also log.k2k1=Ea2.303[T2−T1T1T2]
The rate of certain reaction increases by 2.5 times when the temperature is raised from 300K to 310K. If k is the rate constant at 300K then rate constant at 310K will be equal toAkB2kC2.5kD13k
According to the Arrhenius equation a straight line is to be obtained by plotting the logarithm of the rate constant of a chemical reaction (logk) against
View SolutionAccording to Moseley, a straight line graph is obtained on plotting:
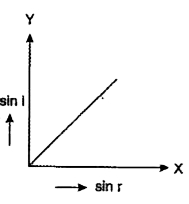
View SolutionWhen a ray of light undergoes refraction, a straight line graph is obtained by plotting sine of angle of incidence versus sine of angle of refraction. The slope of this graph represents.

View SolutionA graph plotted between log k vs 1T is represented by
View SolutionThe graph obtained by plotting loge(A) [A is the activity of a radioactive sample] against t (time) out of the following
View Solution
