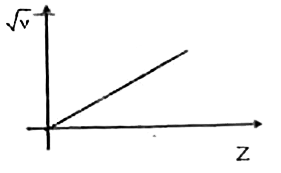
According to Moseley, a straight line graph is obtained on plotting:
the frequencioes of characteristic line graph
the square of the frequencies of characteristic X-rays of elements against their atomic numbers
the square root of the frequencies of characteristis X-rays of elements against their atomic numbers.
the reciprocal of the frequencies of characteristic X-rays of elements against their atomic numbers
The correct Answer is:C
Step by step video, text & image solution for According to Moseley, a straight line graph is obtained on plotting: by Chemistry experts to help you in doubts & scoring excellent marks in Class 11 exams.
Updated on:21/07/2023Topper's Solved these Questions
- PERIODIC TABLEBOOK - GRB PUBLICATIONCHAPTER - PERIODIC TABLEEXERCISE - B.Atomic and Ionic Radius
71 Videos
- PERIODIC TABLEBOOK - GRB PUBLICATIONCHAPTER - PERIODIC TABLEEXERCISE - C.Ionisation Energy
93 Videos
- NOMENCLATURE AND CLASSIFICATIONBOOK - GRB PUBLICATIONCHAPTER - NOMENCLATURE AND CLASSIFICATIONEXERCISE - Subjective Type
24 Videos
- PRACTICAL ORGANIC CHEMISTRYBOOK - GRB PUBLICATIONCHAPTER - PRACTICAL ORGANIC CHEMISTRYEXERCISE - Exercise 4 (Matrix match type )
1 Videos
Similar Questions
Knowledge Check
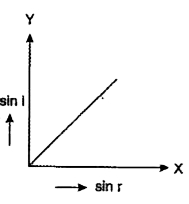
When a ray of light undergoes refraction, a straight line graph is obtained by plotting sine of angle of incidence versus sine of angle of refraction. The slope of this graph represents.
 Avelocity of lightBrefractive indexCwavelength of lightDnone of these
The intergrated rate equation is
Rt=log,C0−logCt. The straight line graph is obtained by plotting:At vs log CtB1t vs log CtCt vs CtD1t vs log 1CtThe integrated rate equation is:
Rt=logC0−logCr
The straight line graph is obtained by plotting.Atime vs log C1B1time vs CtCtime vs CtD1time vs 1Ct
The intergrated rate equation is
Rt=log,C0−logCt. The straight line graph is obtained by plotting:
View SolutionThe intergrated rate equation is
Rt=log,C0−logCt. The straight line graph is obtained by plotting:
View SolutionThe integrated rate equations is R=logC0−logCr
The straight line graph is obtained by plotting
View Solution
According to Moseley 'a' and 'b' are
View SolutionFor a lst order reaction , a straight line is obtained if you plot
View Solution
