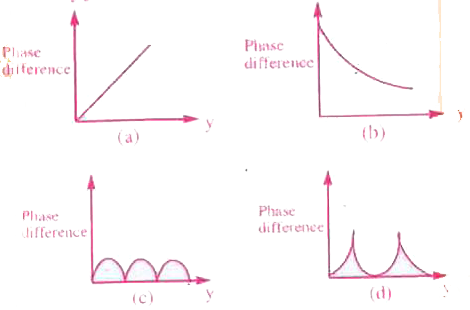
Which of the following graphs best represent the variation of phase difference between he interferring waves in a double slit experiment with the distance from the central maximum?

Phase difference
△ϕ=(dsinθ)(2πλ)=dtanθ⋅(2πλ) (∴y<<D∴θ≈ small )
=dyD⋅(2πλ)i.e.,△ϕ∝y,
The required graph is a straight line.
Related Playlists
Similar Questions
Which of the following graphs best represents the variation of acceleration 'a' with displacement x?
View SolutionFor constructive interference, the phase difference between the two interfering waves is
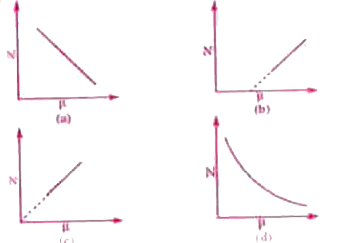
View SolutionA Young.s double slit experiment set up is completely submerged in a transparent liquid. Which of the following graphs best represent the variation of total number of fringes N observed on the screen with the index of referring μ of the liquid?
 View Solution
Which of the following x-t graphs represents the distance-time variation of a body released from the top of a buiding?
View SolutionIn Young's double-slit experiment, the path difference between two interfering waves at a point on the screen is 13.5 times the wavelength. The point is
View SolutionIn Young's double slit experiment, the phase difference between the two waves reaching at the location of the third dark fringe is
View SolutionA beam of light consisting of two wavelengths, 650 nm and 520 nm is used to obtain interference fringes in Young's double-slit experiment. What is the least distance (in m) from a central maximum where the bright fringes due to both the wavelengths coincide ? The distance between the slits is 3 mm and the distance between the plane of the slits and the screen is 150 cm.
View SolutionWhat is the difference between 2.0m and 2.00m.
View SolutionThe graph between the separation of the slits and fringe width in Young.s double slit experiment is (assume that the distance between the source and the screen and the wavelength of the source are kept constant)
View SolutionHow would the angular separation of interference fringes in Young's double slit experiment change when the distance of separation between slits and screen is doubled ?
View Solution

