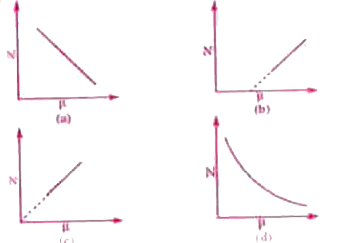
A Young.s double slit experiment set up is completely submerged in a transparent liquid. Which of the following graphs best represent the variation of total number of fringes N observed on the screen with the index of referring μ of the liquid?

If L is the size of the screen and β is the size of a fringe, then N=Ldλ∣D where λ∣=λμ
N=(LdλD)μ⇒NαM
The graph is a straight line, with +ve slope and passing through the origion.
Topper's Solved these Questions
Similar Questions
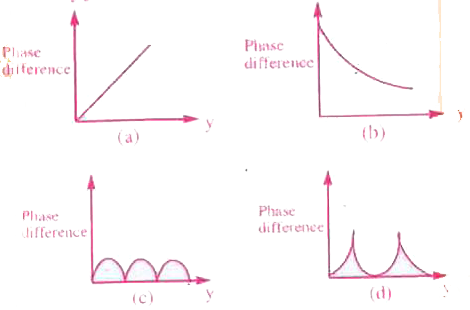
Which of the following graphs best represent the variation of phase difference between he interferring waves in a double slit experiment with the distance from the central maximum?

View SolutionIn Young's double-slit experiment, the slit are illuminated by monochromatic light. The entire set-up is immersed in pur water. Which of the following act cannot restore the oringinal fringe width?
View SolutionTwo stones are through up simultaneously from the edge of a cliff 240 m high with initial speed of 10 m/s and 40 m/s respectively. Which of the following graphs best represents the time variation of relative position of the second stone with respect to the first? Assume stones do not rebound after hitting the ground and neglect air resistance, take . g=10m/s2 (The figures are schematic and not drawn to scale)
View SolutionIn a Young's double slit experiment green light is incident on the two slits. The interference pattern is observed on a screen. Which of the following changes would cause the observed fringes to be more closely spaced ?

View Solution_E01_055_Q01.png)
In a young's double slit experiment, green light is incident on the two slits. The interference pattern is observed on a screen. Which of the following changes would cause the observed fringes to be more closely spaced?
View SolutionIn a Young’s double slit experiment, 16 fringes are observed in a certain segment of the screen when light of wavelength 700 nm is used. If the wavelength of light is changed to 400 nm, the number of fringes observed in the same segment of the screen would be:
View SolutionIn a Young's double slit experiment, 12 fringes are observed to be formed in a certain segment of the screen when light of wavelength 600nm is used. If the wavelength of light is changed to 400nm, number of fringes observed in the same segment of the screen is given by
View SolutionThe figure shows a Young's double slit experimental setup. It is observed that when a thin transparent sheet of thickness t and refractive index μ is put front of one of the slits, the central maximum gets shifted by a distance equal to n fringe widths. If the wavelength of light used is λ, t will be :

View SolutionA young's double slit apporatus is immersed in a liquid of refractive index 1.33.It has slit separation of 1 mm and interference pattern is observed on the screen at a distance 1.33 m from plane of slits.The wavelength in air is 6300Å
Find the distance of seventh bright fringe from third bright fringe lying on the same side of central bright fringe.
View SolutionA young's double slit apporatus is immersed in a liquid of refractive index 1.33.It has slit separation of 1 mm and interference pattern is observed on the screen at a distance 1.33 m from plane of slits.The wavelength in air is 6300Å
One of the slits of the apparatus is covered by a thin glass sheet of refractive index 1.53. Find the fringe width
View Solution
