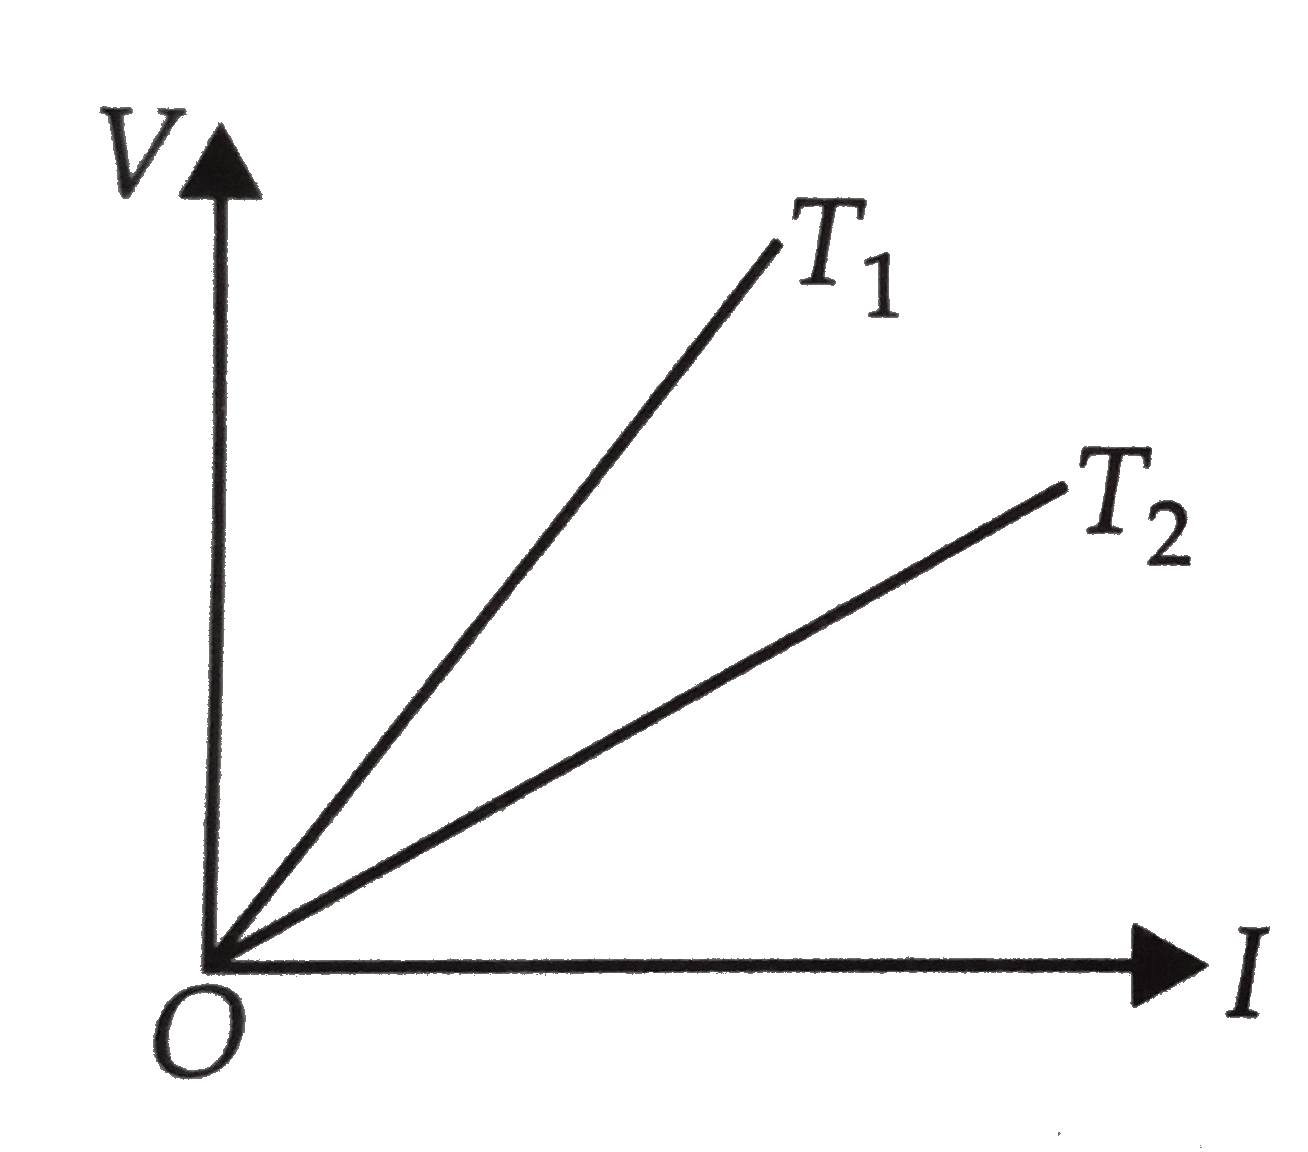
The voltage V and current I v graphs for a conductor at two different temperatures T1andT2 are shown in the figure. The relation between T1andT2 is

A
T1>T2
B
T1<T2
C
T1=T2
D
T1=1T2
Video Solution
Text Solution
The correct Answer is:A
The slope of V-I graph gives the resistance fo a conductor at a given temperature. From the graph, it follows that resistance of a conductor at temperature T1 is greater than at temperature T2. As the resistance of a conductor is more at higher temperature and less at lower temperature, hence T1>T2
|
Updated on:21/07/2023
Related Playlists
- BOOK - NCERT FINGERTIPSCHAPTER - CURRENT ELECTRICITYEXERCISE - Drift Of Electrons And The Origin Of Resistivity2videos
CURRENT ELECTRICITY
- BOOK - NCERT FINGERTIPSCHAPTER - CURRENT ELECTRICITYEXERCISE - Limitations Of Ohm'S Law4videos
CURRENT ELECTRICITY
- BOOK - NCERT FINGERTIPSCHAPTER - CURRENT ELECTRICITYEXERCISE - Electric Current In Conductors2videos
CURRENT ELECTRICITY
- BOOK - NCERT FINGERTIPSCHAPTER - COMMUNITCATION SYSTEMSEXERCISE - HOTS10videos
COMMUNITCATION SYSTEMS
- BOOK - NCERT FINGERTIPSCHAPTER - DUAL NATURE OF RADIATION AND MATTER EXERCISE - Assertion And Reason15videos
DUAL NATURE OF RADIATION AND MATTER
Similar Practice Problems
- Question 1 - Select One
The voltage V and current I graph for a conductor at two different temperatures T1 and T2 are shown in the figure. The relation between T1 and T2 is
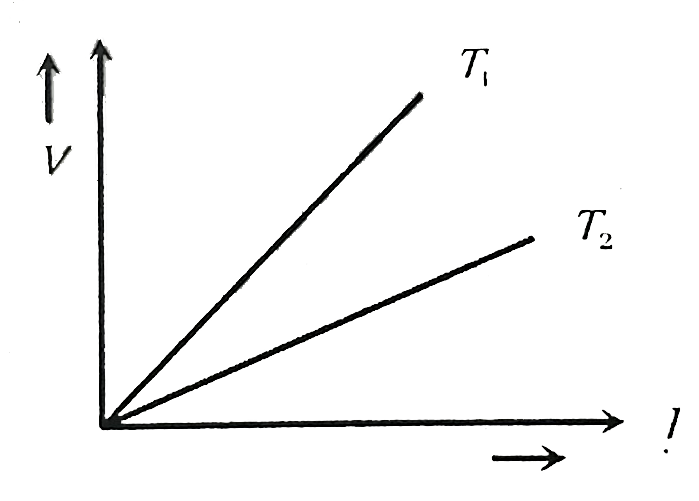 AT1>T2BT1≈T2CT1=T2DT1<T2
 - Question 1 - Select One
The current (I) and voltage (V) graphs for a given metallic wire at two different temperature (T1) and (T2) are shown in fig. It is concluded that
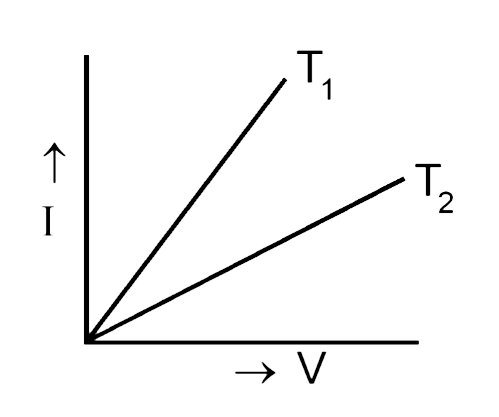 AT1=T2BT1>T2CT1<T2DNone of these
 - Question 1 - Select One
The V - i graph for a conductor at temperature T1 and T2 are as shown in the figure. (T2−T1) is proportional to
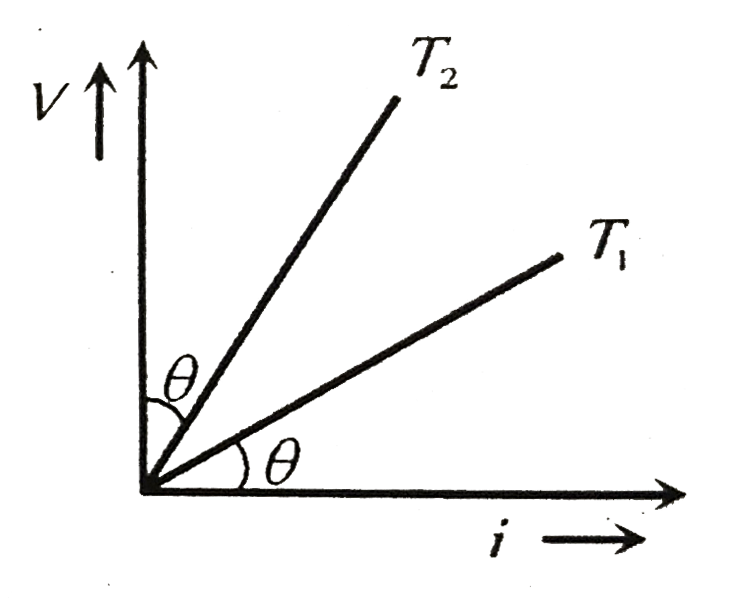 Acot2θBsinθCcot2θDtanθ
 - Question 1 - Select One
The V - I graphs for a conductor at temperature T1andT2 are shown in the figure (T2−T1) is proportional to
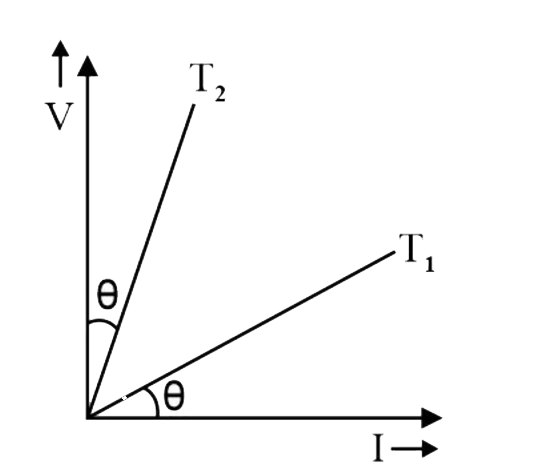 AtanθBsinθCcot2θDcos2θ
 - Question 1 - Select One
The V−i graph for a conductor at temeratures T1 and T2 are as shown in the figure. (T2−T1) is alphaortional to.
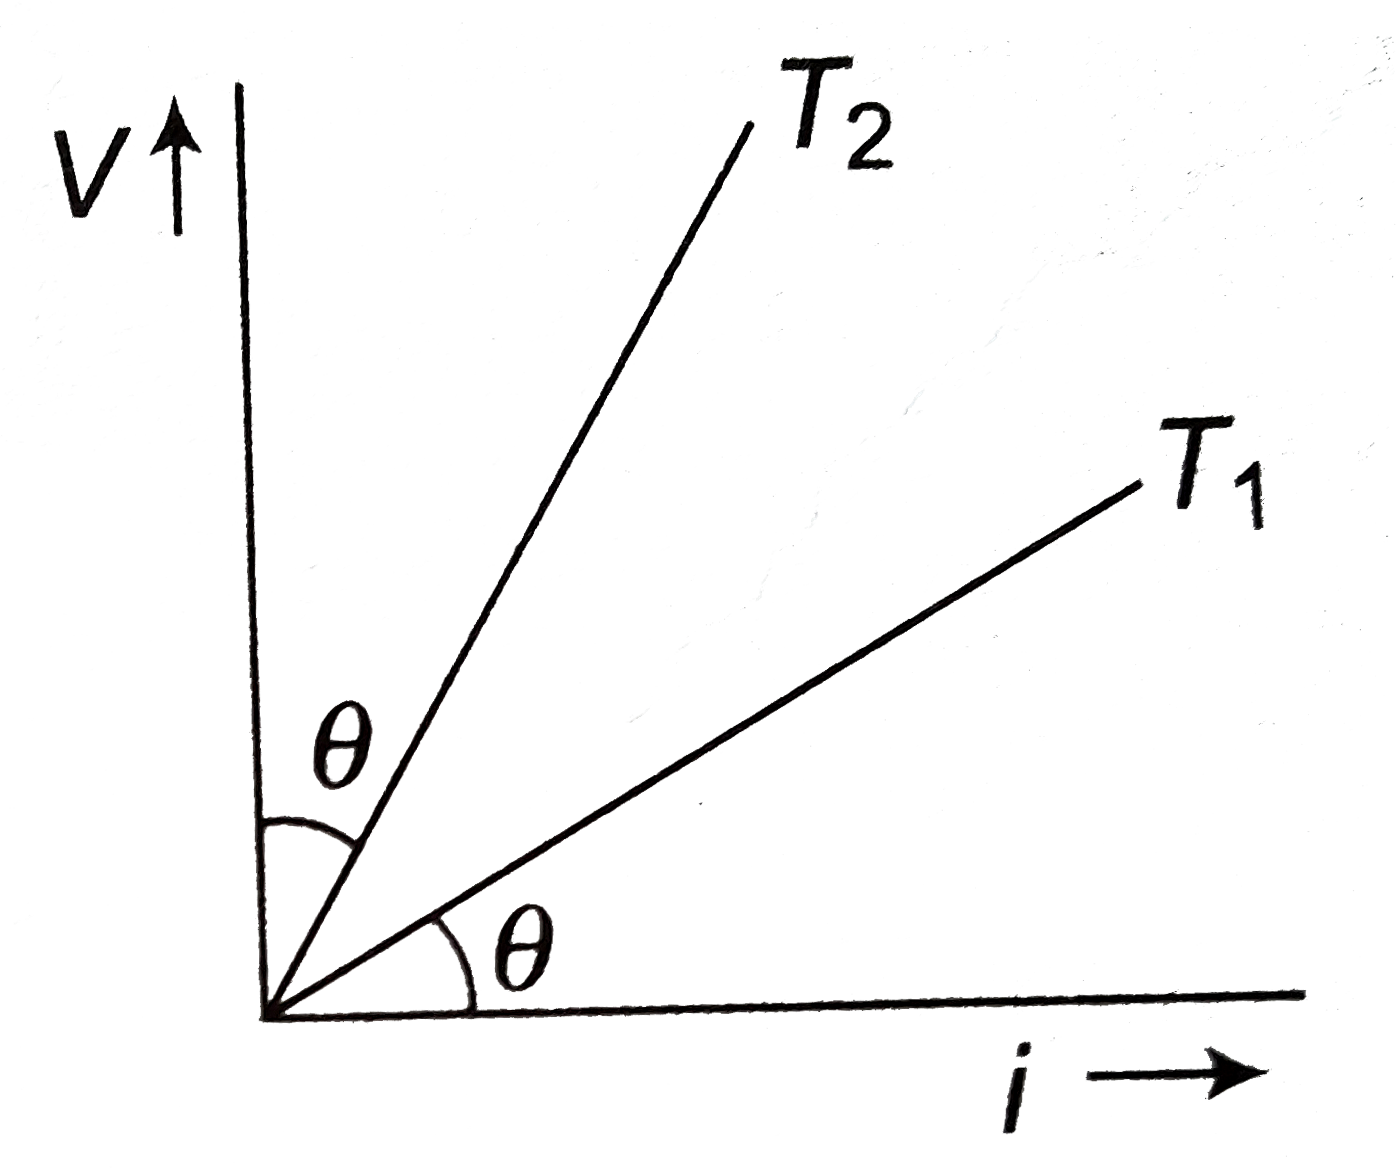 .Acos2θBsinθCcot2θDtanθ
 - Question 1 - Select One
The V-l graph for a conductor at temperatures T1 and T2 are as shown in the figure. The term T2−T1 is proportional to
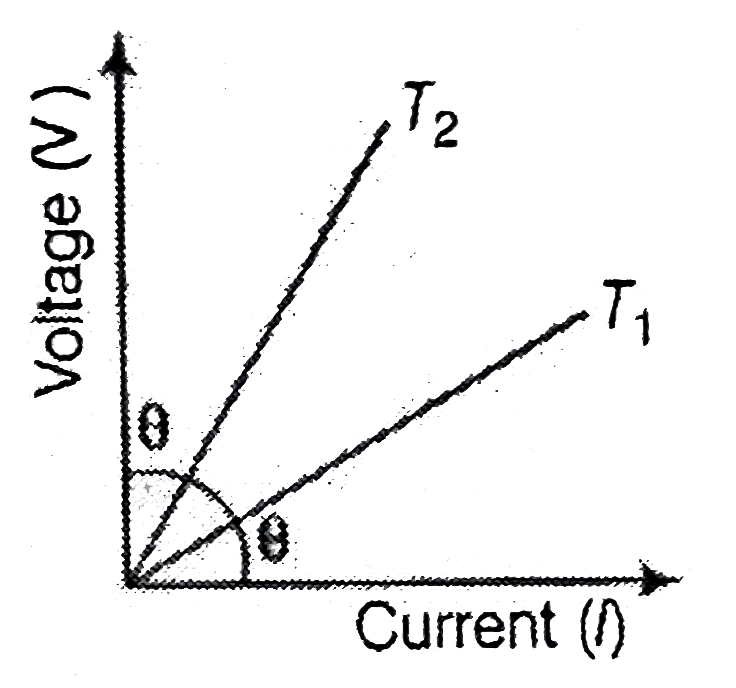 Acos2θBsin2θCcot2θDtan2θ
 - Question 1 - Select One
Assertion : Current versus potential difference (i-V) graph for a conductor at two different temperatures T1 and T2 is shown in figure. Hence T1>T2.
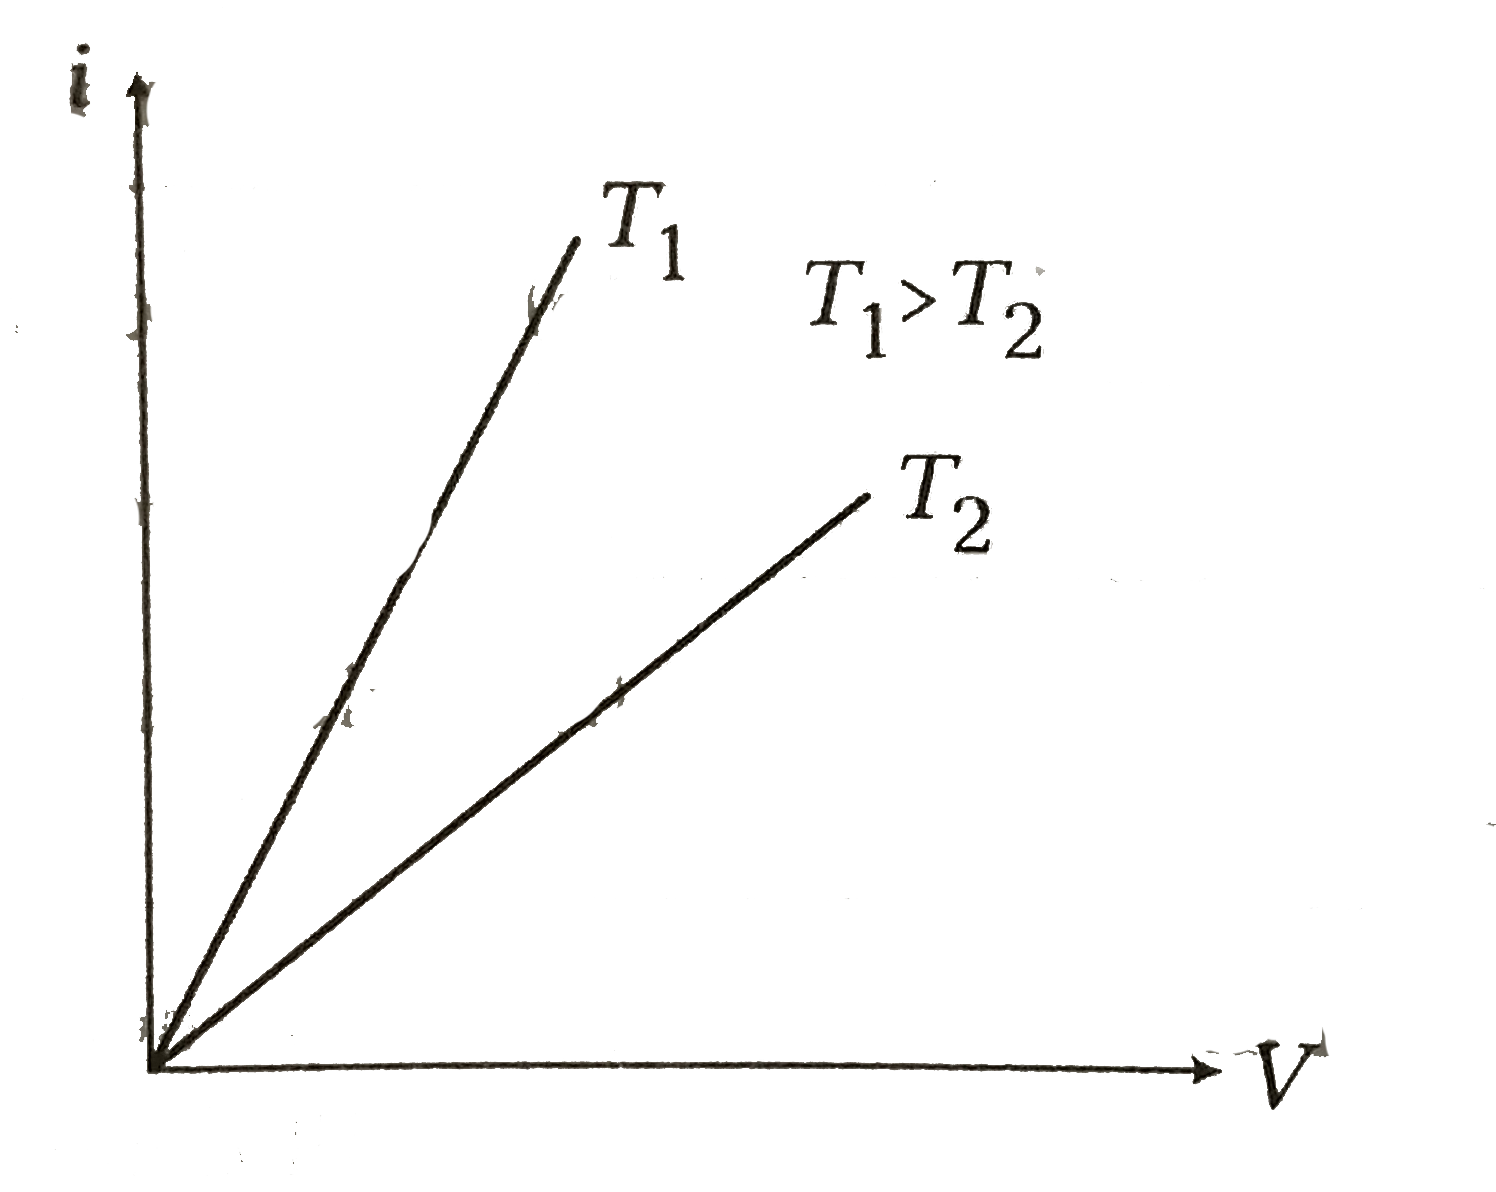
Reason : Resistance of a conductor increases with rise in temperature.AIf both Assertion and Reason are true and Reason is the correct explanation of Assertion.BIf both Assertion and Reason are true and Reason is not correct explanation of Assertion.CIf Assertion is true but Reason is false.DIf Assertion is false but Reason is true.
Similar Questions
The current - voltage graphs for a given metallic wire at two different temperatures T1andT2 are shown in the figure.
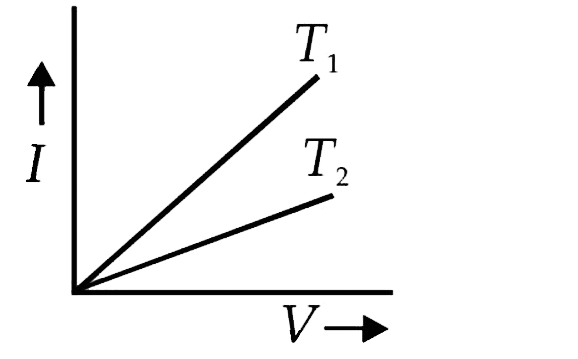
The temperature T2 is greater than T1.View SolutionThe current-coltage graphs for a given metallic wire at two differenct tempeature T1 and T2 are shown in the figure. Which one is higher, T1 or T2
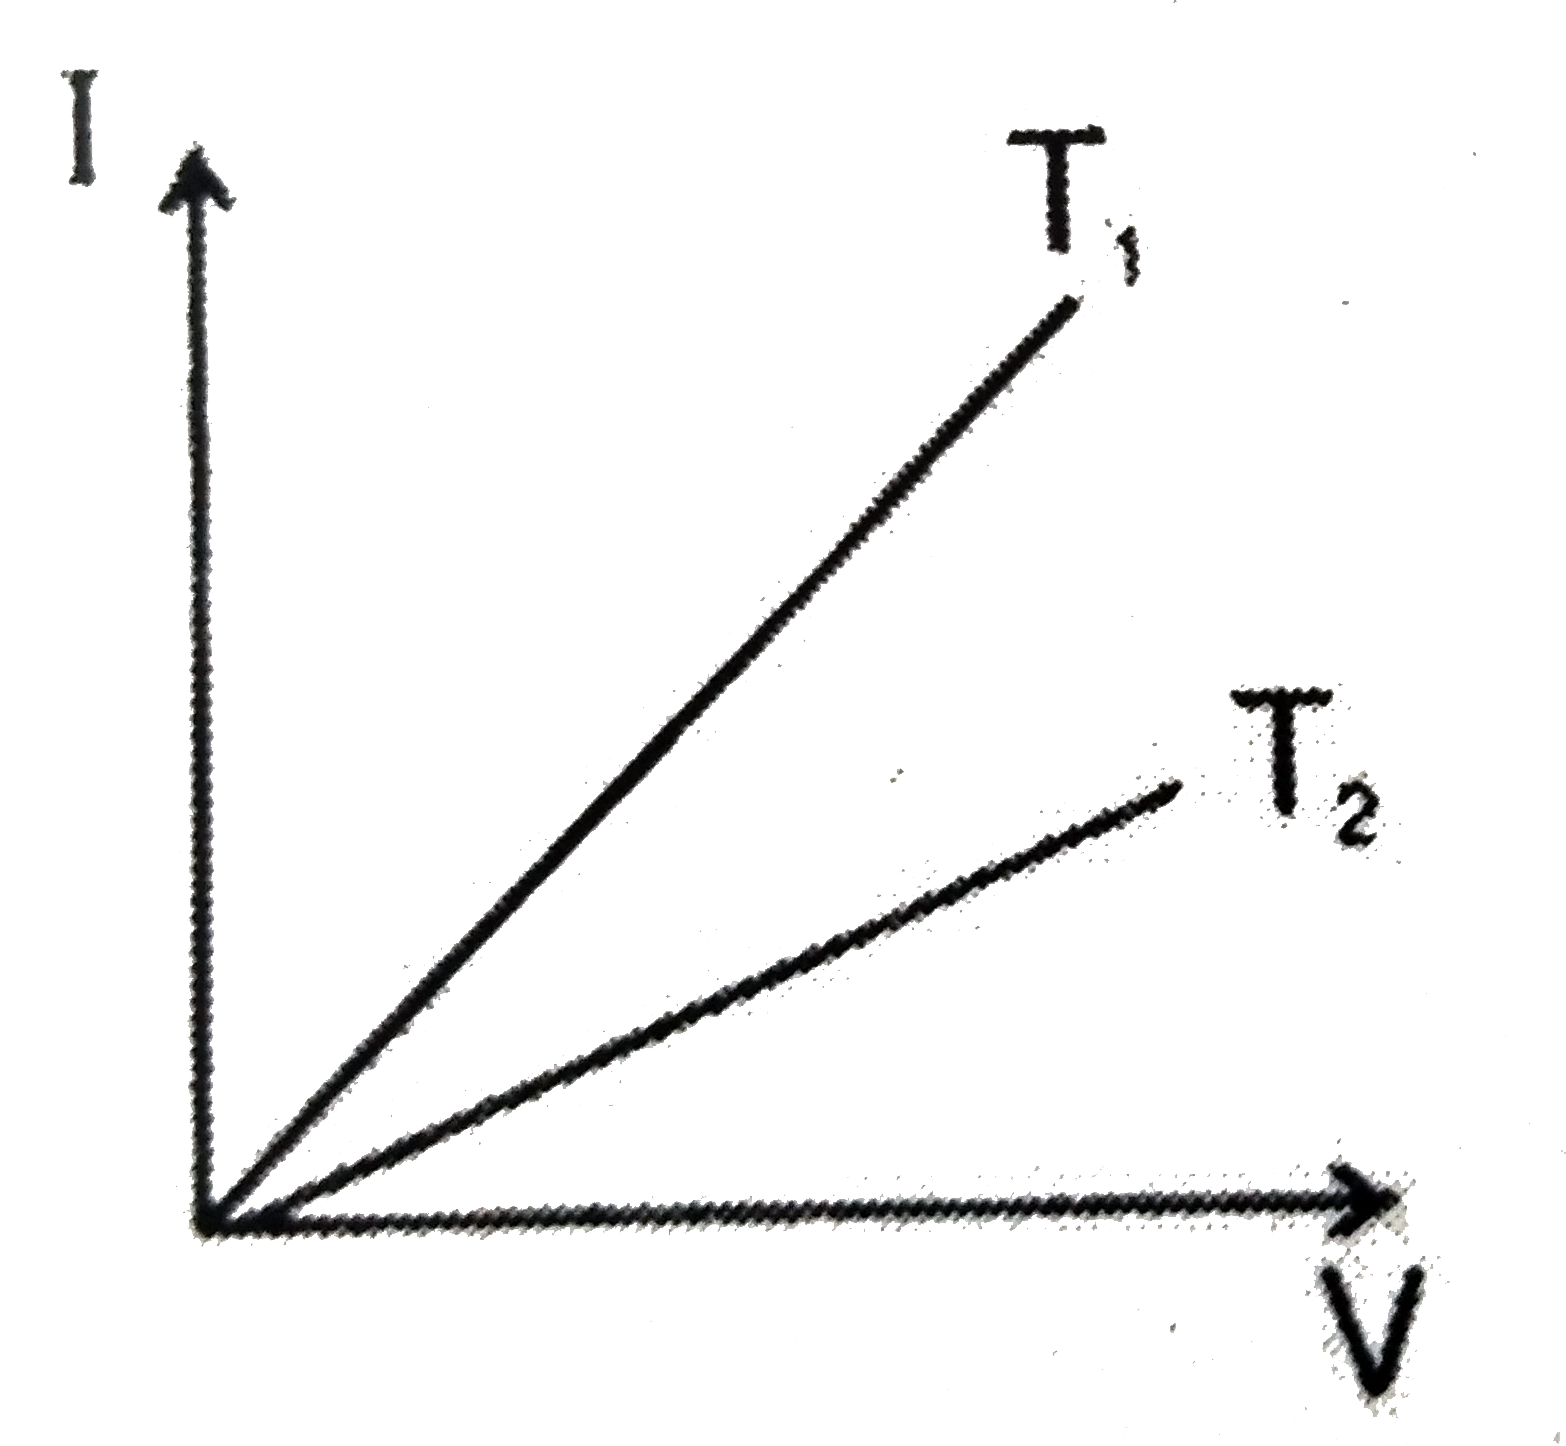 View Solution
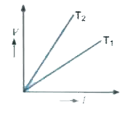
The voltage-current (V-I) graph of a metallic conductor at two different temperature T1 and T2 is shown in figure. At which temperature is the resistance higher?
 View Solution

